The Scarlet Solar Array - PDS Small Bodies Node
The Scarlet Solar Array - PDS Small Bodies Node
The Scarlet Solar Array - PDS Small Bodies Node
- No tags were found...

Create successful ePaper yourself
Turn your PDF publications into a flip-book with our unique Google optimized e-Paper software.
DS1 <strong>Scarlet</strong> Technology Validation Page 16<br />
stopping at two intermediate points between nominal bus<br />
loads and maximum power, as shown in Figure 20. This<br />
was done to allow intermediate power level data to be<br />
recorded and to let the array cool to near the full power<br />
12<br />
11<br />
See detailed graph below<br />
120<br />
110<br />
Wing Current (A), <strong>Array</strong> Power (W/1000)<br />
10<br />
9<br />
8<br />
7<br />
6<br />
5<br />
4<br />
3<br />
2<br />
Wing 1 Amps<br />
Wing 2 Amps<br />
W/1000<br />
Voltage<br />
100<br />
90<br />
80<br />
70<br />
60<br />
50<br />
40<br />
30<br />
20<br />
<strong>Array</strong> Voltage (V)<br />
Amperes<br />
Figure 18. Historical Sunspot Activity<br />
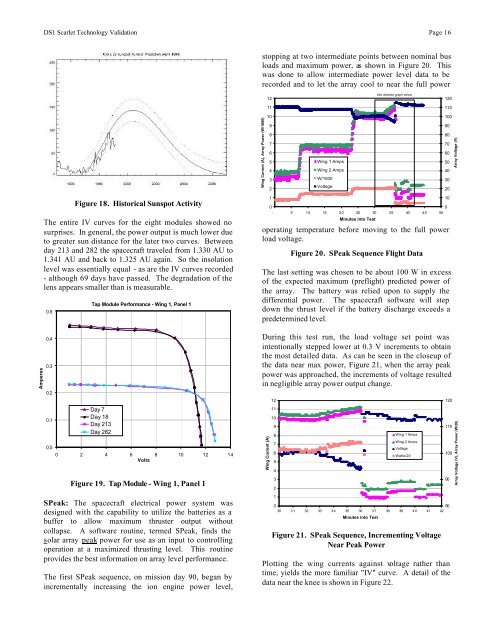
<strong>The</strong> entire IV curves for the eight modules showed no<br />
surprises. In general, the power output is much lower due<br />
to greater sun distance for the later two curves. Between<br />
day 213 and 282 the spacecraft traveled from 1.330 AU to<br />
1.341 AU and back to 1.325 AU again. So the insolation<br />
level was essentially equal - as are the IV curves recorded<br />
- although 69 days have passed. <strong>The</strong> degradation of the<br />
lens appears smaller than is measurable.<br />
0.5<br />
0.4<br />
0.3<br />
0.2<br />
0.1<br />
0.0<br />
Tap Module Performance - Wing 1, Panel 1<br />
Day 7<br />
Day 18<br />
Day 213<br />
Day 282<br />
0 2 4 6 8 10 12 14<br />
Volts<br />
Figure 19. Tap Module - Wing 1, Panel 1<br />
SPeak: <strong>The</strong> spacecraft electrical power system was<br />
designed with the capability to utilize the batteries as a<br />
buffer to allow maximum thruster output without<br />
collapse. A software routine, termed SPeak, finds the<br />
solar array peak power for use as an input to controlling<br />
operation at a maximized thrusting level. This routine<br />
provides the best information on array level performance.<br />
<strong>The</strong> first SPeak sequence, on mission day 90, began by<br />
incrementally increasing the ion engine power level,<br />
operating temperature before moving to the full power<br />
load voltage.<br />
Figure 20. SPeak Sequence Flight Data<br />
<strong>The</strong> last setting was chosen to be about 100 W in excess<br />
of the expected maximum (preflight) predicted power of<br />
the array. <strong>The</strong> battery was relied upon to supply the<br />
differential power. <strong>The</strong> spacecraft software will step<br />
down the thrust level if the battery discharge exceeds a<br />
predetermined level.<br />
During this test run, the load voltage set point was<br />
intentionally stepped lower at 0.3 V increments to obtain<br />
the most detailed data. As can be seen in the closeup of<br />
the data near max power, Figure 21, when the array peak<br />
power was approached, the increments of voltage resulted<br />
in negligible array power output change.<br />
Wing Current (A)<br />
1<br />
0<br />
0<br />
- 5 10 15 20 25 30 35 40 45 50<br />
12<br />
11<br />
10<br />
9<br />
8<br />
7<br />
6<br />
5<br />
4<br />
3<br />
2<br />
1<br />
Minutes into Test<br />
0<br />
80<br />
30 31 32 33 34 35 36 37 38 39 40 41 42<br />
Minutes into Test<br />
Wing 1 Amps<br />
Wing 2 Amps<br />
Voltage<br />
Watts/20<br />
Figure 21. SPeak Sequence, Incrementing Voltage<br />
Near Peak Power<br />
Plotting the wing currents against voltage rather than<br />
time, yields the more familiar "IV" curve. A detail of the<br />
data near the knee is shown in Figure 22.<br />
10<br />
120<br />
110<br />
100<br />
90<br />
<strong>Array</strong> Voltage (V), <strong>Array</strong> Power (W/20)