global manager watch - Alexander Forbes
global manager watch - Alexander Forbes
global manager watch - Alexander Forbes
- No tags were found...

Create successful ePaper yourself
Turn your PDF publications into a flip-book with our unique Google optimized e-Paper software.
JANUARY 2013/01/31 2012/11/01 2013/01/01 2012/02/01 2010/02/01 2008/02/01 2006/02/01 2003/02/01<br />
Manager Watch TM Series of Surveys<br />
for the month ending January 2013<br />
Manager Watch Series of Surveys<br />
January 2008
S.A. MANAGER WATCH TM - BEST INVESTMENT VIEW<br />
Objective - The portfolios are balanced (i.e. multiple asset class) portfolios, subject to the restrictions imposed by Regulation 28 of the Pension Funds Act and are confined to investing in South Africa only. These portfolios represent the <strong>manager</strong>s' best investment view.<br />
GENERAL INFORMATION<br />
GIPS<br />
(Verified/<br />
Compliant)<br />
Portfolio Type<br />
Notes<br />
Regulation 28<br />
Compliant<br />
Certification<br />
(Y/N)<br />
Benchmark Description<br />
Admin - efficiency :<br />
No.of funds<br />
Date data submitted<br />
in composite<br />
Portfolio Size<br />
(R m)<br />
INVESTMENT MANAGERS<br />
Absa Asset Management Domestic Balanced V Segregated 65% Capped All Share Index; 25% BESA All Bond Index; 10% STEFI Index 14 February 2013 2 2 111<br />
Allan Gray V Segregated Non-Investable SA LMW Average 07 February 2013 14 22 344<br />
Coronation V Segregated SA LMW Median 12 February 2013 12 11 780<br />
Element Balanced Composite C Segregated 60% All Share Index (ALSI), 25% All Bond Index (ALBI) and 15% Short-term Fixed Interest (STEFI) 13 February 2013 2 457<br />
Foord Segregated Domestic C Segregated 65% ALSI, 5% PROP, 25% ALBI, 5% STFCAD 14 February 2013 5 4 954<br />
Investec Asset Management V Segregated SA LMW Median 13 February 2013 8 6 792<br />
Investment Solutions Performer Local n/a Pooled multi-<strong>manager</strong> SA LMW Median 14 February 2013 n/a 11 658<br />
Investment Solutions Value Alpha Local n/a Pooled multi-<strong>manager</strong> SA LMW Median 14 February 2013 n/a 311<br />
Oasis V Segregated SA BIV Average 13 February 2013 1 383<br />
Pan-African C Segregated ALSI 60%: ALBI 40% 15 February 2013 0 285<br />
Prescient Domestic Balanced Segregated SA BIV Average 11 February 2013 0 371<br />
Prudential Domestic Balanced V Segregated The total fund is benchmarked against the MEDIAN performance of the Domestic LMW performance. 06 February 2013 2 2 752<br />
RE:CM Balanced Domestic Composite V Segregated CPIX + 8%pa (ECPIX on INET) 14 February 2013 4 1 088<br />
Momentum AM Domestic Balanced Fund V Segregated SA LMW Median 14 February 2013 4 844<br />
SIM Domestic Unique V Segregated SA LMW Median 12 February 2013 1 322<br />
This includes multi-<strong>manager</strong>s thus must<br />
be noted as possible "double-counting" TOTAL 66 453<br />
* Reasonable use of the survey may be made for purposes of comment and study provided that full acknowledgement is made to "<strong>Alexander</strong> <strong>Forbes</strong> Research & Product Development".<br />
* While all possible care is taken in the compilation of the Survey, reliance is placed on information received from Investment Managers.<br />
* The rankings and statistical information have been supplied for illustrative purposes only.<br />
* Performance figures are shown gross of fees.<br />
* Performance should not be judged over a short period of time.<br />
* Past performance is not necessarily a guide to future performance.
S.A. MANAGER WATCH TM - BEST INVESTMENT VIEW<br />
Objective - The portfolios are balanced (i.e. multiple asset class) portfolios, subject to the restrictions imposed by Regulation 28 of the Pension Funds Act and are confined to investing in South Africa only. These portfolios represent the <strong>manager</strong>s' best investment view.<br />
INVESTMENT DATA TO THE END OF JANUARY 2013<br />
PERFORMANCE DATA<br />
Month Quarter<br />
Year to Date<br />
1 Year<br />
3 Years (p.a.) 5 Years (p.a.)<br />
7 Years (p.a.)<br />
10 Years (p.a.)<br />
Portfolio Rank Benchmark Portfolio Rank Benchmark Portfolio Rank Benchmark Portfolio Rank Benchmark Portfolio Rank Benchmark Portfolio Rank Benchmark Portfolio Rank Benchmark Portfolio Rank Benchmark<br />
INVESTMENT MANAGERS<br />
Absa Asset Management Domestic Balanced 1.60% 13 2.14% 4.74% 14 6.96% 1.60% 13 2.14% 15.46% 11 19.46% 15.25% 10 16.02% 13.78% 6 12.28% 14.31% 9 13.02% * *<br />
Allan Gray 3.08% 2 2.41% 5.59% 11 6.31% 3.08% 2 2.41% 15.41% 12 18.70% 15.07% 11 16.46% 13.47% 7 12.65% 14.95% 5 13.66% 20.63% 3 19.13%<br />
Coronation 3.39% 1 2.54% 7.64% 2 6.76% 3.39% 1 2.54% 21.59% 4 19.11% 18.15% 3 16.56% 15.06% 2 13.20% 15.30% 2 14.03% 20.85% 2 19.44%<br />
Element Balanced Composite 2.77% 5 2.02% 5.00% 13 6.55% 2.77% 5 2.02% 13.17% 13 18.36% * * * * * * * *<br />
Foord Segregated Domestic 1.54% 14 2.21% 6.83% 5 7.31% 1.54% 14 2.21% 27.33% 1 20.64% 21.00% 1 16.66% 16.15% 1 11.42% 15.75% 1 12.63% 20.86% 1 17.18%<br />
Investec Asset Management 2.96% 3 1.05% 6.51% 7 6.16% 2.96% 3 1.05% 19.23% 8 19.97% 16.15% 8 16.17% 12.93% 9 11.91% 15.23% 3 12.52% 20.37% 5 17.18%<br />
Investment Solutions Performer Local 2.77% 4 2.61% 6.87% 4 7.25% 2.77% 4 2.61% 20.99% 6 18.41% 17.78% 6 16.29% 14.36% 4 13.04% 14.74% 6 13.92% 19.97% 7 19.36%<br />
Investment Solutions Value Alpha Local 2.51% 10 2.61% 6.80% 6 7.25% 2.51% 10 2.61% 21.43% 5 18.42% 17.85% 5 16.30% 14.31% 5 13.04% 14.72% 7 13.93% 20.00% 6 19.36%<br />
Oasis 2.71% 7 2.40% 8.12% 1 6.23% 2.71% 7 2.40% 23.02% 2 18.36% 18.06% 4 16.17% 13.14% 8 12.82% 14.36% 8 13.58% 19.05% 8 18.74%<br />
Pan-African 2.59% 8 2.56% 5.86% 9 6.56% 2.59% 8 2.56% 18.14% 9 18.97% 15.50% 9 16.43% 11.58% 11 13.21% 12.06% 12 13.80% 16.70% 11 18.82%<br />
Prescient Domestic Balanced 1.96% 12 0.24% 5.10% 12 0.72% 1.96% 12 0.24% 11.62% 14 5.31% * * * * * * * *<br />
Prudential Domestic Balanced 2.72% 6 2.56% 7.54% 3 6.56% 2.72% 6 2.56% 22.59% 3 18.97% 19.41% 2 16.43% 14.79% 3 13.21% 15.15% 4 13.80% 20.48% 4 18.82%<br />
RE:CM Balanced Domestic Composite 2.54% 9 0.88% 4.02% 15 3.07% 2.54% 9 0.88% 4.93% 15 14.08% 9.54% 13 13.45% 11.00% 13 14.76% 10.73% 13 14.86% * *<br />
Momentum AM Domestic Balanced Fund 1.04% 15 1.15% 5.67% 10 6.21% 1.04% 15 1.15% 17.06% 10 20.80% 14.47% 12 16.37% 11.53% 12 12.07% 12.67% 10 12.90% 18.45% 9 17.22%<br />
SIM Domestic Unique 2.48% 11 2.54% 6.45% 8 6.76% 2.48% 11 2.54% 19.47% 7 19.11% 16.77% 7 16.56% 11.97% 10 13.20% 12.31% 11 14.03% 18.04% 10 19.44%<br />
* Reasonable use of the survey may be made for purposes of comment and study provided that full acknowledgement is made to "<strong>Alexander</strong> <strong>Forbes</strong> Research & Product Development".<br />
* While all possible care is taken in the compilation of the Survey, reliance is placed on information received from Investment Managers.<br />
* The rankings and statistical information have been supplied for illustrative purposes only.<br />
* Reasonable use of the survey may be made for purposes of comment and study provided that full acknowledgement is made to "<strong>Alexander</strong> <strong>Forbes</strong> Research & Product Development.<br />
* Performance should not be judged over a short period of time.<br />
* Past history is not necessarily a guide to future performance.
S.A. MANAGER WATCH TM - BEST INVESTMENT VIEW<br />
Objective - The portfolios are balanced (i.e. multiple asset class) portfolios, subject to the restrictions imposed by Regulation 28 of the Pension Funds Act and are confined to investing in South Africa only. These portfolios represent the <strong>manager</strong>s' best investment<br />
view.<br />
INVESTMENT DATA TO THE END OF JANUARY 2013<br />
RISK VS RETURN<br />
Calculated on 3 year performance returns<br />
Calculated on 5 year performance returns<br />
3 Year Return<br />
(p.a.)<br />
Rank<br />
Active Tracking<br />
5 Year Return<br />
Volatility Rank Sharpe Ratio<br />
Rank Volatility Rank<br />
Return Error<br />
(p.a.)<br />
Active<br />
Return<br />
Tracking<br />
Error<br />
Sharpe Ratio<br />
Absa Asset Management Domestic Balanced 15.25% 10 7.93% 8 -0.77% 1.63% 1.17 13.78% 6 9.86% 4 1.50% 2.96% 0.62<br />
Allan Gray 15.07% 11 4.96% 2 -1.39% 3.78% 1.83 13.47% 7 8.67% 2 0.82% 5.29% 0.67<br />
Coronation 18.15% 3 7.99% 9 1.59% 1.32% 1.52 15.06% 2 11.13% 8 1.87% 1.38% 0.66<br />
Foord Segregated Domestic 21.00% 1 8.81% 12 4.34% 2.68% 1.70 16.15% 1 11.37% 9 4.73% 4.27% 0.74<br />
Investec Asset Management 16.15% 8 7.90% 7 -0.02% 2.87% 1.29 12.93% 9 12.35% 13 1.02% 4.64% 0.42<br />
Investment Solutions Performer Local 17.78% 6 7.44% 4 1.48% 1.16% 1.58 14.36% 4 10.43% 7 1.32% 1.63% 0.64<br />
Investment Solutions Value Alpha Local 17.85% 5 6.70% 3 1.55% 2.11% 1.77 14.31% 5 9.55% 3 1.26% 2.87% 0.69<br />
Oasis 18.06% 4 7.55% 5 1.90% 1.38% 1.60 13.14% 8 9.86% 5 0.31% 2.28% 0.55<br />
Pan-African Asset Management 15.50% 9 7.62% 6 -0.93% 1.78% 1.25 11.58% 11 10.42% 6 -1.64% 2.46% 0.37<br />
Prudential Domestic Balanced 19.41% 2 9.35% 13 2.97% 1.94% 1.43 14.79% 3 11.89% 12 1.58% 1.97% 0.60<br />
Momentum AM Domestic Balanced Fund 14.47% 12 8.73% 11 -1.90% 1.37% 0.97 11.53% 12 11.70% 11 -0.55% 2.51% 0.33<br />
RE:CM Balanced Domestic Composite 9.54% 13 4.87% 1 -3.90% * 0.73 11.00% 13 7.08% 1 -3.77% * 0.47<br />
SIM Domestic Unique 16.77% 7 8.42% 10 0.21% 0.89% 1.28 11.97% 10 11.68% 10 -1.22% 1.86% 0.37<br />
Lower volatility =<br />
higher ranking<br />
STATISTICS<br />
Range 11.46% 5.16%<br />
Highest 21.00% 9.35% 4.34% 3.78% 1.83 16.15% 12.35% 4.73% 5.29% 0.74<br />
Upper Quartile 18.06% 8.42% 1.59% 2.25% 1.60 14.36% 11.68% 1.50% 3.29% 0.66<br />
Median 16.45% 7.90% 0.21% 1.71% 1.43 13.23% 10.43% 1.02% 2.49% 0.60<br />
Average 16.15% 7.56% 0.39% 1.91% 1.39 12.81% 10.46% 0.56% 2.84% 0.55<br />
Lower Quartile 15.25% 7.44% -0.93% 1.36% 1.25 11.97% 9.86% -0.55% 1.94% 0.42<br />
Lowest 9.54% 4.87% -3.90% 0.89% 0.73 11.00% 7.08% -3.77% 1.38% 0.33<br />
Number of participants 13 13 13 13 13 13 13 13<br />
* Reasonable use of the survey may be made for purposes of comment and study provided that full acknowledgement is made to "<strong>Alexander</strong> <strong>Forbes</strong> Research & Product Development.<br />
* While all possible care is taken in the compilation of the Survey, reliance is placed on information received from Investment Managers.<br />
* The rankings and statistical information have been supplied for illustrative purposes only.<br />
* Performance figures are shown gross of fees.<br />
* Quantitative figures are calculated on 3 year performance returns.<br />
* Performance should not be judged over a short period of time.<br />
* Past history is not necessarily a guide to future performance.<br />
Lower volatility = higher<br />
ranking
Return (p.a.)<br />
S.A. MANAGER WATCH TM - BEST INVESTMENT<br />
VIEW<br />
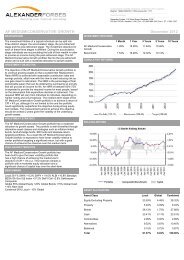
Volatility vs Return Scatterplot - SA BIV<br />
3 Years ended 31 January 2013<br />
Foord Segregated Domestic<br />
20.00%<br />
Prudential Domestic Balanced<br />
18.50%<br />
Investment Solutions Value Alpha Local<br />
Investment Solutions Performer Local<br />
Oasis<br />
Coronation<br />
17.00%<br />
SIM Domestic Unique<br />
Investec Asset Management<br />
15.50%<br />
Allan Gray<br />
Pan-African Asset Management<br />
Absa Asset Management Domestic Balanced<br />
14.00%<br />
Momentum AM Domestic Balanced Fund<br />
12.50%<br />
11.00%<br />
RE:CM Balanced Domestic Composite<br />
9.50%<br />
4.80% 5.30% 5.80% 6.30% 6.80% 7.30% 7.80% 8.30% 8.80% 9.30%<br />
Volatility (p.a.) (standard deviation)<br />
* Reasonable use of the survey may be made for purposes of comment and study provided that full acknowledgement is made to "<strong>Alexander</strong> <strong>Forbes</strong> Research & Product Development".<br />
** Please see final page for Disclaimers and Glossary **
S.A. MANAGER WATCH TM - CONSERVATIVE<br />
Objective - The portfolios are balanced (i.e. multiple asset class) portfolios, subject to the restrictions imposed by Regulation 28 of the Pension Funds Act and aim to minimise the probability of short-term (i.e. less than one year) capital loss<br />
GENERAL INFORMATION<br />
GIPS<br />
(Verified/<br />
Compliant)<br />
Portfolio Type<br />
Notes<br />
Regulation 28<br />
Compliant<br />
Certification<br />
(Y/N)<br />
Benchmark Description<br />
Admin - efficiency :<br />
Date data submitted<br />
No.of funds<br />
in composite<br />
Portfolio Size<br />
(R m)<br />
INVESTMENT MANAGERS<br />
Allan Gray Life Domestic Stable Portfolio V Pooled Non-Investable <strong>Alexander</strong> <strong>Forbes</strong> 3 month Deposit Index plus 2% 07 February 2013 n/a 1 972<br />
Investment Solutions Conserver Local n/a Pooled multi-<strong>manager</strong> 40% SWIX, 30% ALBI, 30% SteFI Call Deposit Index 14 February 2013 n/a 2 518<br />
Prudential Domestic Conservative Balanced V Segregated The total fund is benchmarked against the Bespoke Benchmark 06 February 2013 1 1 002<br />
This includes multi-<strong>manager</strong>s thus must<br />
be noted as possible "double-counting" TOTAL 5 492<br />
* Reasonable use of the survey may be made for purposes of comment and study provided that full acknowledgement is made to "<strong>Alexander</strong> <strong>Forbes</strong> Research & Product Development".<br />
* While all possible care is taken in the compilation of the Survey, reliance is placed on information received from Investment Managers.<br />
* The rankings and statistical information have been supplied for illustrative purposes only.<br />
* Performance figures are shown gross of fees.<br />
* Performance should not be judged over a short period of time.<br />
* Past performance is not necessarily a guide to future performance.
S.A. MANAGER WATCH TM - CONSERVATIVE<br />
Objective - The portfolios are balanced (i.e. multiple asset class) portfolios, subject to the restrictions imposed by Regulation 28 of the Pension Funds Act and aim to minimise the probability of short-term (i.e. less than one year) capital loss<br />
INVESTMENT DATA TO THE END OF JANUARY 2013<br />
PERFORMANCE DATA<br />
Month Quarter Year to Date 1 Year 3 Years (p.a.) 5 Years (p.a.) 7 Years (p.a.) 10 Years (p.a.)<br />
Portfolio Rank Benchmark Portfolio Rank Benchmark Portfolio Rank Benchmark Portfolio Rank Benchmark Portfolio Rank Benchmark Portfolio Rank Benchmark Portfolio Rank Benchmark Portfolio Rank Benchmark<br />
INVESTMENT MANAGERS<br />
Allan Gray Life Domestic Stable Portfolio 1.25% 3 * 1.93% 3 * 1.25% 3 * 7.43% 3 * 8.80% 3 * 10.31% 3 * 11.63% 3 * * *<br />
Investment Solutions Conserver Local 1.71% 1 0.74% 4.75% 2 4.57% 1.71% 1 0.74% 14.14% 2 15.55% 13.05% 2 13.33% 12.54% 2 10.86% 12.42% 2 11.05% * *<br />
Prudential Domestic Conservative Balanced 1.70% 2 0.75% 5.66% 1 4.61% 1.70% 2 0.75% 19.19% 1 15.70% 16.84% 1 13.49% 13.54% 1 13.20% 13.47% 1 11.20% 16.72% 1 14.04%<br />
* Reasonable use of the survey may be made for purposes of comment and study provided that full acknowledgement is made to "<strong>Alexander</strong> <strong>Forbes</strong> Research & Product Development".<br />
* While all possible care is taken in the compilation of the Survey, reliance is placed on information received from Investment Managers.<br />
* The rankings and statistical information have been supplied for illustrative purposes only.<br />
* Reasonable use of the survey may be made for purposes of comment and study provided that full acknowledgement is made to "<strong>Alexander</strong> <strong>Forbes</strong> Research & Product Development.<br />
* Performance should not be judged over a short period of time.<br />
* Past history is not necessarily a guide to future performance.
S.A. MANAGER WATCH TM - CONSERVATIVE<br />
Objective - The portfolios are balanced (i.e. multiple asset class) portfolios, subject to the restrictions imposed by Regulation 28 of the Pension Funds Act and are confined to investing in South Africa only. These portfolios represent the <strong>manager</strong>s' best investment<br />
view.<br />
INVESTMENT DATA TO THE END OF JANUARY 2013<br />
RISK VS RETURN<br />
Calculated on 3 year performance returns<br />
Calculated on 5 year performance returns<br />
3 Year Return<br />
(p.a.)<br />
Rank Volatility Rank<br />
Active<br />
Return<br />
Tracking<br />
Error<br />
Sharpe Ratio<br />
5 Year Return<br />
(p.a.)<br />
Rank Volatility Rank<br />
Active<br />
Return<br />
Tracking<br />
Error<br />
Sharpe Ratio<br />
Allan Gray Life Domestic Stable Portfolio 8.80% 3 1.18% 1 * * 2.38 10.31% 3 3.34% 1 * * 0.79<br />
Investment Solutions Conserver Local 13.05% 2 4.07% 2 -0.28% 2.14% 1.73 12.54% 2 6.16% 2 1.68% 2.78% 0.79<br />
Prudential Domestic Conservative Balanced 16.84% 1 6.48% 3 3.35% 1.26% 1.67 13.54% 1 7.90% 3 0.34% 1.72% 0.74<br />
Lower volatility =<br />
higher ranking<br />
STATISTICS<br />
Range 8.04% 3.23%<br />
Highest 16.84% 6.48% 3.35% 2.14% 2.38 13.54% 7.90% 1.68% 2.78% 78.69%<br />
Upper Quartile 14.94% 5.27% 2.44% 1.92% 2.05 13.04% 7.03% 1.35% 2.51% 78.67%<br />
Median 13.05% 4.07% 1.53% 1.70% 1.73 12.54% 6.16% 1.01% 2.25% 78.66%<br />
Average 12.90% 3.91% 1.53% 1.70% 1.93 12.13% 5.80% 1.01% 2.25% 77.15%<br />
Lower Quartile 10.93% 2.62% 0.62% 1.48% 1.70 11.42% 4.75% 0.68% 1.98% 76.38%<br />
Lowest 8.80% 1.18% -0.28% 1.26% 1.67 10.31% 3.34% 0.34% 1.72% 74.10%<br />
Number of participants 3 3 2 3 3 3 2 3<br />
* Reasonable use of the survey may be made for purposes of comment and study provided that full acknowledgement is made to "<strong>Alexander</strong> <strong>Forbes</strong> Research & Product Development.<br />
* While all possible care is taken in the compilation of the Survey, reliance is placed on information received from Investment Managers.<br />
* The rankings and statistical information have been supplied for illustrative purposes only.<br />
* Performance figures are shown gross of fees.<br />
* Quantitative figures are calculated on 3 year performance returns.<br />
* Performance should not be judged over a short period of time.<br />
* Past history is not necessarily a guide to future performance.<br />
Lower volatility = higher<br />
ranking
S.A. LARGE MANAGER WATCH TM<br />
Objective - The portfolios are balanced (i.e. multiple asset class) portfolios, subject to the restrictions imposed by Regulation 28 of the Pension Funds Act and are confined to investing in South Africa only. These portfolios represent the best investment view of the largest <strong>manager</strong>s of discretionary assets in<br />
South Africa, as determined under the survey rules imposed by <strong>Alexander</strong> <strong>Forbes</strong> Research & Product Development.<br />
INVESTMENT DATA TO THE END OF JANUARY 2013<br />
PERFORMANCE DATA<br />
Month Quarter Year to Date 1 Year 3 Years (p.a.) 5 Years (p.a.)<br />
7 Years (p.a.) 10 Years (p.a.)<br />
Portfolio Rank Benchmark Portfolio Rank Benchmark Portfolio Rank Benchmark Portfolio Rank Benchmark Portfolio Rank Benchmark Portfolio Rank Benchmark Portfolio Rank Benchmark Portfolio Rank Benchmark<br />
INVESTMENT MANAGERS<br />
Absa Asset Management Domestic Balanced 1.60% 8 2.14% 4.74% 9 6.96% 1.60% 8 2.14% 15.46% 8 19.46% * * * * * * * *<br />
Allan Gray 3.08% 2 2.41% 5.59% 8 6.31% 3.08% 2 2.41% 15.41% 9 18.70% 15.07% 7 16.46% 13.47% 4 12.65% 14.95% 5 13.66% 20.63% 3 19.13%<br />
Coronation 3.39% 1 2.54% 7.64% 2 6.76% 3.39% 1 2.54% 21.59% 4 19.11% 18.15% 3 16.56% 15.06% 2 13.20% 15.30% 2 14.03% 20.85% 2 19.44%<br />
Foord Segregated Domestic 1.54% 9 2.21% 6.83% 4 7.31% 1.54% 9 2.21% 27.33% 1 20.64% 21.00% 1 16.66% 16.15% 1 11.42% 15.75% 1 12.63% 20.86% 1 17.18%<br />
Investec Asset Management 2.96% 3 1.05% 6.51% 5 6.16% 2.96% 3 1.05% 19.23% 6 19.97% 16.15% 6 16.17% 12.93% 6 11.91% 15.23% 3 12.52% 20.37% 5 17.18%<br />
Oasis 2.71% 5 2.40% 8.12% 1 6.23% 2.71% 5 2.40% 23.02% 2 18.36% 18.06% 4 16.17% 13.14% 5 12.82% 14.36% 6 13.58% 19.05% 6 18.74%<br />
Prudential Domestic Balanced 2.72% 4 2.56% 7.54% 3 6.56% 2.72% 4 2.56% 22.59% 3 18.97% 19.41% 2 16.43% 14.79% 3 13.21% 15.15% 4 13.80% 20.48% 4 18.82%<br />
RE:CM Balanced Domestic Composite 2.54% 6 0.88% 4.02% 10 3.07% 2.54% 6 0.88% 4.93% 10 14.08% 9.54% 9 13.45% 11.00% 9 14.76% 10.73% 9 14.86% * * *<br />
Momentum AM Domestic Balanced Fund 1.04% 10 1.15% 5.67% 7 6.21% 1.04% 10 1.15% 17.06% 7 20.80% 14.47% 8 16.37% 11.53% 8 12.07% 12.67% 7 12.90% 18.45% 7 17.22%<br />
SIM Domestic Unique 2.48% 7 2.54% 6.45% 6 6.76% 2.48% 7 2.54% 19.47% 5 19.11% 16.77% 5 16.56% 11.97% 7 13.20% 12.31% 8 14.03% 18.04% 8 19.44%<br />
* Reasonable use of the survey may be made for purposes of comment and study provided that full acknowledgement is made to "<strong>Alexander</strong> <strong>Forbes</strong> Research & Product Development".<br />
* While all possible care is taken in the compilation of the Survey, reliance is placed on information received from Investment Managers.<br />
* The rankings and statistical information have been supplied for illustrative purposes only.<br />
* Performance figures are shown gross of fees.<br />
* Performance should not be judged over a short period of time.<br />
* Past history is not necessarily a guide to future performance.
S.A. LARGE MANAGER WATCH TM<br />
Objective - The portfolios are balanced (i.e. multiple asset class) portfolios, subject to the restrictions imposed by Regulation 28 of the Pension Funds Act and are confined to investing in South Africa only. These portfolios represent the best investment view of the largest <strong>manager</strong>s<br />
of discretionary assets in South Africa, as determined under the survey rules imposed by <strong>Alexander</strong> <strong>Forbes</strong> Research & Product Development.<br />
INVESTMENT DATA TO THE END OF JANUARY 2013<br />
RISK VS RETURN<br />
Calculated on 3 year performance returns<br />
Calculated on 5 year performance returns<br />
3 Year Return<br />
(p.a.)<br />
Rank Volatility Rank<br />
Active<br />
Return<br />
Tracking<br />
Error<br />
Sharpe Ratio<br />
5 Year Return<br />
(p.a.)<br />
Rank Volatility Rank<br />
Active<br />
Return<br />
Tracking<br />
Error<br />
Sharpe Ratio<br />
Allan Gray 15.07% 7 4.96% 2 -1.39% 3.78% 1.83 13.47% 4 8.67% 2 0.82% 5.29% 0.67<br />
Coronation 18.15% 3 7.99% 5 1.59% 1.32% 1.52 15.06% 2 11.13% 4 1.87% 1.38% 0.66<br />
Foord Segregated Domestic 21.00% 1 8.81% 8 4.34% 2.68% 1.70 16.15% 1 11.37% 5 4.73% 4.27% 0.74<br />
Investec Asset Management 16.15% 6 7.90% 4 -0.02% 2.87% 1.29 12.93% 6 12.35% 9 1.02% 4.64% 0.42<br />
Oasis 18.06% 4 7.55% 3 1.90% 1.38% 1.60 13.14% 5 9.86% 3 0.31% 2.28% 0.55<br />
Prudential Domestic Balanced 19.41% 2 9.35% 9 2.97% 1.94% 1.43 14.79% 3 11.89% 8 1.58% 1.97% 0.60<br />
RE:CM Balanced Domestic Composite 9.54% 9 4.87% 1 -3.90% 5.09% 0.73 11.00% 9 7.08% 1 -3.77% 7.14% 0.47<br />
Momentum AM Domestic Balanced Fund 14.47% 8 8.73% 7 -1.90% 1.37% 0.97 11.53% 8 11.70% 7 -0.55% 2.51% 0.33<br />
SIM Domestic Unique 16.77% 5 8.42% 6 0.21% 0.89% 1.28 11.97% 7 11.68% 6 -1.22% 1.86% 0.37<br />
Lower volatility =<br />
higher ranking<br />
STATISTICS<br />
Range 11.46% 5.16%<br />
Highest 21.00% 9.35% 4.34% 5.09% 1.83 16.15% 12.35% 4.73% 7.14% 0.74<br />
Upper Quartile 18.15% 8.73% 1.90% 2.87% 1.60 14.79% 11.70% 1.58% 4.64% 0.66<br />
Median 16.60% 7.99% 0.21% 1.94% 1.43 13.22% 11.37% 0.82% 2.51% 0.55<br />
Average 16.46% 7.62% 0.42% 2.37% 1.37 12.65% 10.64% 0.53% 3.48% 0.53<br />
Lower Quartile 15.07% 7.55% -1.39% 1.37% 1.28 11.97% 9.86% -0.55% 1.97% 0.42<br />
Lowest 9.54% 4.87% -3.90% 0.89% 0.73 11.00% 7.08% -3.77% 1.38% 0.33<br />
Number of participants 9 9 9 9 9 9 9 9 9 9<br />
* Reasonable use of the survey may be made for purposes of comment and study provided that full acknowledgement is made to "<strong>Alexander</strong> <strong>Forbes</strong> Research & Product Development.<br />
* While all possible care is taken in the compilation of the Survey, reliance is placed on information received from Investment Managers.<br />
* The rankings and statistical information have been supplied for illustrative purposes only.<br />
* Performance figures are shown gross of fees.<br />
* Quantitative figures are calculated on 3 year performance returns.<br />
* Performance should not be judged over a short period of time.<br />
* Past history is not necessarily a guide to future performance.<br />
Lower volatility = higher<br />
ranking
Return (p.a.)<br />
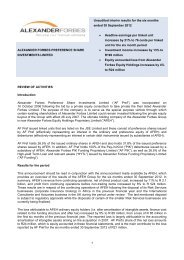
S.A. LARGE MANAGER WATCH TM<br />
Volatility vs Return Scatterplot - SA Large<br />
3 Years ended 31 January 2013<br />
Foord Segregated Domestic<br />
19.5%<br />
Oasis<br />
Coronation<br />
Prudential Domestic Balanced<br />
17.5%<br />
SIM Domestic Unique<br />
Investec Asset Management<br />
Momentum AM Domestic Balanced Fund<br />
15.5%<br />
Allan Gray<br />
13.5%<br />
11.5%<br />
RE:CM Balanced Domestic Composite<br />
9.5%<br />
4.8% 5.3% 5.8% 6.3% 6.8% 7.3% 7.8% 8.3% 8.8% 9.3%<br />
Volatility (p.a.) (standard deviation)<br />
* Reasonable use of the survey may be made for purposes of comment and study provided that full acknowledgement is made to "<strong>Alexander</strong> <strong>Forbes</strong> Research & Product Development".<br />
** Please see final page for Disclaimers and Glossary **
S.A. LARGE MANAGER WATCH TM<br />
Objective - The portfolios are balanced (i.e. multiple asset class) portfolios, subject to the restrictions imposed by Regulation 28 of the Pension Funds Act and are confined to investing in South Africa only. These statistics represent the various categories that portfolios are represented in but only for those <strong>manager</strong>s that are open to new investments.<br />
LOCAL INVESTABLE PERFORMANCE DATA ANALYSIS TO THE END OF JANUARY 2013<br />
Return - Month Return - Quarter Return - Year to Date Return - 1 Year Return - 3 Years (p.a.) Return - 5 Years (p.a.) Return - 7 Years (p.a.) Return - 10 Years (p.a.)<br />
SA BIV<br />
High 3.39% 8.12% 3.39% 27.33% 21.00% 16.15% 15.75% 20.86%<br />
Upper Quartile 2.75% 6.86% 2.75% 21.55% 18.08% 14.47% 15.17% 20.45%<br />
Median 2.56% 6.56% 2.56% 18.97% 16.43% 13.21% 13.80% 18.82%<br />
Average 2.40% 6.23% 2.40% 18.36% 16.17% 12.82% 13.58% 18.74%<br />
Asset-weighted Average 1.80% 4.53% 1.80% 13.80% 11.66% 9.46% 9.83% 12.97%<br />
Lower Quartile 2.09% 5.24% 2.09% 15.86% 15.44% 11.88% 12.58% 18.60%<br />
Low 1.04% 4.02% 1.04% 4.93% 9.54% 11.00% 10.73% 16.70%<br />
Range 2.35% 4.10% 2.35% 22.40% 11.46% 5.16% 5.03% 4.16%<br />
Number of participants 14 14 14 14 12 12 12 10<br />
SA Conservative<br />
High 1.71% 5.66% 1.71% 19.19% 16.84% 13.54% 13.47% 16.72%<br />
Upper Quartile 1.71% 5.43% 1.71% 17.93% 15.89% 13.29% 13.20% 16.72%<br />
Median 1.71% 5.21% 1.71% 16.66% 14.94% 13.04% 12.94% 16.72%<br />
Average 1.71% 5.21% 1.71% 16.66% 14.94% 13.04% 12.94% 16.72%<br />
Asset-weighted Average 1.10% 3.21% 1.10% 9.98% 9.05% 8.22% 8.15% 16.72%<br />
Lower Quartile 1.70% 4.98% 1.70% 15.40% 14.00% 12.79% 12.68% 16.72%<br />
Low 1.70% 4.75% 1.70% 14.14% 13.05% 12.54% 12.42% 16.72%<br />
Range 0.02% 0.90% 0.02% 5.05% 3.79% 1.00% 1.05% 0.00%<br />
Number of participants 2 2 2 2 2 2 2 1<br />
SA LMW<br />
High 3.39% 8.12% 3.39% 27.33% 21.00% 16.15% 15.75% 20.86%<br />
Upper Quartile 2.72% 7.54% 2.72% 22.59% 18.46% 14.86% 15.25% 20.66%<br />
Median 2.54% 6.76% 2.54% 19.11% 16.56% 13.20% 14.03% 19.44%<br />
Average 2.33% 6.39% 2.33% 19.05% 16.50% 12.67% 13.68% 19.13%<br />
Asset-weighted Average 1.57% 3.99% 1.57% 12.18% 10.06% 8.13% 8.49% 11.41%<br />
Lower Quartile 1.60% 5.67% 1.60% 17.06% 15.73% 11.86% 12.58% 18.75%<br />
Low 1.04% 4.02% 1.04% 4.93% 9.54% 11.00% 10.73% 18.04%<br />
Range 2.35% 4.10% 2.35% 22.40% 11.46% 5.16% 5.03% 2.82%<br />
Number of participants 9 9 9 9 8 8 8 7<br />
** Median Compounded : The longer term median returns reflected are calculated by compounding the monthly median returns over the various periods.<br />
* Reasonable use of the survey may be made for purposes of comment and study provided that full acknowledgement is made to "<strong>Alexander</strong> <strong>Forbes</strong> Research & Product Development".<br />
** Please see final page for Disclaimers and Glossary **
S.A. LARGE MANAGER WATCH TM<br />
Objective - The portfolios are balanced (i.e. multiple asset class) portfolios, subject to the restrictions imposed by Regulation 28 of the Pension Funds Act and are confined to investing in South Africa only.These statistics represent the various categories that portfolios are represented in, regardless of whether these asset <strong>manager</strong>s are open to new investments<br />
or not.<br />
LOCAL NON INVESTABLE PERFORMANCE DATA ANALYSIS TO THE END OF JANUARY 2013<br />
Return - Month Return - Quarter Return - Year to Date Return - 1 Year Return - 3 Years (p.a.) Return - 5 Years (p.a.) Return - 7 Years (p.a.) Return - 10 Years (p.a.)<br />
SA BIV<br />
Median 2.59% 6.46% 2.59% 18.90% 16.45% 13.23% 13.81% 18.82%<br />
Average 2.44% 6.18% 2.44% 18.17% 16.15% 12.81% 13.58% 18.74%<br />
Asset-weighted Average 2.84% 6.41% 2.84% 18.98% 16.79% 14.05% 14.92% 20.36%<br />
Number of participants 15 15 15 15 13 13 13 11<br />
SA Conservative<br />
Median 1.70% 4.75% 1.70% 14.14% 13.05% 12.54% 12.42% 16.72%<br />
Average 1.55% 4.11% 1.55% 13.58% 12.90% 12.13% 12.51% 16.72%<br />
Asset-weighted Average 1.54% 3.90% 1.54% 12.65% 12.22% 11.92% 12.33% 16.72%<br />
Number of participants 3 3 3 3 3 3 3 1<br />
SA LMW<br />
Median 2.62% 6.74% 2.62% 18.92% 16.60% 13.22% 14.05% 19.45%<br />
Average 2.41% 6.31% 2.41% 18.70% 16.46% 12.65% 13.66% 19.13%<br />
Asset-weighted Average 2.86% 6.33% 2.86% 18.63% 16.63% 14.00% 15.01% 20.59%<br />
Number of participants 10 10 10 10 9 9 9 8<br />
** Median Compounded : The longer term median returns reflected are calculated by compounding the monthly median returns over the various periods.<br />
* Reasonable use of the survey may be made for purposes of comment and study provided that full acknowledgement is made to "<strong>Alexander</strong> <strong>Forbes</strong> Research & Product Development".<br />
** Please see final page for Disclaimers and Glossary **
GLOBAL MANAGER WATCH TM - DYNAMIC<br />
Objective - The portfolios are balanced (i.e. multiple asset class) portfolios, subject to the restrictions imposed by Regulation 28 of the Pension Funds Act and aim to maximize long-term (i.e. more than 5 years) capital growth. This may lead to volatility of returns in the short-term (i.e. less than one year).<br />
GENERAL INFORMATION<br />
GIPS<br />
(Verified/<br />
Compliant)<br />
Portfolio Type<br />
Notes<br />
Regulation 28<br />
Compliant<br />
Certification<br />
(Y/N)<br />
Benchmark Description<br />
Admin - efficiency :<br />
No.of funds<br />
Date data submitted<br />
in composite<br />
Portfolio Size<br />
(R m)<br />
Allan Gray Life Global Absolute Portfolio V Pooled Non-Investable Global LMW Average 07 February 2013 n/a 3 287<br />
Coronation (Managed) V Pooled Global LMW Average 12 February 2013 n/a 10 713<br />
Investec Asset Management Managed V Pooled Global LMW Median 13 February 2013 n/a 5 870<br />
Investec Opportunity Composite V Pooled CPI + 6% 13 February 2013 n/a 42 637<br />
Investment Solutions Entrepreneur<br />
Pooled multi-<strong>manager</strong><br />
INVESTMENT MANAGERS<br />
56.3% SWIX, 15% ALBI, 3.8% SAPY, 16.3% MSCI World Index, 3.8% LBGAI, 2.5% 90-day US Treasury Bill, 2.5% 90-<br />
day US Treasury Bill + 2% 14 February 2013 n/a 1 100<br />
This fund holds no specific benchmark. The asset allocation is aggressively managed seeking to maximise shortterm<br />
OMIGSA MacroSolutions (Profile Pinnacle) V Pooled<br />
opportunities by actively switching between asset classes and asset sectors. 14 February 2013 n/a 1 779<br />
SYmmETRY Aggressive V Pooled multi-<strong>manager</strong> 57% SWIX , 10.5% ALBI, 7.5% SteFI, 18% MSCI World Index, 7% Barclays Global Bond Aggregate 14 February 2013 n/a 1 777<br />
This includes multi-<strong>manager</strong>s thus must<br />
be noted as possible "double-counting" TOTAL 67 163<br />
* Reasonable use of the survey may be made for purposes of comment and study provided that full acknowledgement is made to "<strong>Alexander</strong> <strong>Forbes</strong> Research & Product Development".<br />
* While all possible care is taken in the compilation of the Survey, reliance is placed on information received from Investment Managers.<br />
* The rankings and statistical information have been supplied for illustrative purposes only.<br />
* Performance figures are shown gross of fees.<br />
* Performance should not be judged over a short period of time.<br />
* Past performance is not necessarily a guide to future performance.
GLOBAL MANAGER WATCH TM - DYNAMIC<br />
Objective - The portfolios are balanced (i.e. multiple asset class) portfolios with exposure to both <strong>global</strong> and local assets, subject to the restrictions imposed by Regulation 28 of the Pension Funds Act and aim to maximize long-term (i.e. more than 5 years) capital returns. This may lead to volatility of returns in the short-term (i.e. less than one year).<br />
INVESTMENT DATA TO THE END OF JANUARY 2013<br />
PERFORMANCE DATA<br />
Month Quarter Year to Date 1 Year<br />
3 Years (p.a.) 5 Years (p.a.) 7 Years (p.a.) 10 Years (p.a.)<br />
Portfolio Rank Benchmark Portfolio Rank Benchmark Portfolio Rank Benchmark Portfolio Rank Benchmark Portfolio Rank Benchmark Portfolio Rank Benchmark Portfolio Rank Benchmark Portfolio Rank Benchmark<br />
INVESTMENT MANAGERS<br />
Allan Gray Life Global Absolute Portfolio 4.13% 4 4.40% 3.84% 7 7.52% 4.13% 4 4.40% 10.58% 7 21.68% 10.47% 7 16.32% 12.17% 3 11.62% 14.63% 2 13.01% * *<br />
Coronation (Managed) 5.30% 1 4.32% 9.08% 1 7.58% 5.30% 1 4.32% 26.32% 1 21.95% 19.61% 1 16.35% 15.67% 1 11.63% 16.09% 1 13.01% 19.67% 1 17.58%<br />
Investec Asset Management Managed 3.64% 7 4.31% 5.84% 6 7.90% 3.64% 7 4.31% 22.39% 3 22.36% 15.92% 5 16.23% 10.08% 7 11.67% 12.23% 6 12.99% 18.76% 3 17.56%<br />
Investec Opportunity Composite 3.97% 6 0.72% 7.47% 4 2.59% 3.97% 6 4.20% 23.80% 2 11.67% 16.97% 2 11.08% 14.16% 2 12.20% 14.47% 3 12.53% 18.96% 2 11.28%<br />
Investment Solutions Entrepreneur 3.99% 5 2.92% 7.20% 5 7.14% 3.99% 5 2.92% 19.50% 6 24.01% 16.10% 4 17.91% 12.12% 4 11.98% 12.66% 4 13.15% 17.44% 5 17.05%<br />
OMIGSA MacroSolutions (Profile Pinnacle) 4.25% 3 * 7.76% 3 * 4.25% 3 * 21.06% 4 * 15.66% 6 * 11.63% 5 * 12.49% 5 * 18.01% 4 *<br />
SYmmETRY Aggressive 5.07% 2 3.02% 7.88% 2 7.40% 5.07% 2 3.02% 19.83% 5 22.71% 16.12% 3 17.10% 11.00% 6 11.41% 12.10% 7 12.68% 17.00% 6 16.93%<br />
* Reasonable use of the survey may be made for purposes of comment and study provided that full acknowledgement is made to "<strong>Alexander</strong> <strong>Forbes</strong> Research & Product Development".<br />
* While all possible care is taken in the compilation of the Survey, reliance is placed on information received from Investment Managers.<br />
* The rankings and statistical information have been supplied for illustrative purposes only.<br />
* Reasonable use of the survey may be made for purposes of comment and study provided that full acknowledgement is made to "<strong>Alexander</strong> <strong>Forbes</strong> Research & Product Development.<br />
* Performance should not be judged over a short period of time.<br />
* Past history is not necessarily a guide to future performance.
GLOBAL MANAGER WATCH TM - DYNAMIC<br />
Objective - The portfolios are balanced (i.e. multiple asset class) portfolios with exposure to both <strong>global</strong> and local assets, subject to the restrictions imposed by Regulation 28 of the Pension Funds Act and aim to maximize long-term (i.e. more than 5 years) capital returns. This may<br />
lead to volatility of returns in the short-term (i.e. less than one year).<br />
INVESTMENT DATA TO THE END OF JANUARY 2013<br />
RISK VS RETURN<br />
Calculated on 3 year performance returns<br />
Calculated on 5 year performance returns<br />
3 Year Return<br />
(p.a.)<br />
Rank Volatility Rank<br />
Active<br />
Return<br />
Tracking<br />
Error<br />
Sharpe Ratio<br />
5 Year Return<br />
(p.a.)<br />
Rank Volatility Rank<br />
Active<br />
Return<br />
Tracking<br />
Error<br />
Sharpe Ratio<br />
Allan Gray Life Global Absolute Portfolio 10.47% 7 4.06% 1 -5.85% 7.61% 1.10 12.17% 3 7.56% 1 0.55% 8.65% 0.59<br />
Coronation (Managed) 19.61% 1 7.72% 6 3.26% 1.40% 1.76 15.67% 1 10.40% 4 4.04% 1.88% 0.77<br />
Investec Asset Management Managed 15.92% 5 7.40% 5 -0.31% 3.71% 1.34 10.08% 7 11.05% 6 -1.59% 5.45% 0.22<br />
Investec Opportunity Fund 16.97% 2 5.19% 2 5.89% 5.29% 2.11 14.16% 2 8.74% 2 1.96% 8.67% 0.74<br />
Investment Solutions Entrepreneur 16.10% 4 6.99% 4 -1.81% 2.04% 1.44 12.12% 4 10.64% 5 0.14% 2.56% 0.42<br />
OMIGSA MacroSolutions (Profile Pinnacle) 15.66% 6 8.14% 7 * * 1.19 11.63% 5 11.36% 7 * * 0.35<br />
SYmmETRY Aggressive 16.12% 3 6.94% 3 -0.99% 3.10% 1.46 11.00% 6 9.98% 3 -0.40% 3.57% 0.33<br />
Lower volatility =<br />
higher ranking<br />
STATISTICS<br />
Range 9.14% 5.59%<br />
Highest 19.61% 8.14% 5.89% 7.61% 2.11 15.67% 11.36% 4.04% 8.67% 0.77<br />
Upper Quartile 16.54% 7.56% 2.37% 4.90% 1.61 13.16% 10.85% 1.61% 7.85% 0.67<br />
Median 16.87% 6.99% -0.65% 3.41% 1.44 12.45% 10.40% 0.35% 4.51% 0.42<br />
Average 15.89% 6.63% 0.03% 3.86% 1.49 12.13% 9.96% 0.78% 5.13% 0.49<br />
Lower Quartile 15.79% 6.07% -1.60% 2.30% 1.26 11.31% 9.36% -0.27% 2.81% 0.34<br />
Lowest 10.47% 4.06% -5.85% 1.40% 1.10 10.08% 7.56% -1.59% 1.88% 0.22<br />
Number of participants 7 7 6 6 7 7 7 6 6 7<br />
* Reasonable use of the survey may be made for purposes of comment and study provided that full acknowledgement is made to "<strong>Alexander</strong> <strong>Forbes</strong> Research & Product Development.<br />
* While all possible care is taken in the compilation of the Survey, reliance is placed on information received from Investment Managers.<br />
* The rankings and statistical information have been supplied for illustrative purposes only.<br />
* Performance figures are shown gross of fees.<br />
* Quantitative figures are calculated on 3 year performance returns.<br />
* Performance should not be judged over a short period of time.<br />
* Past history is not necessarily a guide to future performance.<br />
Lower volatility = higher<br />
ranking
Return (p.a.)<br />
GLOBAL MANAGER WATCH TM DYNAMIC<br />
19.40%<br />
Volatility vs Return Scatterplot - Global Dynamic<br />
3 Years ended 31 January 2013<br />
Coronation (Managed)<br />
18.40%<br />
17.40%<br />
16.40%<br />
15.40%<br />
Investec Opportunity Fund<br />
SYmmETRY Aggressive<br />
Investment Solutions Entrepreneur<br />
Investec Asset Management Managed<br />
OMIGSA MacroSolutions (Profile Pinnacle)<br />
14.40%<br />
13.40%<br />
12.40%<br />
11.40%<br />
Allan Gray Life Global Absolute Portfolio<br />
10.40%<br />
4.00% 5.00% 6.00% 7.00% 8.00%<br />
Volatility (p.a.) (standard deviation)<br />
* Reasonable use of the survey may be made for purposes of comment and study provided that full acknowledgement is made to "<strong>Alexander</strong> <strong>Forbes</strong> Research & Product Development".<br />
** Please see final page for Disclaimers and Glossary **
GLOBAL MANAGER WATCH TM - BEST INVESTMENT VIEW<br />
Objective - The portfolios are balanced (i.e. multiple asset class) portfolios, subject to the restrictions imposed by Regulation 28 of the Pension Funds Act and represent the <strong>manager</strong>s' best investment view.<br />
GENERAL INFORMATION<br />
GIPS<br />
(Verified/<br />
Compliant)<br />
Portfolio Type<br />
Notes<br />
Regulation 28<br />
Compliant<br />
Certification<br />
(Y/N)<br />
Benchmark Description<br />
Admin - efficiency :<br />
No.of funds<br />
Date data submitted<br />
in composite<br />
Portfolio Size<br />
(R m)<br />
INVESTMENT MANAGERS<br />
Absa Asset Management Global Balanced V Pooled AF Large Manager Watch Median 14 February 2013 n/a 521<br />
Allan Gray V Segregated Non-Investable Global LMW Average 07 February 2013 19 41 791<br />
Cadiz Global Balanced V Segregated Global LMW Median 14 February 2013 3 661<br />
Coronation V Segregated Global LMW Median 12 February 2013 13 25 798<br />
Foord Asset Management C Segregated 55% ALSI, 9% MSCI, 6% CITI, 5% PROP, 20% ALBI, 5% STFCAD 14 February 2013 12 30 140<br />
Investec Asset Management V Segregated Global LMW Median 13 February 2013 21 30 876<br />
75% SA LMW Median, 16.3% MSCI World Index, 3.8% LBGAI, 2.5% 90-day US Treasury Bill, 2.5% 90-day US<br />
Investment Solutions (Performer)<br />
Pooled multi-<strong>manager</strong><br />
Treasury Bill + 2% 14 February 2013 n/a 37 412<br />
Investment Solutions (Spectrum)<br />
Pooled multi-<strong>manager</strong><br />
75% SA LMW Average, 16.3% MSCI World Index, 3.8% LBGAI, 2.5% 90-day US Treasury Bill, 2.5% 90-day US<br />
Treasury Bill + 2% 14 February 2013 n/a 2 519<br />
Momentum Balanced Pooled Global LMW Median 14 February 2013 n/a 801<br />
Nedgroup Investments XS Diversified Fund of Funds Pooled CPI + 5% 13 February 2013 n/a 1 410<br />
Oasis V Segregated Global BIV Average 13 February 2013 7 1 469<br />
OMIGSA MacroSolutions V Segregated<br />
The benchmark for our full discretionary funds is calculated in-house, using FTSE free market indices and estimated<br />
peer group weightings. 14 February 2013 6 4 299<br />
OMIGSA MacroSolutions (Profile Balanced) V Pooled 45% FTSE/JSE Shareholder Wghted Index + 20% MSCI ACWI Free Index (R) + 15% BEASSA Index + 7.5%Stefi 3 Months + 145% February 50/50 JPM 2013Intl Bond n/a Index/Barclay Cap Global 1 335 Bnd Agg Index (R) + 5%<br />
Prescient Global Balanced Segregated Inflation 11 February 2013 n/a 1 355<br />
Prudential Global Balanced V Segregated The total fund is benchmarked against the total MEDIAN performance of the Global LMW participants. 06 February 2013 6 10 360<br />
PSG Balanced Fund<br />
The "Performance Target" is CPI + 5%. The Benchmark is 60% JSE ALSI, 10% All Bond Index, 10% STEFI Cash, 12% MSCI 13 World February Index, 2013 4% USD n/a Month Deposit Rate, 14% 665JPM GBI (all in ZAR)<br />
Momentum AM Global Balanced Fund V Segregated Global LMW Median 13 February 2013 5 1 507<br />
RE:CM V Pooled CPIX + 8% p.a (ECPIX on INET) 14 February 2013 6 10 422<br />
SIM Global Unique V Segregated Global LMW Median 12 February 2013 4 5 377<br />
Stanlib AM V Segregated <strong>Forbes</strong> MW - Global Best Invest 14 February 2013 9 5 838<br />
SYmmETRY Managed V Pooled Median of <strong>Alexander</strong> <strong>Forbes</strong> Global Large Manager Watch 14 February 2013 n/a 652<br />
This includes multi-<strong>manager</strong>s thus must<br />
be noted as possible "double-counting" TOTAL 215 409<br />
* Reasonable use of the survey may be made for purposes of comment and study provided that full acknowledgement is made to "<strong>Alexander</strong> <strong>Forbes</strong> Research & Product Development".<br />
* While all possible care is taken in the compilation of the Survey, reliance is placed on information received from Investment Managers.<br />
* The rankings and statistical information have been supplied for illustrative purposes only.<br />
* Performance figures are shown gross of fees.<br />
* Performance should not be judged over a short period of time.<br />
* Past performance is not necessarily a guide to future performance.
GLOBAL MANAGER WATCH TM - BEST INVESTMENT VIEW<br />
Objective - The portfolios are balanced (i.e. multiple asset class) portfolios with exposure to <strong>global</strong> and local assets, subject to the restrictions imposed by Regulation 28 of the Pension Funds Act and represent the <strong>manager</strong>s' best investment view.<br />
INVESTMENT DATA TO THE END OF JANUARY 2013<br />
PERFORMANCE DATA<br />
Month Quarter Year to Date 1 Year 3 Years (p.a.) 5 Years (p.a.) 7 Years (p.a.) 10 Years (p.a.)<br />
Portfolio Rank Benchmark Portfolio Rank Benchmark Portfolio Rank Benchmark Portfolio Rank Benchmark Portfolio Rank Benchmark Portfolio Rank Benchmark Portfolio Rank Benchmark Portfolio Rank Benchmark<br />
INVESTMENT MANAGERS<br />
Absa Asset Management Global Balanced 2.73% 21 4.31% 5.74% 20 7.90% 2.73% 21 4.31% 19.22% 17 22.36% * * * * * * * *<br />
Allan Gray 5.19% 3 4.40% 6.92% 15 7.52% 5.19% 3 4.40% 19.00% 18 21.68% 15.01% 13 16.32% 12.71% 6 11.62% 14.38% 4 13.01% 18.91% 4 17.57%<br />
Cadiz Global Balanced 3.25% 17 4.31% 7.79% 7 7.90% 3.25% 17 4.31% 21.06% 10 22.36% 15.38% 12 16.23% 10.89% 12 11.67% 11.98% 15 12.99% 17.08% 9 17.56%<br />
Coronation 5.57% 1 4.31% 8.86% 1 7.90% 5.57% 1 4.31% 25.09% 2 22.36% 18.14% 3 16.23% 14.58% 2 11.67% 14.97% 3 12.99% 19.18% 3 17.56%<br />
Foord Asset Management 3.73% 15 3.09% 7.01% 14 7.40% 3.73% 15 3.09% 25.74% 1 21.63% 19.45% 1 16.51% 14.70% 1 10.84% 15.02% 2 12.43% 19.83% 1 15.78%<br />
Investec Asset Management 5.13% 4 2.09% 7.95% 4 6.39% 5.13% 4 2.09% 23.36% 7 20.86% 16.14% 8 16.01% 12.95% 5 11.28% 15.27% 1 12.37% 19.27% 2 16.01%<br />
Investment Solutions (Performer) 4.73% 6 4.40% 7.67% 10 7.82% 4.73% 6 4.40% 22.83% 8 21.96% 17.45% 5 16.70% 13.11% 3 12.53% 14.00% 5 13.75% 18.27% 6 17.88%<br />
Investment Solutions (Spectrum) 4.35% 10 4.41% 7.72% 9 7.57% 4.35% 10 4.41% 21.99% 9 21.84% 16.68% 6 16.73% 11.97% 8 12.13% 13.31% 8 13.48% 17.73% 7 17.65%<br />
Momentum Balanced 2.98% 19 3.23% 6.73% 17 7.06% 2.98% 19 3.23% 19.72% 15 23.12% 14.54% 14 17.10% 10.51% 13 12.06% 12.13% 12 13.20% 16.40% 15 12.06%<br />
Nedgroup Investments XS Diversified Fund of Funds 3.97% 14 0.64% 7.19% 12 2.35% 3.97% 14 0.64% 19.38% 16 10.93% * * * * * * * *<br />
Oasis 4.52% 7 4.08% 8.56% 2 7.28% 4.52% 7 4.08% 24.07% 5 21.13% 15.71% 11 16.04% 9.99% 16 11.70% 12.24% 11 13.34% 16.63% 12 17.80%<br />
OMIGSA MacroSolutions 4.30% 12 2.84% 7.76% 8 6.30% 4.30% 12 2.84% 20.85% 12 20.78% 15.79% 9 16.24% 11.34% 9 11.70% 12.62% 9 13.07% 17.67% 8 17.41%<br />
OMIGSA MacroSolutions (Profile Balanced) 4.43% 8 3.12% 7.85% 6 7.00% 4.43% 8 3.12% 21.05% 11 22.63% 15.75% 10 17.42% 10.94% 11 12.47% 11.72% 17 13.30% 16.50% 13 17.27%<br />
Prescient Global Balanced 2.95% 20 0.24% 4.88% 21 1.12% 2.95% 20 0.24% 13.75% 20 6.51% * * * * * * * *<br />
Prudential Global Balanced 4.33% 11 4.31% 8.05% 3 7.71% 4.33% 11 4.31% 23.45% 6 21.73% 17.92% 4 16.20% 13.00% 4 11.87% 13.97% 6 13.25% 18.53% 5 17.53%<br />
PSG Balanced Fund 4.74% 5 3.61% 6.30% 18 7.38% 4.74% 5 3.61% 18.97% 19 20.31% * * * * * * * *<br />
Momentum AM Global Balanced Fund 3.02% 18 3.23% 6.74% 16 7.06% 3.02% 18 3.23% 19.81% 14 22.69% 14.13% 15 16.62% 10.04% 15 11.79% 11.73% 16 13.00% 16.80% 10 16.30%<br />
RE:CM 5.31% 2 0.88% 6.02% 19 3.07% 5.31% 2 0.88% 11.99% 21 14.08% 12.87% 16 13.45% 12.34% 7 14.77% 12.31% 10 14.87% * *<br />
SIM Global Unique 4.07% 13 4.31% 7.18% 13 7.90% 4.07% 13 4.31% 20.81% 13 22.36% 16.22% 7 16.23% 11.17% 10 11.67% 12.01% 14 12.99% 16.76% 11 17.56%<br />
Stanlib AM 3.25% 16 4.31% 7.61% 11 7.71% 3.25% 16 4.31% 24.54% 3 21.73% 18.94% 2 16.20% 10.33% 14 11.87% 12.02% 13 13.25% 16.46% 14 17.53%<br />
SYmmETRY Managed 4.38% 9 4.33% 7.93% 5 7.85% 4.38% 9 4.33% 24.08% 4 21.70% * * * * * * * *<br />
* Reasonable use of the survey may be made for purposes of comment and study provided that full acknowledgement is made to "<strong>Alexander</strong> <strong>Forbes</strong> Research & Product Development".<br />
* While all possible care is taken in the compilation of the Survey, reliance is placed on information received from Investment Managers.<br />
* The rankings and statistical information have been supplied for illustrative purposes only.<br />
* Reasonable use of the survey may be made for purposes of comment and study provided that full acknowledgement is made to "<strong>Alexander</strong> <strong>Forbes</strong> Research & Product Development.<br />
* Performance should not be judged over a short period of time.<br />
* Past history is not necessarily a guide to future performance.
Return (p.a.)<br />
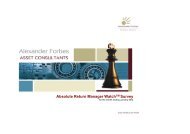
GLOBAL MANAGER WATCH TM BEST<br />
INVESTMENT VIEW<br />
Volatility vs Return Scatterplot - Global BIV<br />
3 Years ended 31 January 2013<br />
Foord Asset Management<br />
18.80%<br />
Stanlib AM<br />
Coronation<br />
17.80%<br />
Prudential Global Balanced<br />
Investment Solutions (Performer)<br />
16.80%<br />
15.80%<br />
Investment Solutions (Spectrum)<br />
SIM Global Unique<br />
Investec Asset Management<br />
OMIGSA MacroSolutions (Profile Balanced) OMIGSA MacroSolutions<br />
Oasis<br />
Cadiz Global Balanced<br />
14.80%<br />
Allan Gray<br />
Momentum Balanced<br />
13.80%<br />
Momentum AM Global Balanced Fund<br />
RE:CM<br />
12.80%<br />
4.65% 5.15% 5.65% 6.15% 6.65% 7.15% 7.65% 8.15%<br />
Volatility (p.a.) (standard deviation)<br />
* Reasonable use of the survey may be made for purposes of comment and study provided that full<br />
acknowledgement is made to "<strong>Alexander</strong> <strong>Forbes</strong> Research & Product Development".<br />
** Please see final page for Disclaimers and Glossary **
GLOBAL MANAGER WATCH TM - BEST INVESTMENT VIEW<br />
Objective - The portfolios are balanced (i.e. multiple asset class) portfolios with exposure to <strong>global</strong> and local assets, subject to the restrictions imposed by Regulation 28 of the Pension Funds Act and represent the <strong>manager</strong>s' best investment view.<br />
INVESTMENT DATA TO THE END OF JANUARY 2013<br />
RISK VS RETURN<br />
Calculated on 3 year performance returns<br />
Calculated on 5 year performance returns<br />
3 Year Return<br />
(p.a.)<br />
Rank Volatility Rank<br />
Active<br />
Return<br />
Tracking<br />
Error<br />
Sharpe Ratio<br />
5 Year Return<br />
(p.a.)<br />
Rank Volatility Rank<br />
Active<br />
Return<br />
Tracking<br />
Error<br />
Sharpe Ratio<br />
Allan Gray 15.01% 13 4.70% 1 -1.31% 3.94% 1.92 12.71% 6 8.05% 2 1.09% 5.19% 0.62<br />
Cadiz Global Balanced 15.38% 12 7.63% 13 -0.85% 2.67% 1.23 10.89% 12 10.72% 12 -0.78% 2.46% 0.30<br />
Coronation 18.14% 3 6.99% 7 1.91% 1.52% 1.74 14.58% 2 9.97% 5 2.91% 1.76% 0.69<br />
Foord Asset Management 19.45% 1 7.59% 11 2.94% 2.35% 1.77 14.70% 1 10.16% 6 3.86% 3.66% 0.69<br />
Investec Asset Management 16.14% 8 6.97% 6 0.14% 3.55% 1.46 12.95% 5 11.03% 15 1.67% 4.29% 0.48<br />
Investment Solutions (Performer) 17.45% 5 6.47% 3 0.75% 1.26% 1.77 13.11% 3 9.57% 4 0.58% 1.48% 0.57<br />
Investment Solutions (Spectrum) 16.68% 6 6.73% 5 -0.05% 0.95% 1.59 11.97% 8 10.18% 7 -0.17% 0.84% 0.42<br />
Momentum Balanced 14.54% 14 7.65% 14 -2.56% 1.30% 1.12 10.51% 13 10.69% 11 -1.55% 2.29% 0.26<br />
Oasis 15.71% 11 6.71% 4 -0.33% 1.77% 1.45 9.99% 16 9.50% 3 -1.71% 2.36% 0.24<br />
OMIGSA MacroSolutions 15.79% 9 7.62% 12 -0.45% 1.69% 1.28 11.34% 9 10.72% 13 -0.36% 1.75% 0.34<br />
OMIGSA MacroSolutions (Profile Balanced) 15.75% 10 7.30% 9 -1.67% 2.04% 1.33 10.94% 11 10.52% 10 -1.53% 2.27% 0.31<br />
Prudential Global Balanced 17.92% 4 8.13% 16 1.72% 1.65% 1.47 13.00% 4 11.00% 14 1.13% 1.70% 0.48<br />
Momentum AM Global Balanced Fund 14.13% 15 7.27% 8 -2.50% 1.07% 1.12 10.04% 15 10.38% 8 -1.74% 2.15% 0.23<br />
RE:CM 12.87% 16 5.14% 2 -0.58% 5.42% 1.34 12.34% 7 8.04% 1 -2.43% 8.18% 0.58<br />
SIM Global Unique 16.22% 7 7.54% 10 -0.01% 1.22% 1.36 11.17% 10 10.52% 9 -0.50% 1.87% 0.33<br />
Stanlib AM 18.94% 2 8.07% 15 2.74% 2.51% 1.60 10.33% 14 12.02% 16 -1.53% 3.79% 0.22<br />
Lower volatility =<br />
higher ranking<br />
STATISTICS<br />
Range 6.58% 4.71%<br />
Highest 19.45% 8.13% 2.94% 5.42% 1.92 14.70% 12.02% 3.86% 8.18% 0.69<br />
Upper Quartile 17.56% 7.62% 0.99% 2.55% 1.64 12.96% 10.72% 1.10% 3.69% 0.57<br />
Median 16.60% 7.28% -0.19% 1.73% 1.45 13.22% 10.45% -0.43% 2.28% 0.38<br />
Average 16.46% 7.03% -0.01% 2.18% 1.47 12.65% 10.19% -0.07% 2.88% 0.42<br />
Lower Quartile 15.29% 6.73% -0.96% 1.29% 1.32 10.79% 9.87% -1.54% 1.75% 0.29<br />
Lowest 12.87% 4.70% -2.56% 0.95% 1.12 9.99% 8.04% -2.43% 0.84% 0.22<br />
Number of participants 16 16 16 16 16 16 16 16<br />
* Reasonable use of the survey may be made for purposes of comment and study provided that full acknowledgement is made to "<strong>Alexander</strong> <strong>Forbes</strong> Research & Product Development.<br />
* While all possible care is taken in the compilation of the Survey, reliance is placed on information received from Investment Managers.<br />
* The rankings and statistical information have been supplied for illustrative purposes only.<br />
* Performance figures are shown gross of fees.<br />
* Quantitative figures are calculated on 3 year performance returns.<br />
* Performance should not be judged over a short period of time.<br />
* Past history is not necessarily a guide to future performance.<br />
Lower volatility = higher<br />
ranking
GLOBAL MANAGER WATCH TM - BEST INVESTMENT VIEW<br />
Objective - The portfolios are balanced (i.e. multiple asset class) portfolios with exposure to both <strong>global</strong> and local assets, subject to the restrictions imposed by Regulation 28 of the Pension Funds Act and aim to minimise the probability of short-term (i.e. less than one year) capital loss while targeting long-term (i.e.more than five years) capital return..<br />
GENERAL INFORMATION<br />
GIPS<br />
(Verified/<br />
Compliant)<br />
Portfolio Type<br />
Notes<br />
Regulation 28<br />
Compliant<br />
Certification<br />
(Y/N)<br />
Benchmark Description<br />
Admin - efficiency :<br />
No.of funds<br />
Date data submitted<br />
in composite<br />
Portfolio Size<br />
(R m)<br />
INVESTMENT MANAGERS<br />
Allan Gray Life Global Stable Portfolio V Pooled Non-Investable <strong>Alexander</strong> <strong>Forbes</strong> 3 month Deposit Index plus 2% 07 February 2013 n/a 3 763<br />
Investec Cautious Managed Fund V Pooled Peer 30% SWIX, Median22.5% ALBI, 22.5% SteFI Call Deposit Index, 11.3% MSCI World Index, 5% LBGAI, 3.1% 90-day US 13 February 2013 n/a 4 687<br />
Investment Solutions (Conserver)<br />
Pooled multi-<strong>manager</strong><br />
Treasury The Profile Bill, Capital 1.9% Portfolio One-month is continually French Treasury evaluated Bill, against 3.8% 90-Day its' performance US Treasury benchmarks, Bill + 2% seeking to outperform the 14 February 2013 n/a 1 995<br />
OMIGSA MacroSolutions (Profile Capital) V Pooled<br />
returns which would be generated by adopting a passive strategy, that is, by simply holding the stated asset class and 14 February 2013 n/a 334<br />
SYmmETRY Absolute Balanced Fund Pooled multi-<strong>manager</strong> CPI + 7% 14 February 2013 n/a 2 965<br />
This includes multi-<strong>manager</strong>s thus must<br />
be noted as possible "double-counting" TOTAL 10 779<br />
* Reasonable use of the survey may be made for purposes of comment and study provided that full acknowledgement is made to "<strong>Alexander</strong> <strong>Forbes</strong> Research & Product Development".<br />
* While all possible care is taken in the compilation of the Survey, reliance is placed on information received from Investment Managers.<br />
* The rankings and statistical information have been supplied for illustrative purposes only.<br />
* Performance figures are shown gross of fees.<br />
* Performance should not be judged over a short period of time.<br />
* Past performance is not necessarily a guide to future performance.
GLOBAL MANAGER WATCH TM - CONSERVATIVE<br />
Objective - The portfolios are balanced (i.e. multiple asset class) portfolios with exposure to both <strong>global</strong> and local assets, subject to the restrictions imposed by Regulation 28 of the Pension Funds Act and aim to minimise the probability of short-term (i.e. less than one year) capital loss while targeting long-term (i.e.more than five years) capital<br />
return..<br />
INVESTMENT DATA TO THE END OF JANUARY 2013<br />
PERFORMANCE DATA<br />
Month Quarter Year to Date 1 Year 3 Years (p.a.) 5 Years (p.a.) 7 Years (p.a.) 10 Years (p.a.)<br />
Portfolio Rank Benchmark Portfolio Rank Benchmark Portfolio Rank Benchmark Portfolio Rank Benchmark Portfolio Rank Benchmark Portfolio Rank Benchmark Portfolio Rank Benchmark Portfolio Rank Benchmark<br />
INVESTMENT MANAGERS<br />
Allan Gray Life Global Stable Portfolio 3.49% 2 * 3.61% 5 * 3.49% 2 * 12.14% 5 * 9.80% 5 * 10.22% 5 * 11.51% 2 * * *<br />
Investec Cautious Managed Fund 3.21% 3 1.74% 5.00% 4 4.49% 3.21% 3 1.74% 16.16% 3 15.47% 11.53% 4 12.55% 11.09% 4 10.04% * * * *<br />
Investment Solutions (Conserver) 2.91% 4 2.01% 5.07% 3 4.73% 2.91% 4 2.01% 15.47% 4 16.24% 12.95% 3 13.11% 11.45% 2 10.23% 11.95% 1 10.98% 14.49% 1 12.88%<br />
OMIGSA MacroSolutions (Profile Capital) 2.45% 5 1.63% 5.38% 2 3.47% 2.45% 5 1.63% 17.98% 2 14.28% 13.33% 2 12.53% 11.41% 3 10.62% 10.96% 3 10.68% 12.39% 2 11.95%<br />
SYmmETRY Absolute Balanced Fund 3.89% 1 0.80% 6.87% 1 2.81% 3.89% 1 0.80% 19.70% 1 13.21% 15.91% 1 12.19% 12.39% 1 * * * * *<br />
* Reasonable use of the survey may be made for purposes of comment and study provided that full acknowledgement is made to "<strong>Alexander</strong> <strong>Forbes</strong> Research & Product Development".<br />
* While all possible care is taken in the compilation of the Survey, reliance is placed on information received from Investment Managers.<br />
* The rankings and statistical information have been supplied for illustrative purposes only.<br />
* Reasonable use of the survey may be made for purposes of comment and study provided that full acknowledgement is made to "<strong>Alexander</strong> <strong>Forbes</strong> Research & Product Development.<br />
* Performance should not be judged over a short period of time.<br />
* Past history is not necessarily a guide to future performance.
GLOBAL MANAGER WATCH TM - CONSERVATIVE<br />
Objective - The portfolios are balanced (i.e. multiple asset class) portfolios, subject to the restrictions imposed by Regulation 28 of the Pension Funds Act and aim to minimise the probability of short-term (i.e. less than one year) capital loss while targeting long-term (i.e. more than<br />
five years) capital growth.<br />
INVESTMENT DATA TO THE END OF JANUARY 2013<br />
RISK VS RETURN<br />
Calculated on 3 year performance returns<br />
Calculated on 5 year performance returns<br />
3 Year Return<br />
(p.a.)<br />
Rank Volatility Rank<br />
Active<br />
Return<br />
Tracking<br />
Error<br />
Sharpe Ratio<br />
5 Year Return<br />
(p.a.)<br />
Rank Volatility Rank<br />
Active<br />
Return<br />
Tracking<br />
Error<br />
Sharpe Ratio<br />
Allan Gray Life Global Stable Portfolio 9.80% 5 3.73% 4 * * 1.02 10.22% 4 4.40% 2 * * 0.57<br />
Investec Cautious Managed Fund 11.53% 4 2.92% 1 -1.02% 4.86% 1.89 11.09% 3 5.85% 4 1.05% 5.00% 0.58<br />
Investment Solutions (Conserver) 12.95% 3 3.15% 3 -0.16% 1.86% 2.20 11.45% 1 5.44% 3 1.23% 2.20% 0.69<br />
OMIGSA MacroSolutions (Profile Capital) 13.33% 2 2.92% 2 0.80% 1.70% 2.51 11.41% 2 3.94% 1 0.79% 1.68% 0.95<br />
SYmmETRY Absolute Balanced Fund 15.91% 1 4.89% 5 3.72% 5.20% 2.03 12.39% 1 6.96% 5 * * 0.68<br />
Lower volatility =<br />
higher ranking<br />
STATISTICS<br />
Range 6.11% 1.24%<br />
Highest 15.91% 4.89% 0.80% 4.86% 2.51 11.45% 5.85% 1.23% 5.00% 0.95<br />
Upper Quartile 13.33% 3.73% 0.32% 3.36% 2.28 11.42% 5.54% 1.14% 3.60% 0.76<br />
Median 12.63% 3.15% -0.16% 1.86% 2.05 11.23% 4.92% 1.05% 2.20% 0.64<br />
Average 12.35% 3.52% -0.13% 2.81% 1.91 10.86% 4.91% 1.02% 2.96% 0.70<br />
Lower Quartile 11.53% 2.92% -0.59% 1.78% 1.67 10.87% 4.29% 0.92% 1.94% 0.58<br />
Lowest 9.80% 2.92% -1.02% 1.70% 1.02 10.22% 3.94% 0.79% 1.68% 0.57<br />
Number of participants 5 5 4 4 5 5 5 3 3 5<br />
* Reasonable use of the survey may be made for purposes of comment and study provided that full acknowledgement is made to "<strong>Alexander</strong> <strong>Forbes</strong> Research & Product Development.<br />
* While all possible care is taken in the compilation of the Survey, reliance is placed on information received from Investment Managers.<br />
* The rankings and statistical information have been supplied for illustrative purposes only.<br />
* Performance figures are shown gross of fees.<br />
* Quantitative figures are calculated on 3 year performance returns.<br />
* Performance should not be judged over a short period of time.<br />
* Past history is not necessarily a guide to future performance.<br />
Lower volatility = higher<br />
ranking
Return (p.a.)<br />
GLOBAL MANAGER WATCH TM CONSERVATIVE<br />
Volatility vs Return Scatterplot - GLOBAL CONSERVATIVE<br />
3 Years ended 31 January 2013<br />
15.70%<br />
SYmmETRY Absolute Balanced Fund<br />
14.70%<br />
13.70%<br />
OMIGSA MacroSolutions (Profile Capital)<br />
12.70%<br />
Investment Solutions (Conserver)<br />
11.70%<br />
Investec Cautious Managed Fund<br />
10.70%<br />
Allan Gray Life Global Stable Portfolio<br />
9.70%<br />
2.90% 3.40% 3.90% 4.40% 4.90%<br />
Volatility (p.a.) (standard deviation)<br />
* Reasonable use of the survey may be made for purposes of comment and study provided that full acknowledgement is made to "<strong>Alexander</strong> <strong>Forbes</strong> Research & Product Development".<br />
** Please see final page for Disclaimers and Glossary **
GLOBAL LARGE MANAGER WATCH TM<br />
Objective - The portfolios are balanced (i.e. multiple asset class) portfolioswith exposure to both <strong>global</strong> and local assets, subject to the restrictions imposed by Regulation 28 of the Pension Funds Act and represent the best investment view of the largest <strong>manager</strong>s of discretionary assets in South Africa, as determined under the survey rules imposed by <strong>Alexander</strong> <strong>Forbes</strong> Research & Product<br />
Development.<br />
INVESTMENT DATA TO THE END OF JANUARY 2013<br />
PERFORMANCE DATA<br />
Month Quarter Year to Date 1 Year 3 Years (p.a.)<br />
5 Years (p.a.) 7 Years (p.a.) 10 Years (p.a.)<br />
Portfolio Rank Benchmark Portfolio Rank Benchmark Portfolio Rank Benchmark Portfolio Rank Benchmark Portfolio Rank Benchmark Portfolio Rank Benchmark Portfolio Rank Benchmark Portfolio Rank Benchmark<br />
INVESTMENT MANAGERS<br />
Allan Gray 5.19% 3 4.40% 6.92% 9 7.52% 5.19% 3 4.40% 19.00% 10 21.68% 15.01% 9 16.32% 12.71% 5 11.62% 14.38% 4 13.01% 18.91% 4 17.57%<br />
Coronation 5.57% 1 4.31% 8.86% 1 7.90% 5.57% 1 4.31% 25.09% 2 22.36% 18.14% 3 16.23% 14.58% 2 11.67% 14.97% 3 12.99% 19.18% 3 17.56%<br />
Foord Asset Management 3.73% 9 3.09% 7.01% 8 7.40% 3.73% 9 3.09% 25.74% 1 21.63% 19.45% 1 16.51% 14.70% 1 10.84% 15.02% 2 12.43% 19.83% 1 15.78%<br />
Investec Asset Management 5.13% 4 2.09% 7.95% 4 6.39% 5.13% 4 2.09% 23.36% 6 20.86% 16.14% 6 16.01% 12.95% 4 11.28% 15.27% 1 12.37% 19.27% 2 16.01%<br />
Oasis 4.52% 5 4.08% 8.56% 2 7.28% 4.52% 5 4.08% 24.07% 4 21.13% 15.71% 8 16.04% 9.99% 11 11.70% 12.24% 8 13.34% 16.63% 9 17.80%<br />
OMIGSA MacroSolutions 4.30% 7 2.84% 7.76% 5 6.30% 4.30% 7 2.84% 20.85% 7 20.78% 15.79% 7 16.24% 11.34% 7 11.70% 12.62% 6 13.07% 17.67% 6 17.41%<br />
Prudential Global Balanced 4.33% 6 4.31% 8.05% 3 7.71% 4.33% 6 4.31% 23.45% 5 21.73% 17.92% 4 16.20% 13.00% 3 11.87% 13.97% 5 13.25% 18.53% 5 17.53%<br />
RE:CM 5.31% 2 0.88% 6.02% 11 3.07% 5.31% 2 0.88% 11.99% 11 14.08% 12.87% 11 13.45% 12.34% 6 14.77% 12.31% 7 14.87% * *<br />
Momentum AM Global Balanced Fund 3.02% 11 3.23% 6.74% 10 7.06% 3.02% 11 3.23% 19.81% 9 22.69% 14.13% 10 16.62% 10.04% 10 11.79% 11.73% 11 13.00% 16.80% 7 16.30%<br />
SIM Global Unique 4.07% 8 4.31% 7.18% 7 7.90% 4.07% 8 4.31% 20.81% 8 22.36% 16.22% 5 16.23% 11.17% 8 11.67% 12.01% 10 12.99% 16.76% 8 17.56%<br />
Stanlib 3.25% 10 4.31% 7.61% 6 7.71% 3.25% 10 4.31% 24.54% 3 21.73% 18.94% 2 16.20% 10.33% 9 11.87% 12.02% 9 13.25% 16.46% 10 17.53%<br />
* Reasonable use of the survey may be made for purposes of comment and study provided that full acknowledgement is made to "<strong>Alexander</strong> <strong>Forbes</strong> Research & Product Development".<br />
* While all possible care is taken in the compilation of the Survey, reliance is placed on information received from Investment Managers.<br />
* The rankings and statistical information have been supplied for illustrative purposes only.<br />
* Performance figures are shown gross of fees.<br />
* Performance should not be judged over a short period of time.<br />
* Past history is not necessarily a guide to future performance.
GLOBAL LARGE MANAGER WATCH TM<br />
Objective - The portfolios are balanced (i.e. multiple asset class) portfolioswith exposure to both <strong>global</strong> and local assets, subject to the restrictions imposed by Regulation 28 of the Pension Funds Act and represent the best investment view of the largest <strong>manager</strong>s of discretionary<br />
assets in South Africa, as determined under the survey rules imposed by <strong>Alexander</strong> <strong>Forbes</strong> Research & Product Development.<br />
INVESTMENT DATA TO THE END OF JANUARY 2013<br />
RISK VS RETURN<br />
Calculated on 3 year performance returns<br />
Calculated on 5 year performance returns<br />
3 Year Return<br />
(p.a.)<br />
Rank Volatility Rank<br />
Active<br />
Return<br />
Tracking<br />
Error<br />
Sharpe Ratio<br />
5 Year Return<br />
(p.a.)<br />
Rank Volatility Rank<br />
Active<br />
Return<br />
Tracking<br />
Error<br />
Sharpe Ratio<br />
Allan Gray 15.01% 9 4.70% 1 -1.31% 3.94% 1.92 12.71% 5 8.05% 2 1.09% 5.19% 0.62<br />
Coronation 18.14% 3 6.99% 5 1.91% 1.52% 1.74 14.58% 2 9.97% 4 2.91% 1.76% 0.69<br />
Foord Asset Management 19.45% 1 7.59% 8 2.94% 2.35% 1.77 14.70% 1 10.16% 5 3.86% 3.66% 0.69<br />
Investec Asset Management 16.14% 6 6.97% 4 0.14% 3.55% 1.46 12.95% 4 11.03% 10 1.67% 4.29% 0.48<br />
Oasis 15.71% 8 6.71% 3 -0.33% 1.77% 1.45 9.99% 11 9.50% 3 -1.71% 2.36% 0.24<br />
OMIGSA MacroSolutions 15.79% 7 7.62% 9 -0.45% 1.69% 1.28 11.34% 7 10.72% 8 -0.36% 1.75% 0.34<br />
Prudential Global Balanced 17.92% 4 8.13% 11 1.72% 1.65% 1.47 13.00% 3 11.00% 9 1.13% 1.70% 0.48<br />
RE:CM 12.87% 11 5.14% 2 -0.58% 5.42% 1.34 12.34% 6 8.04% 1 -2.43% 8.18% 0.58<br />
Momentum AM Global Balanced Fund 14.13% 10 7.27% 6 -2.50% 1.07% 1.12 10.04% 10 10.38% 6 -1.74% 2.15% 0.23<br />
SIM Global Unique 16.22% 5 7.54% 7 -0.01% 1.22% 1.36 11.17% 8 10.52% 7 -0.50% 1.87% 0.33<br />
Stanlib 18.94% 2 8.07% 10 2.74% 2.51% 1.60 10.33% 9 12.02% 11 -1.53% 3.79% 0.22<br />
Lower volatility =<br />
higher ranking<br />
STATISTICS<br />
Range 6.58% 4.71%<br />
Highest 19.45% 8.13% 2.94% 5.42% 1.92 14.70% 12.02% 3.86% 8.18% 0.69<br />
Upper Quartile 18.03% 7.60% 1.81% 3.03% 1.67 12.97% 10.86% 1.40% 4.04% 0.60<br />
Median 15.99% 7.27% -0.01% 1.77% 1.46 11.53% 10.38% -0.36% 2.36% 0.48<br />
Average 16.32% 6.97% 0.39% 2.43% 1.50 11.62% 10.13% 0.22% 3.34% 0.45<br />
Lower Quartile 15.36% 6.84% -0.52% 1.58% 1.35 10.75% 9.73% -1.62% 1.81% 0.29<br />
Lowest 12.87% 4.70% -2.50% 1.07% 1.12 9.99% 8.04% -2.43% 1.70% 0.22<br />
Number of participants 11 11 11 11 11 11 11 11 11 11<br />
* Reasonable use of the survey may be made for purposes of comment and study provided that full acknowledgement is made to "<strong>Alexander</strong> <strong>Forbes</strong> Research & Product Development.<br />
* While all possible care is taken in the compilation of the Survey, reliance is placed on information received from Investment Managers.<br />
* The rankings and statistical information have been supplied for illustrative purposes only.<br />
* Performance figures are shown gross of fees.<br />
* Quantitative figures are calculated on 3 year performance returns.<br />
* Performance should not be judged over a short period of time.<br />
* Past history is not necessarily a guide to future performance.<br />
Lower volatility = higher<br />
ranking
Return (p.a.)<br />
GLOBAL LARGE MANAGER WATCH TM<br />
Volatility vs Return Scatterplot - GLOBAL LARGE<br />
3 Years ended 31 January 2013<br />
Foord Asset Management<br />
18.80%<br />
Stanlib<br />
17.80%<br />
Coronation<br />
Prudential Global Balanced<br />
16.80%<br />
Investec Asset Management<br />
SIM Global Unique<br />
15.80%<br />
Oasis<br />
OMIGSA MacroSolutions<br />
14.80%<br />
Allan Gray<br />
Momentum AM Global Balanced Fund<br />
13.80%<br />
12.80%<br />
RE:CM<br />
4.60% 5.10% 5.60% 6.10% 6.60% 7.10% 7.60% 8.10%<br />
Volatility (p.a.) (standard deviation)<br />
* Reasonable use of the survey may be made for purposes of comment and study provided that full acknowledgement is made to "<strong>Alexander</strong> <strong>Forbes</strong> Research & Product Development".<br />
** Please see final page for Disclaimers and Glossary **
GLOBAL LARGE MANAGER WATCH TM<br />
Objective - The portfolios are balanced (i.e. multiple asset class) portfolios, subject to the restrictions imposed by Regulation 28 of the Pension Funds Act and are have exposure to both <strong>global</strong> and local assets. These statistics represent the various categories that portfolios are represented in but only for those <strong>manager</strong>s that are open to new investments.<br />
LOCAL INVESTABLE PERFORMANCE DATA ANALYSIS TO THE END OF JANUARY 2013<br />
Return - Month Return - Quarter Return - Year to Date Return - 1 Year Return - 3 Years (p.a.) Return - 5 Years (p.a.) Return - 7 Years (p.a.) Return - 10 Years (p.a.)<br />
GLOBAL Dynamic<br />
High 5.30% 9.08% 5.30% 26.32% 19.61% 15.67% 16.09% 19.67%<br />
Upper Quartile 4.87% 7.85% 4.87% 23.45% 16.76% 13.65% 14.02% 18.91%<br />
Median 4.12% 7.27% 4.12% 21.62% 16.72% 12.36% 13.25% 17.53%<br />
Average 4.37% 7.54% 4.37% 22.08% 16.43% 12.45% 13.34% 17.80%<br />
Asset-weighted Average 3.99% 7.23% 3.99% 22.67% 16.40% 13.17% 13.68% 18.03%<br />
Lower Quartile 3.97% 7.26% 3.97% 20.14% 15.97% 11.16% 12.29% 17.58%<br />
Low 3.64% 5.84% 3.64% 19.50% 15.66% 10.08% 12.10% 17.00%<br />
Range 1.66% 3.24% 1.66% 6.82% 3.95% 5.59% 4.00% 2.67%<br />
Number of participants 6 6 6 6 6 6 6 6<br />
GLOBAL BIV<br />
High 5.57% 8.86% 5.57% 25.74% 19.45% 14.70% 15.27% 19.83%<br />
Upper Quartile 4.58% 7.87% 4.58% 23.61% 17.68% 12.97% 13.98% 18.47%<br />
Median 4.31% 7.71% 4.31% 21.73% 16.20% 11.87% 13.25% 17.53%<br />
Average 4.09% 7.28% 4.08% 21.13% 16.04% 11.70% 13.34% 17.80%<br />
Asset-weighted Average 3.73% 6.16% 3.73% 18.46% 13.86% 10.60% 11.40% 14.81%<br />
Lower Quartile 3.25% 6.74% 3.25% 19.64% 15.55% 10.70% 12.02% 16.66%<br />
Low 2.73% 4.88% 2.73% 11.99% 12.87% 9.99% 11.72% 16.40%<br />
Range 2.84% 3.98% 2.84% 13.75% 6.58% 4.71% 3.55% 3.43%<br />
Number of participants 20 20 20 20 15 15 16 14<br />
GLO Conserv<br />
High 3.89% 6.87% 3.89% 19.70% 15.91% 12.39% 11.95% 14.49%<br />
Upper Quartile 3.38% 5.75% 3.38% 18.41% 13.97% 11.69% 11.70% 13.96%<br />
Median 3.06% 5.57% 3.06% 15.97% 12.68% 11.26% 11.65% 14.51%<br />
Average 3.11% 5.58% 3.11% 16.28% 12.65% 11.04% 11.63% 14.62%<br />
Asset-weighted Average 2.42% 4.06% 2.42% 12.44% 9.57% 8.39% 4.52% 14.18%<br />
Lower Quartile 2.79% 5.06% 2.79% 15.98% 12.60% 11.33% 11.21% 12.91%<br />
Low 2.45% 5.00% 2.45% 15.47% 11.53% 11.09% 10.96% 12.39%<br />
Range 1.44% 1.86% 1.44% 4.24% 4.38% 1.30% 0.99% 2.10%<br />
Number of participants 4 4 4 4 4 4 2 2<br />
GLO LMW<br />
High 5.57% 8.86% 5.31% 25.74% 19.45% 14.70% 15.27% 19.83%<br />
Upper Quartile 4.98% 8.02% 4.98% 24.42% 18.08% 12.99% 14.72% 19.18%<br />
Median 4.31% 7.90% 4.31% 22.36% 16.23% 11.67% 12.99% 17.56%<br />
Average 4.32% 7.58% 4.32% 21.95% 16.35% 11.63% 13.01% 17.58%<br />
Asset-weighted Average 3.49% 5.78% 3.49% 17.41% 13.00% 10.01% 10.77% 13.92%<br />
Lower Quartile 3.82% 7.05% 3.82% 20.82% 15.73% 10.54% 12.07% 16.76%<br />
Low 3.02% 6.02% 3.02% 11.99% 12.87% 9.99% 11.73% 16.46%<br />
Range 2.55% 2.84% 2.30% 13.75% 6.58% 4.71% 3.54% 3.37%<br />
Number of participants 10 10 10 10 10 10 10 9<br />
** Median Compounded : The longer term median returns reflected are calculated by compounding the monthly median returns over the various periods.<br />
* Reasonable use of the survey may be made for purposes of comment and study provided that full acknowledgement is made to "<strong>Alexander</strong> <strong>Forbes</strong> Research & Product Development".<br />
** Please see final page for Disclaimers and Glossory **
GLOBAL MANAGER WATCH TM LARGE<br />
Objective - The portfolios are balanced (i.e. multiple asset class) portfolios, subject to the restrictions imposed by Regulation 28 of the Pension Funds Act and are have exposure to both <strong>global</strong> and local assets.These statistics represent the various categories that portfolios are represented in, regardless of whether these asset <strong>manager</strong>s are open to new<br />
investments or not.<br />
GLOBAL NON INVESTABLE PERFORMANCE DATA ANALYSIS TO THE END OF JANUARY 2013<br />
Return - Month Return - Quarter Return - Year to Date Return - 1 Year Return - 3 Years (p.a.) Return - 5 Years (p.a.) Return - 7 Years (p.a.) Return - 10 Years (p.a.)<br />
GLOBAL Dynamic<br />
Median 4.13% 6.91% 4.13% 21.48% 16.87% 12.45% 13.32% 17.58%<br />
Average 4.34% 7.01% 4.34% 20.49% 15.89% 12.13% 13.11% 17.64%<br />
Asset-weighted Average 4.20% 7.42% 4.20% 23.19% 16.91% 13.76% 14.39% 18.03%<br />
Number of participants 7 7 7 7 7 7 7 7<br />
GLOBAL Conservative<br />
Median 3.21% 5.60% 3.21% 15.88% 12.63% 11.23% 11.62% 14.50%<br />
Average 3.19% 5.19% 3.19% 15.52% 12.35% 10.86% 11.50% 14.52%<br />
Asset-weighted Average 3.37% 5.04% 3.37% 15.77% 12.25% 11.19% 11.63% 14.18%<br />
Number of participants 5 5 5 5 5 5 5 5<br />
GLOBAL BIV<br />
Median 4.33% 7.68% 4.32% 21.70% 16.20% 11.87% 13.03% 17.39%<br />
Average 4.14% 7.26% 4.14% 21.02% 16.05% 11.71% 12.93% 17.33%<br />
Asset-weighted Average 4.74% 7.51% 4.74% 22.15% 16.85% 13.13% 14.24% 18.78%<br />
Number of participants 21 21 21 21 21 21 21 21<br />
GLOBAL LMW<br />
Median 4.33% 7.85% 4.33% 21.70% 15.99% 11.53% 12.89% 17.49%<br />
Average 4.40% 7.52% 4.40% 21.68% 16.32% 11.62% 13.01% 17.57%<br />
Asset-weighted Average 4.78% 7.50% 4.78% 22.14% 16.74% 13.18% 14.35% 18.94%<br />
Number of participants 11 11 11 11 11 11 11 10<br />
** Median Compounded : The longer term median returns reflected are calculated by compounding the monthly median returns over the various periods.<br />
* Reasonable use of the survey may be made for purposes of comment and study provided that full acknowledgement is made to "<strong>Alexander</strong> <strong>Forbes</strong> Research & Product Development".<br />
** Please see final page for Disclaimers and Glossory **
MARKET DATA<br />
Month<br />
MARKET DATA TO THE END OF JANUARY 2013<br />
Quarter<br />
PERFORMANCE DATA<br />
Year to date<br />
1 Year 3 Years (p.a.)<br />
INDEX RETURNS INCLUDING INCOME & INFLATION<br />
5 Years (p.a.)<br />
7 Years (p.a.)<br />
FTSE / JSE All Share Index (Free Float)<br />
FTSE / JSE Capped All Share Index<br />
FTSE / JSE SWIX All Share Index<br />
FTSE/JSE Mid Cap Index<br />
FTSE/JSE Small Cap Index<br />
FTSE/JSE SA Listed Property Index<br />
JSE Property Unit Trusts<br />
All Bond<br />
Barclays Capital ILB Index<br />
OTHI Index<br />
GOVI Index<br />
<strong>Alexander</strong> <strong>Forbes</strong> Money Market<br />
Short Term Fixed Interest Rate Index<br />
Combination of old CPIX and new CPI<br />
Consumer Price Inflation (Old/New combined CPI)<br />
3.23%<br />
3.15%<br />
1.51%<br />
-0.53%<br />
3.84%<br />
0.99%<br />
-0.36%<br />
0.07%<br />
-0.43%<br />
0.05%<br />
0.07%<br />
0.43%<br />
0.43%<br />
0.24%<br />
0.24%<br />
9.29%<br />
9.22%<br />
8.17%<br />
6.07%<br />
11.41%<br />
8.18%<br />
7.22%<br />
3.28%<br />
3.66%<br />
4.05%<br />
3.15%<br />
1.28%<br />
1.29%<br />
1.12%<br />
1.12%<br />
3.23%<br />
3.15%<br />
1.51%<br />
-0.53%<br />
3.84%<br />
0.99%<br />
-0.36%<br />
0.07%<br />
-0.43%<br />
0.05%<br />
0.07%<br />
0.43%<br />
0.43%<br />
0.24%<br />
0.24%<br />
23.68%<br />
23.72%<br />
25.35%<br />
19.84%<br />
24.25%<br />
31.00%<br />
22.81%<br />
13.73%<br />
17.77%<br />
15.18%<br />
13.48%<br />
5.54%<br />
5.50%<br />
5.67%<br />
5.67%<br />
18.26%<br />
18.55%<br />
19.24%<br />
17.34%<br />
15.35%<br />
24.50%<br />
20.91%<br />
13.14%<br />
14.24%<br />
14.20%<br />
12.56%<br />
6.01%<br />
6.00%<br />
5.08%<br />
5.08%<br />
11.39%<br />
12.19%<br />
12.56%<br />
13.34%<br />
6.93%<br />
18.75%<br />
16.91%<br />
11.07%<br />
12.44%<br />
11.79%<br />
10.27%<br />
7.77%<br />
7.69%<br />
6.36%<br />
6.20%<br />
13.95%<br />
14.38%<br />
14.20%<br />
12.36%<br />
10.75%<br />
18.07%<br />
14.36%<br />
9.02%<br />
11.74%<br />
9.18%<br />
8.52%<br />
8.17%<br />
7.92%<br />
6.47%<br />
6.53%<br />
19.92%<br />
20.41%<br />
20.85%<br />
19.24%<br />
20.69%<br />
*<br />
22.57%<br />
10.50%<br />
11.16%<br />
10.67%<br />
10.12%<br />
8.51%<br />
8.22%<br />
5.76%<br />
5.28%<br />
Consumer Price Inflation excluding OER [I-Net code: AECPIXU] 0.16%<br />
Consumer Price Inflation (Headline CPI) [I-Net code: AECPI] 0.24%<br />
1.19%<br />
1.12%<br />
0.16%<br />
0.24%<br />
5.81%<br />
5.67%<br />
5.21%<br />
5.08%<br />
6.30%<br />
6.11%<br />
6.43%<br />
6.11%<br />
5.73%<br />
4.48%<br />
JP Morgan Global Bond Index<br />
MSCI World Index (Rands)<br />
Citi WGBI ( was Salomon Brothers Bond Index) (Rands)<br />
3.71%<br />
10.69%<br />
3.96%<br />
-0.04%<br />
11.51%<br />
0.30%<br />
3.71%<br />
10.69%<br />
3.96%<br />
12.85%<br />
33.58%<br />
13.29%<br />
10.28%<br />
17.30%<br />
9.90%<br />
8.34%<br />
5.64%<br />
7.92%<br />
12.00%<br />
9.55%<br />
11.74%<br />
6.47%<br />
9.45%<br />
6.25%<br />
10 Years (p.a.)<br />
QUANTITATIVE ANALYSIS<br />
Calculated on rolling performance returns<br />
FTSE / JSE All Share Index (Free Float)<br />
FTSE / JSE Capped All Share Index<br />
FTSE / JSE SWIX All Share Index<br />
FTSE/JSE Mid Cap Index<br />
FTSE/JSE Small Cap Index<br />
FTSE/JSE SA Listed Property Index<br />
JSE Property Unit Trusts<br />
All Bond<br />
Barclays Capital ILB Index<br />
OTHI Index<br />
GOVI Index<br />
<strong>Alexander</strong> <strong>Forbes</strong> Money Market<br />
Short Term Fixed Interest Rate Index<br />
JP Morgan Global Bond Index<br />
MSCI World Index (Rands)<br />
Citi WGBI ( was Salomon Brothers Bond Index) (Rands)<br />
Volatility (3 years)<br />
12.90%<br />
18.23%<br />
12.69%<br />
17.58%<br />
11.85%<br />
16.59%<br />
9.31%<br />
14.05%<br />
8.74%<br />
13.23%<br />
10.75% 15.71%<br />
9.86%<br />
14.93%<br />
5.43% 7.24%<br />
4.75% 4.98%<br />
6.57% 8.66%<br />
5.20%<br />
6.75%<br />
0.17%<br />
0.71%<br />
0.18%<br />
0.66%<br />
15.13%<br />
1.38%<br />
12.97%<br />
17.99%<br />
14.84%<br />
14.67%<br />
* The risk-free rate used in the quantitative calculations is the South African 3 month Treasury Bill<br />
International Indices sourced from Morningstar<br />
Volatility (5 years)<br />
All rights in the FTSE/JSE Africa Index Series vest in the JSE Securities Exchange South Africa (JSE) and in FTSE International Limited (FTSE) jointly. FTSE TM is a trade mark of the London Stock Exchange Limited<br />
(LSE) and The Financial Times Limited (FT) jointly and issued by FTSE under licence. JSE is a trade mark of the JSE.<br />
The FTSE/JSE Africa Index Series is calculated by FTSE International Limited (FTSE) in conjunction with the JSE Securities Exchange South Africa (JSE) in accordance with standard criteria. The FTSE/JSE Africa Index<br />
Series is the proprietary information of FTSE and the JSE. All copyright subsisting in the FTSE/JSE Africa Index values and constituent list vests in FTSE and the JSE jointly. All their rights are reserved.<br />
* Reasonable use of the survey may be made for purposes of comment and study provided that full acknowledgement is made to "<strong>Alexander</strong> <strong>Forbes</strong> Research & Product Development".<br />
* While all possible care is taken in the compilation of the Survey, reliance is placed on information received from Investment Managers.<br />
* The rankings and statistical information have been supplied for illustrative purposes only.<br />
* Performance figures are shown gross of fees.<br />
* Performance should not be judged over a short period of time.<br />
* Past history is not necessarily a guide to future performance.
APPENDIX<br />
EXPLANATORY NOTES<br />
General Disclaimers :<br />
This document has been prepared for use by clients of the <strong>Alexander</strong> <strong>Forbes</strong> Group. Any other third party that is not a client of the <strong>Alexander</strong> <strong>Forbes</strong> Group and for whose specific use this document has not been supplied, must be aware that <strong>Alexander</strong> <strong>Forbes</strong> Group shall not be<br />
liable for any damage, loss or liability of any nature incurred by any third party and resulting from the information contained herein.<br />
The information contained herein is supplied on an "as is" basis and has not been compiled to meet any third party’s individual requirements. It is the responsibility of any third party to satisfy himself or herself, prior to relying on this information that the contents meets the third<br />
party’s individual requirements.<br />
Nothing in this document, when read in isolation and without professional advice, should be construed as solicitation, offer, advice, recommendation, or any other enticement to acquire or dispose of any financial product, advice or investment, or to engage in any financial<br />
transaction or investment. A third party should consult with an authorised financial advisor prior to making any financial decisions<br />
<strong>Alexander</strong> <strong>Forbes</strong> has taken all reasonable steps to ensure the quality and accuracy of the contents of this document and encourages all readers to report incorrect and untrue information, subject to the right of <strong>Alexander</strong> <strong>Forbes</strong> to determine, in its sole and absolute discretion,<br />
the contents of this document. Irrespective of the attempts by <strong>Alexander</strong> <strong>Forbes</strong> to ensure the correctness of this document, <strong>Alexander</strong> <strong>Forbes</strong> does not make any warranties or representations that the content will in all cases be true, correct or free from any errors. In particular,<br />
certain aspects of this document might rely on or be based on information supplied to <strong>Alexander</strong> <strong>Forbes</strong> by other persons or institutions.<br />
<strong>Alexander</strong> <strong>Forbes</strong> has attempted to ensure the accuracy of such information, but shall not be liable for any damage, loss or liability of any nature incurred by any party and resulting from the errors caused by incorrect information supplied to <strong>Alexander</strong> <strong>Forbes</strong>.<br />
Performance figures are shown gross of fees and taxes. Past history is not necessarily a guide to future performance.<br />
Quantitative figures are calculated on 3 year performance returns.<br />
FAIS Performance Notice and should Disclaimer: not be judged This information over a short is period not advice of time. as defined and contemplated in the Financial Advisory and Intermediary Services Act, 37 of 2002, as amended. <strong>Alexander</strong> <strong>Forbes</strong> shall not be liable for any actions taken by any person based on the correctness of this<br />
information.<br />
General :<br />
GIPS is a trademark owned by the CFA Institute<br />
Statistical Definitions :<br />
The Median is the value above or below which half the <strong>manager</strong>s fall.<br />
The Upper Quartile is the value above which one quarter of the <strong>manager</strong>s fall.<br />
The Lower Quartile is the value below which one quarter of the <strong>manager</strong>s fall.<br />
Risk Analysis Definitions :<br />
"Volatility" is the annualised standard deviation of the <strong>manager</strong>'s monthly returns around its average / mean.<br />
"Volatility" is a measure of the variability of the <strong>manager</strong>'s returns.<br />
"Return to Risk" is the return divided by the "Volatility"<br />
"Return to Risk" is a measure of the return earned per unit of risk taken.<br />
"Active return" is the return earned by the portfolio less the return on the benchmark.<br />
"Active Return" is a measure of the value that the <strong>manager</strong> has added or detracted over its benchmark return.<br />
"Tracking Error" is the annualised standard deviation of the monthly "Active Returns".<br />
"Tracking Error" is a measure of the variability of the <strong>manager</strong>'s returns relative to its benchmark returns.<br />
"Sharpe Ratio" is the return earned by the portfolio less a risk-free rate divided by the "Volatility" of the portfolio.<br />
"Sharpe Ratio" is a measure of what amount of the performance is due to smart investment decisions versus excessive risk.<br />
GIPS - Global Investment Performance Standards<br />
Ethical principles to achieve full disclosure and fair presentation of investment performance<br />
In South Africa GIPS SA requires <strong>manager</strong>s to obtain a verification certificate on compliance<br />
GIPS - Status:<br />
C - Indication that <strong>manager</strong> is compliant but not verified<br />
V - Indication that <strong>manager</strong> is verified<br />
More information can be obtained from http://www.gipsstandards.org/