Medical -Aid Manager WatchTM Survey for the ... - Alexander Forbes
Medical -Aid Manager WatchTM Survey for the ... - Alexander Forbes
Medical -Aid Manager WatchTM Survey for the ... - Alexander Forbes

You also want an ePaper? Increase the reach of your titles
YUMPU automatically turns print PDFs into web optimized ePapers that Google loves.
MAY 2012/05/31 2012/03/01 2012/01/01 2011/06/01 2009/06/01 2007/06/01<br />
MARCH 2012/03/31 2012/01/01 2005/12/01 2011/04/01 2009/04/01 2007/04/01<br />
Month Ending<br />
Previous Month<br />
May 2012<br />
March 2012<br />
<strong>Medical</strong>-<strong>Aid</strong> <strong>Manager</strong> Watch <strong>Survey</strong><br />
December 2007<br />
<strong>Medical</strong> -<strong>Aid</strong> <strong>Manager</strong> Watch TM <strong>Survey</strong><br />
<strong>for</strong> <strong>the</strong> month ending May 2012
MEDICAL-AID MANAGER WATCH SURVEY<br />
Objective - The portfolios in this <strong>Survey</strong> are targeted at <strong>Medical</strong> <strong>Aid</strong>s and are bound by <strong>the</strong> restrictions imposed by Regulation 30 of <strong>the</strong> <strong>Medical</strong> Schemes Act.<br />
Benchmark Methodology CPI - Due to <strong>the</strong> reweighting and rebasing of <strong>the</strong> CPI from January 2009 <strong>the</strong> benchmark numbers reflect a compound of month to month CPI returns. The historical month to month numbers used in calculations are <strong>the</strong> official month to month numbers based on <strong>the</strong> old basket prior to January 2009 and new basket post January<br />
2009. The adjusted CPI(I-Net code: AECPI) figures are shown toge<strong>the</strong>r with statistics below should <strong>the</strong>se numbers be preferred <strong>for</strong> comparison purposes.<br />
Benchmark Methodology CPIX - The benchmark numbers prior to January 2009 reflected a compound of month to month CPIX returns. Due to <strong>the</strong> reweighting and rebasing of <strong>the</strong> CPI and discarding of <strong>the</strong> CPIX numbers from January 2009 <strong>the</strong> historical month to month numbers used in calculations are <strong>the</strong> official month to month numbers based<br />
on <strong>the</strong> old CPIX prior to January 2009 and <strong>the</strong> new CPI basket post January 2009. The CPI excluding owners equivalent rent (I-Net code: AECPIX) and adjusted CPI(I-Net code: AECPI) figures are shown toge<strong>the</strong>r with statistics below should <strong>the</strong>se numbers be preferred <strong>for</strong> comparison purposes.<br />
INVESTMENT DATA TO THE END OF MAY 2012<br />
Fund In<strong>for</strong>mation<br />
Month<br />
Quarter<br />
Year to Date<br />
PERFORMANCE DATA<br />
1 Year<br />
3 Years (p.a.)<br />
Benchmark Classification Portfolio Benchmark Portfolio Benchmark Portfolio Benchmark Portfolio Benchmark Portfolio Benchmark Volatility<br />
ABSOLUTE RETURN FUNDS<br />
Size (R m)<br />
Rank<br />
Cadiz Capital Preservation Fund Headline CPI +3% Pooled<br />
0.30% 0.65% 1.29% 2.81% 2.55% 4.08% 6.82% 9.12% 8.45% 8.05% 2.10% 1333.9 2<br />
Cadiz <strong>Medical</strong> <strong>Aid</strong> Fund Headline CPI +4% Segregated -1.36% 0.74% 0.10% 3.06% 4.13% 4.49% 7.70% 10.12% * * * 226.7 8<br />
Coronation <strong>Medical</strong> Absolute Headline CPI +3% Pooled<br />
-1.04% 0.65% 1.16% 2.81% 4.95% 4.08% 8.37% 9.12% 13.83% 8.05% 4.56% 758.0 4<br />
IS <strong>Medical</strong> Schemes Real Return Focus Headline CPI +4% Pooled Multi-Managed -1.00% 0.74% 0.03% 3.06% 2.56% 4.49% 4.48% 10.12% 10.21% 9.05% 3.50% 182.7 10<br />
Momentum AM <strong>Medical</strong> Provider Fund CPI + 3% (CPIX +3% prior Jan 09) Pooled<br />
-0.90% 0.65% 0.40% 2.81% 3.55% 4.08% 6.97% 9.12% 11.34% 8.05% 5.26% 94.5 11<br />
OMIGSA Capital Builder Headline CPI +4% Pooled<br />
-0.24% 0.74% 0.10% 3.06% 2.47% 4.49% 4.63% 10.12% 6.14% 9.05% 3.46% 1374.5 1<br />
Prescient Positive Return <strong>Medical</strong> <strong>Aid</strong> Fund CPI + 3% (CPIX +3% prior Jan 09) Segregated<br />
-0.69% 0.65% -0.79% 2.81% 1.48% 4.08% 2.50% 9.12% 7.03% 8.05% 2.69% 1106.5 3<br />
Prudential <strong>Medical</strong> <strong>Aid</strong> Fund Headline CPI +5% Segregated -0.92% 0.82% 1.74% 3.30% 6.26% 4.89% 11.88% 11.12% 14.86% 10.05% 5.93% 632.9 6<br />
SIM <strong>Medical</strong> <strong>Aid</strong> Domestic Absolute Headline CPI +5% Segregated<br />
-0.75% 0.82% 0.98% 3.30% 4.61% 4.89% 9.51% 11.12% * * * 397.1 7<br />
STANLIB <strong>Medical</strong> Investment Fund* Headline CPI +4% Pooled (Unit Trust)<br />
0.62% 0.74% 2.95% 3.06% 5.95% 4.49% 9.73% 10.12% 8.82% 9.05% 4.25% 185.6 9<br />
Pooled 635.9<br />
Taquanta <strong>Medical</strong> Absolute Headline CPI +4.5% 0.30% 0.78% 0.88% 3.18% 2.21% 4.69% 5.62% 10.62% 9.08% 9.55% 1.14% 5<br />
MONEY MARKET FUNDS<br />
ABSA Asset Management <strong>Medical</strong>* 50% ALBI : 50% STEFI Segregated<br />
0.15% 0.23% 1.54% 1.66% 3.26% 3.26% 7.78% 8.37% 7.80% 8.49% 1.65% 196.4 5<br />
Cadiz African Harvest Core Money Market STEFI Segregated 0.51% 0.47% 1.51% 1.40% 2.49% 2.33% 5.96% 5.72% 6.93% 6.56% 0.31% 391.5 4<br />
Gryphon Domestic Specialist MM STEFI Segregated<br />
0.50% 0.47% 1.49% 1.40% 2.47% 2.33% 6.02% 5.72% 7.08% 6.56% 0.30% 963.1 2<br />
Investec Stable Money Fund STEFI Pooled<br />
0.55% 0.47% 1.64% 1.40% 2.73% 2.33% 6.67% 5.72% 7.50% 6.56% 0.27% 803.4 3<br />
Taquanta <strong>Medical</strong> Cash STEFI Segregated 0.59% 0.47% 1.76% 1.40% 2.93% 2.33% 7.14% 5.72% 7.68% 6.56% 0.19% 6111.4 1<br />
BALANCED FUNDS<br />
Allan Gray Life Stable <strong>Medical</strong> Portfolio Headline CPI +3% Pooled<br />
0.61% 0.65% 1.43% 2.81% 2.67% 4.08% 8.60% 9.12% 9.97% 8.05% 2.17% 1463.1 1<br />
Foord <strong>Medical</strong> 50% domestic bonds: 50% domestic equities Segregated<br />
-1.33% -1.13% 1.43% 0.47% 6.49% 4.26% 10.92% 7.57% 13.26% 12.84% 4.60% 222.3 3<br />
OMIGSA MacroSolutions <strong>Medical</strong> <strong>Aid</strong> Portfolio Headline CPI +5% Segregated<br />
-0.27% 0.82% 1.70% 3.30% 5.17% 4.89% 10.55% 11.12% 12.78% 10.05% 4.88% 399.4 2<br />
STATISTICS<br />
Combination of old CPIX and new CPI# 0.41% 2.07% 2.84% 6.12% 5.05% 1.09%<br />
Consumer Price Inflation (Old/New combined CPI)# 0.41% 2.07% 2.84% 6.12% 5.05% 1.09%<br />
Consumer Price Inflation excluding OER [I-Net code: AECPIXU] 0.49% 2.15% 2.91% 6.36% 5.15% 1.23%<br />
Consumer Price Inflation (Headline CPI) [I-Net code: AECPI] 0.41% 2.07% 2.84% 6.12% 5.05% 1.09%<br />
<strong>Medical</strong> Consumer Price Inflation 0.23% 4.48% 4.57% 5.23% 5.94% 4.27%<br />
FTSE / JSE All Share Index (Free Float) -3.59% -2.26% 5.10% 5.08% 16.43% 14.51%<br />
FTSE / JSE SWIX All Share Index -3.11% -0.45% 6.98% 9.14% 18.18% 13.06%<br />
Short Term Fixed Interest Rate Index 0.47% 1.40% 2.33% 5.72% 6.56% 0.26%<br />
All Bond Index -0.01% 1.92% 4.20% 11.06% 10.62% 4.93%<br />
Number Of Participants 19 19 19 19 17 17<br />
17478.8<br />
Index<br />
Inflation figures lagged by one month<br />
* Global Funds<br />
Reasonable use of <strong>the</strong> survey may be made <strong>for</strong> purposes of comment and study provided that full acknowledgement is made to "<strong>Alexander</strong> <strong>Forbes</strong> Asset Consultants".<br />
** Please see final page <strong>for</strong> Disclaimers and Glossary **<br />
# Please refer to Benchmark Methodology at <strong>the</strong> top of <strong>the</strong> page
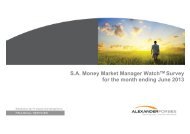
3 year returns<br />
MEDICAL-AID MANAGER WATCH SURVEY<br />
Risk-Return Scatterplot of <strong>Medical</strong> <strong>Aid</strong> <strong>Manager</strong>s <strong>for</strong> 3 years to 31 May 2012<br />
Prudential <strong>Medical</strong> <strong>Aid</strong> Fund<br />
14.05%<br />
13.05%<br />
12.05%<br />
Coronation <strong>Medical</strong><br />
Absolute<br />
OMIGSA MacroSolutions <strong>Medical</strong><br />
<strong>Aid</strong> Portfolio<br />
Foord <strong>Medical</strong><br />
11.05%<br />
10.05%<br />
Allan Gray Life<br />
Stable <strong>Medical</strong> Portfolio<br />
IS <strong>Medical</strong> Schemes<br />
Real Return Focus<br />
Momentum AM <strong>Medical</strong><br />
Provider Fund<br />
9.05%<br />
Taquanta <strong>Medical</strong> Absolute<br />
Cadiz Capital Preservation Fund<br />
STANLIB <strong>Medical</strong> Investment Fund*<br />
8.05%<br />
Taquanta <strong>Medical</strong> Cash<br />
7.05%<br />
ABSA Asset Management <strong>Medical</strong>*<br />
Investec Stable Money Fund<br />
Gryphon Domestic<br />
Prescient Positive Return<br />
Specialist MM<br />
<strong>Medical</strong> <strong>Aid</strong> Fund<br />
Cadiz African Harvest Core Money<br />
STeFI<br />
Market<br />
6.05%<br />
OMIGSA Capital Builder<br />
0.10% 2.10% 4.10%<br />
3 year volatility<br />
Reasonable use of <strong>the</strong> survey may be made <strong>for</strong> purposes of comment and study provided that full acknowledgement is made to "<strong>Alexander</strong> <strong>Forbes</strong> Asset Consultants".
MEDICAL-AID MANAGER WATCH SURVEY<br />
EXPLANATORY NOTES<br />
Index<br />
General Disclaimers :<br />
This document has been prepared <strong>for</strong> use by clients of <strong>the</strong> <strong>Alexander</strong> <strong>Forbes</strong> Group. Any o<strong>the</strong>r third party that is not a client of <strong>the</strong> <strong>Alexander</strong> <strong>Forbes</strong> Group and <strong>for</strong><br />
whose specific use this document has not been supplied, must be aware that <strong>Alexander</strong> <strong>Forbes</strong> Group shall not be liable <strong>for</strong> any damage, loss or liability of any nature<br />
incurred by any third party and resulting from <strong>the</strong> in<strong>for</strong>mation contained herein.<br />
The in<strong>for</strong>mation contained herein is supplied on an "as is" basis and has not been compiled to meet any third party’s individual requirements. It is <strong>the</strong> responsibility of<br />
any third party to satisfy himself or herself, prior to relying on this in<strong>for</strong>mation that <strong>the</strong> contents meets <strong>the</strong> third party’s individual requirements.<br />
Nothing in this document, when read in isolation and without professional advice, should be construed as solicitation, offer, advice, recommendation, or any o<strong>the</strong>r<br />
enticement to acquire or dispose of any financial product, advice or investment, or to engage in any financial transaction or investment. A third party should consult<br />
with an authorised financial advisor prior to making any financial decisions.<br />
<strong>Alexander</strong> <strong>Forbes</strong> has taken all reasonable steps to ensure <strong>the</strong> quality and accuracy of <strong>the</strong> contents of this document and encourages all readers to report incorrect and<br />
untrue in<strong>for</strong>mation, subject to <strong>the</strong> right of <strong>Alexander</strong> <strong>Forbes</strong> to determine, in its sole and absolute discretion, <strong>the</strong> contents of this document. Irrespective of <strong>the</strong><br />
attempts by <strong>Alexander</strong> <strong>Forbes</strong> to ensure <strong>the</strong> correctness of this document, <strong>Alexander</strong> <strong>Forbes</strong> does not make any warranties or representations that <strong>the</strong> content will in all<br />
cases be true, correct or free from any errors.In particular, certain aspects of this document might rely on or be based on in<strong>for</strong>mation supplied to <strong>Alexander</strong> <strong>Forbes</strong> by<br />
o<strong>the</strong>r persons or institutions.<br />
<strong>Alexander</strong> <strong>Forbes</strong> has attempted to ensure <strong>the</strong> accuracy of such in<strong>for</strong>mation, but shall not be liable <strong>for</strong> any damage, loss or liability of any nature incurred by any party<br />
and resulting from <strong>the</strong> errors caused by incorrect in<strong>for</strong>mation supplied to <strong>Alexander</strong> <strong>Forbes</strong>.<br />
Per<strong>for</strong>mance figures are shown gross of fees and taxes. Past history is not necessarily a guide to future per<strong>for</strong>mance.<br />
Quantitative figures are calculated on 3 year per<strong>for</strong>mance returns.<br />
Per<strong>for</strong>mance should not be judged over a short period of time.<br />
FAIS Notice and Disclaimer: This in<strong>for</strong>mation is not advice as defined and contemplated in <strong>the</strong> Financial Advisory and Intermediary Services Act, 37 of 2002, as amended.<br />
<strong>Alexander</strong> <strong>Forbes</strong> shall not be liable <strong>for</strong> any actions taken by any person based on <strong>the</strong> correctness of this in<strong>for</strong>mation.<br />
General :<br />
GIPS is a trademark owned by <strong>the</strong> CFA Institute.<br />
Statistical Definitions :<br />
The Median is <strong>the</strong> value above or below which half <strong>the</strong> managers fall.<br />
The Upper Quartile is <strong>the</strong> value above which one quarter of <strong>the</strong> managers fall.<br />
The Lower Quartile is <strong>the</strong> value below which one quarter of <strong>the</strong> managers fall.<br />
Risk Anlysis Definitions :<br />
"Volatility" is <strong>the</strong> annualised standard deviation of <strong>the</strong> manager's monthly returns.<br />
"Volatility" is a measure of <strong>the</strong> variability of <strong>the</strong> manager's returns.<br />
"Return to Risk" is <strong>the</strong> return divided by <strong>the</strong> "Volatility"<br />
"Return to Risk" is a measure of <strong>the</strong> return earned per unit of risk taken.<br />
"Active return" is <strong>the</strong> return earned by <strong>the</strong> manager less <strong>the</strong> return on <strong>the</strong> benchmark.<br />
"Active Return" is a measure of <strong>the</strong> value that <strong>the</strong> manager has added or detracted over <strong>the</strong> benchmark return.<br />
"Tracking Error" is <strong>the</strong> annualised standard deviation of <strong>the</strong> monthly "Active Returns".<br />
"Tracking Error" is a measure of <strong>the</strong> variability of <strong>the</strong> manager's returns relative to <strong>the</strong> benchmark returns.<br />
"In<strong>for</strong>mation Ratio" is <strong>the</strong> "Active Return" divided by <strong>the</strong> "Tracking Error".<br />
"In<strong>for</strong>mation Ratio" is a measure of <strong>the</strong> value added per unit of risk taken relative to <strong>the</strong> benchmark.<br />
"Sortino Ratio (Capital Loss)" measures whe<strong>the</strong>r <strong>the</strong> return in excess of a zero benchmark was sufficient to cover <strong>the</strong> downside volatility/risk inherent in <strong>the</strong> investment<br />
ie whe<strong>the</strong>r capital was indeed preserved.<br />
"Sortino Ratio (Inflation)" measures whe<strong>the</strong>r <strong>the</strong> return in excess of a inflationary benchmark was sufficient to cover <strong>the</strong> downside volatility/risk inherent in <strong>the</strong><br />
investment ie whe<strong>the</strong>r capital was protected in real terms.<br />
GIPS - Global Investment Per<strong>for</strong>mance Standards<br />
Ethical principles to achieve full disclosure and fair presentation of investment per<strong>for</strong>mance