

Fuel consumption potential of the pushbelt CVT Abstract 1 - Bosch
Fuel consumption potential of the pushbelt CVT Abstract 1 - Bosch
Fuel consumption potential of the pushbelt CVT Abstract 1 - Bosch

You also want an ePaper? Increase the reach of your titles
YUMPU automatically turns print PDFs into web optimized ePapers that Google loves.
<strong>Fuel</strong> <strong>consumption</strong> <strong>potential</strong> <strong>of</strong> <strong>the</strong> <strong>pushbelt</strong> <strong>CVT</strong><br />
Ir. Francis van der Sluis, <strong>Bosch</strong> - Van Doorne’s Transmissie,<br />
Tilburg, <strong>the</strong> Ne<strong>the</strong>rlands<br />
<strong>Abstract</strong><br />
The efforts to fur<strong>the</strong>r reduce fuel <strong>consumption</strong> <strong>of</strong> vehicles equipped with a <strong>pushbelt</strong> type<br />
Continuously Variable Transmission (<strong>CVT</strong>) focus on different sources <strong>of</strong> loss. In this<br />
paper <strong>the</strong> magnitude <strong>of</strong> <strong>the</strong>se losses and <strong>the</strong>ir <strong>potential</strong> for reduction is described.<br />
Inside <strong>the</strong> <strong>CVT</strong>, <strong>the</strong> variator, its control strategy and <strong>the</strong> hydraulic actuation circuit can<br />
be distinguished as <strong>the</strong> main <strong>potential</strong>s. A major opportunity is <strong>of</strong>fered by a new control<br />
strategy that takes <strong>the</strong> actual slip between belt and pulley as <strong>the</strong> control parameter. The<br />
resulting decrease <strong>of</strong> clamping forces on <strong>the</strong> <strong>pushbelt</strong> leads to a reduction <strong>of</strong> variator<br />
and actuation losses. Fur<strong>the</strong>r <strong>potential</strong> is found in <strong>the</strong> hydraulic actuation circuit by an<br />
improved tuning <strong>of</strong> <strong>the</strong> power supply to <strong>the</strong> actual power requirement. Outside <strong>the</strong> <strong>CVT</strong><br />
additional <strong>potential</strong> is found in start-stop functionality as supported by measures inside<br />
<strong>the</strong> transmission.<br />
The paper describes <strong>the</strong> <strong>the</strong>oretical background as well as practical fuel savings <strong>of</strong> up<br />
to 5.5% that were obtained in tests on vehicle level. Slip control adds an inherent<br />
robustness to <strong>the</strong> operation <strong>of</strong> <strong>the</strong> <strong>pushbelt</strong> and opens up <strong>the</strong> fuel saving <strong>potential</strong> <strong>of</strong> <strong>the</strong><br />
<strong>CVT</strong> giving great <strong>potential</strong> to fur<strong>the</strong>r improve its position as a state <strong>of</strong> <strong>the</strong> art automatic<br />
transmission technology.<br />
1. Introduction<br />
New vehicles are <strong>of</strong>fered with an increasing variety <strong>of</strong> transmission types. The <strong>CVT</strong><br />
based on <strong>the</strong> <strong>pushbelt</strong> principle is a rapidly expanding technology. In 2006 over 2.5<br />
million <strong>pushbelt</strong>s will be produced and installed in over 70 vehicle models worldwide.<br />
The latest design has a torque capacity <strong>of</strong> 400 Nm and covers <strong>the</strong> full range <strong>of</strong> front<br />
wheel driven vehicles (1). The increase in power density <strong>of</strong>fers cost reductions for<br />
current and new applications.<br />
12<br />
11<br />
10<br />
9<br />
8<br />
7<br />
6<br />
4/5 AT<br />
6AT<br />
<strong>CVT</strong> belt<br />
5<br />
1000 1200 1400 1600 1800 2000<br />
4/5 AT<br />
10<br />
6AT<br />
9<br />
<strong>CVT</strong> belt<br />
<strong>CVT</strong> 8 chain<br />
DCT<br />
7<br />
5<br />
1000 1200 1400 1600 1800 2000<br />
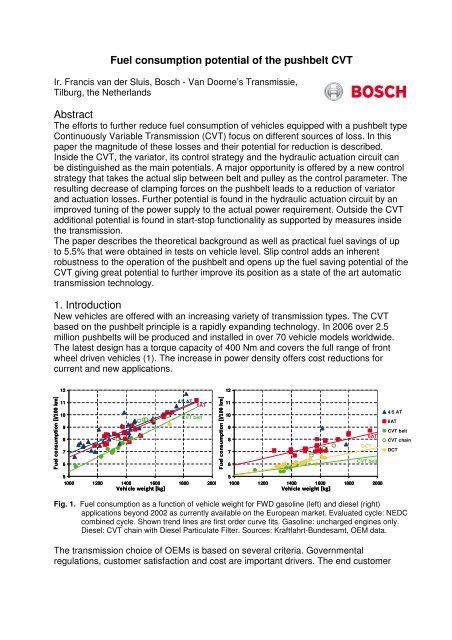
Fig. 1. <strong>Fuel</strong> <strong>consumption</strong> as a function <strong>of</strong> vehicle weight for FWD gasoline (left) and diesel (right)<br />
applications beyond 2002 as currently available on <strong>the</strong> European market. Evaluated cycle: NEDC<br />
combined cycle. Shown trend lines are first order curve fits. Gasoline: uncharged engines only.<br />
Diesel: <strong>CVT</strong> chain with Diesel Particulate Filter. Sources: Kraftfahrt-Bundesamt, OEM data.<br />
The transmission choice <strong>of</strong> OEMs is based on several criteria. Governmental<br />
regulations, customer satisfaction and cost are important drivers. The end customer<br />
12<br />
11<br />
6<br />
6AT<br />
DCT<br />
<strong>CVT</strong> belt<br />
4/5 AT<br />
6AT<br />
<strong>CVT</strong> belt<br />
<strong>CVT</strong> chain<br />
DCT
appreciates criteria like comfort, fun to drive, cost, performance, fuel <strong>consumption</strong> and<br />
emissions.<br />
With oil prices rising and emission legislation tightening, fuel <strong>consumption</strong> has become<br />
a primary driver (2). This is especially true for Japan where emission regulations are<br />
most strict and <strong>the</strong> choice for <strong>the</strong> most fuel efficient technology is almost mandatory.<br />
A recent study on <strong>the</strong> Japanese transmission market (3) has proven <strong>the</strong> latest<br />
generation <strong>CVT</strong>s based on <strong>the</strong> <strong>pushbelt</strong> principle to be <strong>the</strong> industries benchmark<br />
concerning criteria like fuel <strong>consumption</strong>. Figure 1 confirms this status for <strong>the</strong> European<br />
market. Besides <strong>of</strong>fering best driving comfort, fuel <strong>consumption</strong> benefits <strong>of</strong> vehicles<br />
equipped with <strong>CVT</strong> averagely lie at 5 to 15% when compared to vehicles with stepped<br />
Automatic Transmissions (4/5/6AT) (3, 4, 5). Recently introduced vehicles like <strong>the</strong> 1.5 ltr<br />
Toyota Corolla Axio with <strong>CVT</strong> realise a 5.5% fuel <strong>consumption</strong> benefit compared with<br />
<strong>the</strong>ir manual counterpart (6). OEMs like Nissan and Toyota <strong>the</strong>refore use <strong>CVT</strong><br />
technology to <strong>of</strong>fer fuel <strong>consumption</strong> and environmental benefits to <strong>the</strong>ir customers.<br />
Moreover, <strong>CVT</strong> as a relatively new technology still can provide substantial gain in fuel<br />
<strong>consumption</strong> through minor hardware changes enabling it to maintain and extend its<br />
strong technological position for <strong>the</strong> future.<br />
Looking past <strong>the</strong> conventional driveline, <strong>the</strong> trend towards hybridization <strong>of</strong>fers new<br />
chances. Thanks to <strong>the</strong> integrated approach enabled by <strong>CVT</strong>, present hybrid drivelines<br />
like <strong>the</strong> Honda Civic IMA already show significant fuel <strong>consumption</strong> improvements<br />
without imposing restrictions on <strong>the</strong> level <strong>of</strong> comfort. The decrease <strong>of</strong> losses in <strong>the</strong><br />
hybrid driveline by electrification <strong>of</strong> <strong>CVT</strong> actuation components can add to <strong>the</strong> fuel<br />
<strong>consumption</strong> <strong>potential</strong> as found by <strong>the</strong> changes suggested for <strong>the</strong> conventional<br />
driveline. In <strong>the</strong> following <strong>the</strong>se changes will be discussed.<br />
2. Sources <strong>of</strong> loss in a <strong>CVT</strong><br />
In <strong>the</strong> conventional driveline <strong>the</strong> combustion engine presents <strong>the</strong> largest loss <strong>of</strong> energy.<br />
For typical automotive cycles about 76% <strong>of</strong> <strong>the</strong> energy content <strong>of</strong> <strong>the</strong> fuel is lost in <strong>the</strong><br />
engine (Figure 2). About 10% <strong>of</strong> this amount is related to idling. The <strong>CVT</strong> dissipates<br />
about 8%. Finally, 16% is used for vehicle propulsion.<br />
<strong>Fuel</strong><br />
100%<br />
NEDC<br />
Engine<br />
66.3%<br />
Engine idle<br />
9.8%<br />
Transmission<br />
8%<br />
To road<br />
15.9%<br />
Fig. 2. Calculation results (section 4) <strong>of</strong> energy losses for <strong>the</strong> NEDC cycle.<br />
For a given combustion engine <strong>the</strong> <strong>CVT</strong> can <strong>of</strong>fer an estimated fuel <strong>consumption</strong><br />
reduction <strong>of</strong> up to 7.0%. This is achieved by a 50% decrease <strong>of</strong> average power losses<br />
inside <strong>the</strong> transmission. To understand this <strong>potential</strong> we have to consider <strong>the</strong> main<br />
components.<br />
Figure 3 shows <strong>the</strong> lay-out <strong>of</strong> a prototype <strong>CVT</strong> developed by <strong>Bosch</strong>-VDT for a maximum<br />
engine torque <strong>of</strong> 250 Nm. This transmission currently is used as a research object on a<br />
test rig and vehicle level. It will be used for reference throughout this paper.<br />
2
The main components in <strong>the</strong> transmission are:<br />
1. Pump/hydraulic unit<br />
2. Torque converter (T/C)<br />
3. Pushbelt variator<br />
4. Drive-Neutral-Reverse (DNR) unit<br />
5. Final reduction<br />
3<br />
Low OD<br />
Fig. 3. Variator working principle and lay-out <strong>of</strong> <strong>the</strong> reference <strong>CVT</strong><br />
The losses inside <strong>the</strong> <strong>CVT</strong> are distributed over <strong>the</strong> main components according Figure<br />
4. In <strong>the</strong> following paragraphs <strong>the</strong>se specific losses will be discussed in detail.<br />
Engine<br />
100%<br />
NEDC<br />
Pump<br />
12%<br />
Primary<br />
pulley<br />
(engine side)<br />
Secondary<br />
pulley<br />
(road side)<br />
T/C<br />
4.7%<br />
Fig. 4. Calculation results (section 4) <strong>of</strong> energy losses <strong>of</strong> <strong>the</strong> <strong>CVT</strong> components for <strong>the</strong> NEDC cycle.<br />
Variator<br />
13.5%<br />
2.1. Torque converter<br />
In most <strong>CVT</strong>s a torque converter is applied. Despite cost and packaging drawbacks<br />
when compared with a clutch, its torque amplification and smoothness at launch<br />
provides preferred performance (4, 7). To improve efficiency a lock-up clutch locks <strong>the</strong><br />
torque converter above certain vehicle speeds. Optimization efforts aim at reducing<br />
losses by engaging <strong>the</strong> lock-up clutch as soon as possible. For some applications this is<br />
already feasible at 5 km/h (4). Fur<strong>the</strong>r optimizations focus on <strong>the</strong> idle condition.<br />
1<br />
2<br />
Tin, ωin<br />
3<br />
4<br />
5<br />
DNR+gears<br />
3.2%<br />
Tout, ωout<br />
To road<br />
66.6%<br />
Tout, ωout<br />
3
2.2. Pump<br />
The engine driven pump provides <strong>the</strong> hydraulic energy for automation and actuation <strong>of</strong><br />
<strong>the</strong> transmission. It delivers flow proportional to engine speed. The pump torque Tpump<br />
depends on <strong>the</strong> pressure drop over <strong>the</strong> pump ∆ppump, its displacement volume/capacity<br />
Vth and its hydro-mechanical efficiency ηhm as in Eq. 1. Pump capacity is determined by<br />
<strong>the</strong> flow Qpump required during an event like an emergency stop when <strong>the</strong> variator<br />
rapidly must shift from Overdrive (OD) to Low at a low pump speed npump.<br />
T<br />
pump<br />
∆p<br />
pump ⋅V<br />
=<br />
2<br />
⋅π<br />
⋅η<br />
Table 1 shows an example for <strong>the</strong> reference <strong>CVT</strong>. A second critical event is idle, during<br />
which pump speed is low and flows required for engaging a clutch can lead to shortage.<br />
The capacity <strong>of</strong> <strong>the</strong> pump is based on <strong>the</strong> maximum outcome <strong>of</strong> <strong>the</strong> critical events. It<br />
delivers a wasted surplus <strong>of</strong> oil under all o<strong>the</strong>r circumstances.<br />
Delivery<br />
Demand<br />
hm<br />
th<br />
→<br />
V<br />
th<br />
=<br />
n<br />
Q<br />
pump<br />
pump<br />
⋅η<br />
vol<br />
critical<br />
Emergency stop Idle Kickdown<br />
Engine/pump speed [rpm] 1200/1246 660/685 2400/2492<br />
Maximum pressure [bar] 80 25 80<br />
Volumetric efficiency pump [%] 74 88 91 94 84 93<br />
Variator shifting [ltr/min] 5.8 0 10<br />
Clutch engagement [ltr/min] 0 2 0<br />
Controls [ltr/min] 4 1.7 7<br />
Torque converter [ltr/min] 0 2.9 0<br />
Cooling & lubrication [ltr/min] 1.2 2.9 (from T/C) 2.5<br />
Result Pump displacement [cc/rev] 11.9 10.0 10.6 10.3 9.3 8.4<br />
Table 1. Reference <strong>CVT</strong> flow requirement and derived pump capacity (medium | good quality pump).<br />
At low pump speed and high pressure, pump quality in terms <strong>of</strong> volumetric efficiency ηvol<br />
is important (8). Table 1 includes an example <strong>of</strong> a 16% difference in pump capacity<br />
between a medium and good quality pump. This causes <strong>the</strong> critical event to switch from<br />
an emergency stop to idle. Pump capacity <strong>the</strong>reby reduces from 11.9 to 10.3 cc/rev<br />
which leads to a 0.8% fuel <strong>consumption</strong> benefit over <strong>the</strong> cycle. Each cubic centimetre <strong>of</strong><br />
pump capacity that can be spared roughly saves 0.5% <strong>of</strong> fuel.<br />
In a <strong>CVT</strong> <strong>the</strong> variator requires <strong>the</strong> highest pressure level. Clutch, torque converter and<br />
lubrication functions require lower pressure. The pump pressurises all oil to variator<br />
pressure first and <strong>the</strong>reby delivers a surplus <strong>of</strong> flow at a surplus <strong>of</strong> pressure for <strong>the</strong> o<strong>the</strong>r<br />
functions. In doing so it has a large impact on <strong>CVT</strong> efficiency.<br />
2.3. Variator<br />
The variator enables <strong>the</strong> <strong>CVT</strong> to steplessly change ratio between Low and OD. It<br />
consists <strong>of</strong> a metal <strong>pushbelt</strong> that runs over a primary and secondary pulley, each with a<br />
fixed and movable sheave. The movable sheaves are actuated by hydraulic pistons that<br />
provide clamping and ratio adjustment <strong>of</strong> <strong>the</strong> belt. Torque is transmitted by <strong>the</strong> friction<br />
between belt and pulley.<br />
The belt contains about 400 elements <strong>of</strong> approximately 1.8 mm thickness supported by<br />
two sets <strong>of</strong> 9 to 12 rings. The large number <strong>of</strong> elements leads to a smooth and<br />
continuous running. In operation, clamping forces and torques work on <strong>the</strong> belt and<br />
result in <strong>the</strong> following sources <strong>of</strong> loss.<br />
• Bearing losses in <strong>the</strong> bearings <strong>of</strong> <strong>the</strong> primary and secondary variator shaft<br />
• Friction losses between element and pulley<br />
• Internal belt friction<br />
(1)<br />
4
Figure 5 shows <strong>the</strong> axial clamping force on <strong>the</strong> elements to result in a radial component<br />
that is supported by <strong>the</strong> rings. The sum <strong>of</strong> radial forces exerted by <strong>the</strong> elements on <strong>the</strong><br />
pulley is supported by <strong>the</strong> pulley shaft bearings and leads to bearing losses. Losses<br />
between elements and pulley follow from relatively small amounts <strong>of</strong> slip in <strong>the</strong> contact.<br />
Elements and rings rotate at different radii at <strong>the</strong> pulleys, causing a relative velocity<br />
between elements and inner rings and between <strong>the</strong> rings <strong>the</strong>mselves. This relative<br />
velocity leads to internal belt losses.<br />
The clamping force is <strong>the</strong> main initiator for <strong>the</strong> level <strong>of</strong> losses <strong>of</strong> <strong>the</strong>se three<br />
phenomena. A reduction <strong>of</strong> <strong>the</strong> clamping force leads to a reduction <strong>of</strong> <strong>the</strong> losses as<br />
illustrated in figure 5.<br />
Fclamp<br />
Fig. 5. Forces working in <strong>the</strong> plane <strong>of</strong> <strong>the</strong> element on <strong>the</strong> elements and rings in <strong>the</strong> <strong>pushbelt</strong>.<br />
The clamping force Fclamp depends on <strong>the</strong> primary torque Tpri, <strong>the</strong> pulley angle λ, <strong>the</strong><br />
primary running radius <strong>of</strong> <strong>the</strong> belt rpri and <strong>the</strong> coefficient <strong>of</strong> friction µ between belt and<br />
pulley. Some parameters are not exactly known. The primary torque and <strong>the</strong> coefficient<br />
<strong>of</strong> friction are rough estimations. Also <strong>the</strong> torque disturbances coming from <strong>the</strong> road are<br />
unknown. In order to deal with <strong>the</strong> inaccuracies and disturbances, a safety Sf on <strong>the</strong><br />
clamping force is used as in Eq. 2.<br />
F<br />
clamp<br />
=<br />
{ ( S − ) ⋅T<br />
+ T } ⋅ cos(<br />
λ)<br />
S ⋅T<br />
⋅ cos(<br />
λ)<br />
f . abs<br />
F<br />
1 max pri<br />
f . rel<br />
2 ⋅ r<br />
ring<br />
pri<br />
⋅ µ<br />
F<br />
ring<br />
F F<br />
=<br />
2 ⋅ r<br />
pri<br />
pri<br />
Effect <strong>of</strong> 50% reduction<br />
<strong>of</strong> clamping force<br />
The currently applied absolute safety strategy Sf.abs =1.3 adds 30% <strong>of</strong> <strong>the</strong> maximum<br />
engine torque to <strong>the</strong> primary torque over <strong>the</strong> entire torque range. At low torque <strong>the</strong><br />
relative safety Sf.rel that uses <strong>the</strong> primary torque as a reference reaches much higher<br />
values. The minimum clamping force as enforced by <strong>the</strong> minimum pressure in <strong>the</strong><br />
hydraulic circuit can also increase safety at low torque. Figure 6 shows <strong>the</strong> clamping<br />
force requirement at 1500 rpm in OD with an absolute safety Sf.abs=1.3 and optimal<br />
relative safety Sf.rel =1. In this case <strong>the</strong> clamping force for <strong>the</strong> optimal strategy is limited<br />
by <strong>the</strong> minimum clamping force. In <strong>the</strong> NEDC cycle <strong>the</strong> time-share during which this<br />
limitation is present is large.<br />
Secondary clamping force [kN]<br />
Clamping force<br />
16<br />
relative safety 1.0 unrestricted<br />
NEDC cycle<br />
40<br />
14 absolute safety strategy Sf = 1.3<br />
relative safety strategy Sf = 1.0<br />
35<br />
12<br />
30<br />
10<br />
8<br />
6<br />
4<br />
2<br />
0 20 40 60 80 100 120 140 160 180 0<br />
0<br />
Engine torque [Nm]<br />
25<br />
20<br />
15<br />
10<br />
5<br />
Time share NEDC cycle [%]<br />
Fig. 6. Clamping force and safety for strategies Sf=1.3 and Sf=1.0 at 1500 rpm in OD. The histogram<br />
shows <strong>the</strong> distribution <strong>of</strong> engine torque over <strong>the</strong> NEDC cycle (histogram).<br />
F clamp<br />
⋅ µ<br />
Relative safety S f.rel [-]<br />
Fclamp<br />
Fradial<br />
Fring<br />
F ring<br />
(2)<br />
Fradial<br />
Safety<br />
8<br />
NEDC cycle<br />
40<br />
absolute safety strategy Sf = 1.3<br />
7<br />
relative safety strategy Sf = 1.0<br />
35<br />
6<br />
5<br />
4<br />
3<br />
2<br />
1<br />
0 20 40 60 80 100 120 140 160 180 0<br />
0<br />
Engine torque [Nm]<br />
30<br />
25<br />
20<br />
15<br />
10<br />
5<br />
F clamp<br />
Time share NEDC cycle [%]<br />
5
Safety affects variator efficiency. Figure 7 shows this relationship as measured for<br />
several variator ratios. The results have been used to verify <strong>the</strong> loss breakdown for <strong>the</strong><br />
components <strong>of</strong> <strong>the</strong> variator over three cycles. About 55% is lost in <strong>the</strong> contact between<br />
belt and pulley. Belt internal losses account for 25%. The bearings consume 20%.<br />
Variator efficiency [%]<br />
100<br />
Fig. 7. Variator efficiency as a function <strong>of</strong> relative safety at 1500 rpm (measurement result test rig).<br />
Breakdown <strong>of</strong> variator losses for several cycles (simulation result).<br />
Besides safety, losses in <strong>the</strong> contact between belt and pulley are influenced by design<br />
properties <strong>of</strong> <strong>the</strong> variator like <strong>the</strong> play between <strong>the</strong> fixed and movable sheave and <strong>the</strong><br />
axial pulley stiffness. Both properties influence <strong>the</strong> amount <strong>of</strong> slip in <strong>the</strong> contact (9).<br />
2.4. Hydraulic circuit<br />
The hydraulic circuit directs actuation power from <strong>the</strong> pump to <strong>the</strong> <strong>CVT</strong> functions. The<br />
sub-circuit <strong>of</strong> <strong>the</strong> variator has an important influence on power losses. The two most<br />
commonly used circuits are shown in Figure 8. The dependent and independent<br />
pressure circuit typically are integrated in a cascade system where <strong>the</strong> variator is<br />
prioritized over an auxiliary pressure level that supplies <strong>the</strong> DNR and lock-up, and a<br />
lubrication pressure level used for cooling and lubrication. At present <strong>the</strong> reference <strong>CVT</strong><br />
is fitted with a dependent pressure circuit. Measures have been taken to enable<br />
adaptation to <strong>the</strong> characteristics <strong>of</strong> an independent pressure circuit.<br />
In <strong>the</strong> dependent circuit, secondary pressure equals pump pressure. The primary<br />
pressure is derived from secondary pressure and can not rise above this level. The<br />
occasionally large primary/secondary force ratio requirement (FpFs) <strong>of</strong> <strong>the</strong> variator puts<br />
a constraint on <strong>the</strong> primary piston area which for that reason needs to be about a factor<br />
2.4 larger than <strong>the</strong> secondary piston area. The fact that <strong>the</strong> minimum pressure can not<br />
get below auxiliary pressure is a second restriction to <strong>the</strong> achievable span <strong>of</strong> control.<br />
secondary<br />
auxiliary<br />
lubrication<br />
Ratio Low<br />
Ratio Medium<br />
Ratio OD<br />
0 2 4 6 8 10 0<br />
0<br />
Relative safety S [-]<br />
f.rel<br />
primary<br />
Apri<br />
Asec = 2.4<br />
1<br />
secondary<br />
Fig. 8. Dependent (left) and independent pressure circuit.<br />
Apri<br />
Asec<br />
40<br />
35<br />
30<br />
25<br />
20<br />
15<br />
10<br />
5<br />
Time share NEDC cycle [%]<br />
Cycle<br />
NEDC<br />
10-15<br />
FTP72<br />
line<br />
auxiliary<br />
lubrication<br />
Bearings<br />
Element-pulley contact<br />
Belt internal<br />
0 500<br />
Average power loss [Watt]<br />
1000<br />
Apri<br />
Asec<br />
primary<br />
=<br />
secondary<br />
1<br />
1<br />
Apri<br />
1.7<br />
to<br />
1<br />
Asec<br />
6
These constraints do not apply to <strong>the</strong> independent pressure circuit. Both piston<br />
pressures can assume highest pressure which facilitates variator control. As each<br />
piston can be connected to sump, <strong>the</strong> pressures can be reduced to relatively low values<br />
<strong>of</strong> 1 to 2 bar (10) which enlarges <strong>the</strong> span <strong>of</strong> control even fur<strong>the</strong>r.<br />
A disadvantage <strong>of</strong> <strong>the</strong> independent pressure circuit is <strong>the</strong> filling <strong>of</strong> <strong>the</strong> primary piston<br />
when shifting towards OD. Unlike <strong>the</strong> dependent circuit, <strong>the</strong> secondary piston does not<br />
return flow. The pump must supply <strong>the</strong> entire flow. To realise a shift speed that equals<br />
<strong>the</strong> shift speed <strong>of</strong> <strong>the</strong> dependent circuit, <strong>the</strong> primary piston area must be reduced. This<br />
raises primary pressure above secondary pressure near OD. The pump must supply<br />
this higher pressure plus <strong>the</strong> <strong>of</strong>fset pressure between <strong>the</strong> line and variator pressure.<br />
Both increase pump losses.<br />
The ability to control low clamping forces is important for fuel <strong>consumption</strong>. As shown in<br />
Figure 6, a high minimum clamping force causes a safety increase at low torque. The<br />
minimum clamping force depends on <strong>the</strong> achievable minimum variator pressure and on<br />
<strong>the</strong> piston area. A small piston area decreases <strong>the</strong> minimum clamping force but leads to<br />
a high maximum piston pressure at maximum torque. The limitation <strong>of</strong> maximum circuit<br />
pressure for reasons <strong>of</strong> leakage <strong>the</strong>refore results in a lower limit for <strong>the</strong> piston area.<br />
2.5. DNR unit - Torque fuse<br />
The DNR unit <strong>of</strong> <strong>the</strong> reference <strong>CVT</strong> is located at <strong>the</strong> road side <strong>of</strong> <strong>the</strong> variator. It consists<br />
<strong>of</strong> a planetary gear set with a drive clutch and a reverse brake. In Drive, <strong>the</strong> drag loss <strong>of</strong><br />
<strong>the</strong> disengaged brake is a typical loss.<br />
Usually <strong>the</strong> DNR unit is positioned at <strong>the</strong> engine side <strong>of</strong> <strong>the</strong> variator. Locating it at <strong>the</strong><br />
road side introduces a fuel <strong>consumption</strong> advantage. By using <strong>the</strong> drive clutch as a<br />
torque fuse, torque peaks from <strong>the</strong> road no longer can reach <strong>the</strong> variator. Variator safety<br />
can be lowered which increases variator efficiency and reduces required pump power.<br />
For <strong>the</strong> reference <strong>CVT</strong> a 2.1% reduction <strong>of</strong> fuel <strong>consumption</strong> over <strong>the</strong> NEDC cycle has<br />
been measured. The torque fuse concept currently is applied in <strong>the</strong> Mercedes-Benz<br />
A-class and B-class vehicles where a reduction <strong>of</strong> 2.7% has been reported (11).<br />
3. Potential for fuel <strong>consumption</strong> improvement<br />
In <strong>the</strong> previous section it was shown that <strong>the</strong> variator and <strong>the</strong> actuation system are<br />
primarily responsible for <strong>the</strong> losses inside <strong>the</strong> <strong>CVT</strong>. The concepts for <strong>the</strong> reduction <strong>of</strong><br />
power losses are based on <strong>the</strong> following wishes:<br />
• reduction <strong>of</strong> slip losses and friction losses in <strong>the</strong> variator<br />
• reduction <strong>of</strong> required actuation power<br />
• improved balance between demanded and provided actuation power<br />
• more efficient generation <strong>of</strong> actuation power<br />
In this section <strong>the</strong> following measures will be discussed.<br />
• measures inside <strong>the</strong> variator by <strong>the</strong> reduction <strong>of</strong> clamping force/safety<br />
• measures to improve <strong>the</strong> hydraulic circuit<br />
3.1. Control strategy - reduction <strong>of</strong> clamping force / safety<br />
The reduction <strong>of</strong> variator losses is primarily achieved by <strong>the</strong> reduction <strong>of</strong> clamping force.<br />
The optimal strategy can be realised by applying new insights showing that <strong>the</strong> <strong>pushbelt</strong><br />
is able to withstand substantial amounts <strong>of</strong> slip over a long period <strong>of</strong> time without<br />
significant wear (12). The limits for excessive wear depend on <strong>the</strong> slip speed and<br />
7
Element normal force [N]<br />
clamping force settings as shown in Figure 9. Based on this insight a new control<br />
system has been designed and implemented in <strong>the</strong> reference <strong>CVT</strong>. The system uses<br />
<strong>the</strong> slip between belt and pulley as <strong>the</strong> control parameter.<br />
Slip is determined by comparing <strong>the</strong> geometrical ratio with <strong>the</strong> speed ratio <strong>of</strong> <strong>the</strong><br />
variator. The geometrical ratio can be reconstructed from a measured geometrical<br />
variator characteristic.<br />
In <strong>the</strong> reference <strong>CVT</strong> <strong>the</strong> running radius <strong>of</strong> <strong>the</strong> <strong>pushbelt</strong> at <strong>the</strong> primary pulley is<br />
measured. From literature also <strong>the</strong> measurement <strong>of</strong> <strong>the</strong> axial position <strong>of</strong> one <strong>of</strong> <strong>the</strong><br />
movable pulley sheaves is known (13).<br />
800<br />
700<br />
600<br />
500<br />
400<br />
300<br />
200<br />
100<br />
Primary speed n p =1500[rpm]<br />
Low OD<br />
Safe region<br />
Unsafe region<br />
Low failure line<br />
OD failure line<br />
current area OD<br />
new area OD<br />
0<br />
0 2 4 6<br />
Slip speed [m/s]<br />
8 10 12<br />
Current feedback control strategy<br />
Setpoint<br />
generation<br />
Clamping<br />
force<br />
controller<br />
Variator<br />
hydraulics<br />
Fig. 9. F/v diagram with experimentally determined slip limits for a 24/9 <strong>pushbelt</strong> at 1500 rpm<br />
and current and new control strategy.<br />
The slip is controlled by a Single Input-Single Output (SISO) controller that adjusts <strong>the</strong><br />
secondary piston pressure based on <strong>the</strong> slip error. The set-point for slip is chosen at <strong>the</strong><br />
optimal variator efficiency.<br />
Presently only <strong>the</strong> secondary piston is used to control slip which disables <strong>the</strong> controller<br />
to take <strong>the</strong> interaction between variator ratio and slip into account. Due to this limitation,<br />
slip control is only active during 34% to 50% <strong>of</strong> <strong>the</strong> time share <strong>of</strong> <strong>the</strong> evaluated cycles.<br />
The remaining time <strong>the</strong> controller applies conventional control at a reduced safety level.<br />
During idle, slip control is not active because <strong>the</strong> speed ratio can not be detected.<br />
Instead, <strong>the</strong> safety is reduced based on <strong>the</strong> estimated engine torque.<br />
The reference <strong>CVT</strong> was installed in a Mercedes-Benz A190. Certified fuel <strong>consumption</strong><br />
measurements were performed for several cycles. Reductions between <strong>the</strong> current<br />
strategy with absolute safety Sf.abs=1.3 and <strong>the</strong> new strategy are listed in Table 2.<br />
Europe Japan U.S.A. Constant speed<br />
Cycles ECE EUDC NEDC 10-15 Phase Phase FTP72 50 100<br />
1 2<br />
km/h km/h<br />
<strong>Fuel</strong> <strong>consumption</strong> reduction 5.9% 4.3% 5.0% 5.2% 5.3% 5.5% 5.5% 5.7% 6.7%<br />
Average clamping force decrease 47% 52% 49% 46% 44% 46% 45% 69% 57%<br />
Time share slip control active 35% 79% 50% 34% 52% 46% 48% 100% 100%<br />
Time share idle 31% 10% 24% 32% 19% 17% 18% 0% 0%<br />
Table 2. <strong>Fuel</strong> <strong>consumption</strong> reductions for several cycles from certified measurements (TNO).<br />
est<br />
Rp est<br />
Tp<br />
est<br />
i0 ...<br />
i0<br />
...<br />
Setpoint<br />
generation<br />
The new control strategy leads to considerable fuel <strong>consumption</strong> reductions <strong>of</strong> 5% to<br />
6.7%, values that match with previous calculations (12). For larger engines even more<br />
improvement is expected. The results are also anticipated to rise fur<strong>the</strong>r in case slip<br />
control is expanded over <strong>the</strong> full cycle. Activities are undertaken to develop a Multi<br />
Input-Multi Output (MIMO) control that takes <strong>the</strong> interaction between ratio and slip into<br />
account. Parallel activities focus on <strong>the</strong> development <strong>of</strong> a robust sensor to detect slip.<br />
Fax<br />
set<br />
+ -<br />
New feedback control strategy<br />
+<br />
-<br />
F ax<br />
Variator<br />
slip?<br />
Slipset F Clamping<br />
ax<br />
slip<br />
Variator<br />
force<br />
Variator<br />
hydraulics<br />
controller<br />
8
For <strong>the</strong> variator, developments include a more detailed investigation <strong>of</strong> <strong>the</strong> operational<br />
area <strong>of</strong> <strong>the</strong> <strong>pushbelt</strong>. For <strong>the</strong> hydraulic circuit, measures must be taken to satisfy control<br />
requirements, like an increase <strong>of</strong> <strong>the</strong> clamping force range and improved response.<br />
The combined efforts create a more robust control system in which <strong>the</strong> influence <strong>of</strong><br />
unknown parameters and disturbances is minimised. The critical parameter <strong>of</strong> slip will<br />
be known for all situations and provide a higher degree <strong>of</strong> robustness for <strong>the</strong> <strong>pushbelt</strong><br />
variator and <strong>the</strong> <strong>CVT</strong>.<br />
3.2. Fur<strong>the</strong>r measures inside <strong>the</strong> variator<br />
Besides <strong>the</strong> reduction <strong>of</strong> safety, <strong>the</strong> decrease <strong>of</strong> <strong>the</strong> internal losses <strong>of</strong> <strong>the</strong> <strong>pushbelt</strong> is a<br />
second measure in <strong>the</strong> variator. Efforts are undertaken to reduce <strong>the</strong>se losses. Benefits<br />
however are limited. The <strong>the</strong>oretical situation where <strong>the</strong> internal losses <strong>of</strong> <strong>the</strong> belt are<br />
reduced to zero achieves a maximum reduction <strong>of</strong> fuel <strong>consumption</strong> <strong>of</strong> 0.8% to 1% for<br />
<strong>the</strong> usual cycles. This result decreases in case <strong>the</strong> present control strategy is replaced<br />
by <strong>the</strong> new control strategy.<br />
3.3. Hydraulic circuit<br />
The pump typically delivers a surplus <strong>of</strong> flow at a surplus <strong>of</strong> pressure. The following<br />
concepts reduce <strong>the</strong> power demand by more dedicated hydraulic circuits.<br />
3.3.1. Smart independent pressure circuit<br />
As stated earlier, <strong>the</strong> independent pressure circuit has certain advantages over <strong>the</strong><br />
dependent pressure circuit. The <strong>of</strong>fset between pump and variator pressure is a<br />
disadvantage. In an optimal setting this line pressure <strong>of</strong>fset is reduced to zero in case<br />
<strong>the</strong> highest piston pressure always is controlled by <strong>the</strong> line pressure valve. In <strong>the</strong><br />
transition point <strong>the</strong> line pressure valve switches control between <strong>the</strong> piston pressures.<br />
The lower pressure is controlled by <strong>the</strong> respective piston valve. The results <strong>of</strong> this<br />
improvement are shown in Figure 10.<br />
For <strong>the</strong> reference <strong>CVT</strong> this measure leads to a fuel <strong>consumption</strong> reduction over <strong>the</strong><br />
relevant cycles <strong>of</strong> about 0.25% for each bar that <strong>the</strong> pressure <strong>of</strong>fset can be reduced.<br />
The concept does not require any hardware changes as can be seen in Figure 11.<br />
Cylinder pressure [-]<br />
40<br />
35<br />
30<br />
25<br />
20<br />
15<br />
10<br />
5<br />
p sec , Sf abs = 1.3<br />
p pri , Sf abs = 1.3<br />
p line , Sf abs = 1.3<br />
p sec , Sf rel = 1.0<br />
p pri , Sf rel = 1.0<br />
p line , Sf rel = 1.0<br />
A pri /A sec = 1.40<br />
0<br />
0.5 1 1.5<br />
Variator ratio [-]<br />
2 2.5<br />
0<br />
0.5 1 1.5<br />
Variator ratio [-]<br />
2 2.5<br />
Fig. 10. Pressures independent and improved independent circuit (right) at an engine speed<br />
and torque <strong>of</strong> 1500 rpm and 40 Nm. Minimum (line) pressure is 6 bar.<br />
3.3.2. Electrically powered pump placed in series with <strong>the</strong> main pump<br />
In this concept, shown in Figure 11, an electrically powered pump (E-pump) is used to<br />
supply <strong>the</strong> variator. The main pump supplies oil at auxiliary pressure which typically is a<br />
factor 5 lower than variator pressure. Required pump power is almost linearly<br />
dependent on pump pressure and <strong>the</strong>refore also reduces by this number.<br />
Cylinder pressure [-]<br />
40<br />
35<br />
30<br />
25<br />
20<br />
15<br />
10<br />
5<br />
p sec , Sf abs = 1.3<br />
p pri , Sf abs = 1.3<br />
p line , Sf abs = 1.3<br />
p sec , Sf rel = 1.0<br />
p pri , Sf rel = 1.0<br />
p line , Sf rel = 1.0<br />
Transition point<br />
A pri /A sec = 1.40<br />
9
secondary/<br />
primary<br />
auxiliary<br />
lubrication<br />
primary<br />
secondary<br />
auxiliary/<br />
line<br />
auxiliary<br />
lubrication<br />
Fig. 11. Smart independent pressure circuit (left) and circuit with second electrically powered pump.<br />
During most cycles, <strong>the</strong> hydraulic power demand to <strong>the</strong> E-pump is low due to <strong>the</strong> limited<br />
flow requirement <strong>of</strong> <strong>the</strong> variator. This positive effect is reduced by <strong>the</strong> low efficiency <strong>of</strong><br />
<strong>the</strong> electric drive that increases <strong>the</strong> electric power need.<br />
In situations where <strong>the</strong> electric power need surpasses <strong>the</strong> installed electric motor power,<br />
<strong>the</strong> electric motor is supported by an increase <strong>of</strong> <strong>the</strong> main pump pressure. This reduces<br />
<strong>the</strong> pressure drop over <strong>the</strong> E-pump and keeps <strong>the</strong> electric power demand low. The Emotor<br />
can <strong>the</strong>refore be limited to a nominal power <strong>of</strong> less than 250W.<br />
The E-pump disconnects <strong>the</strong> variator flow requirement from engine speed while <strong>the</strong><br />
main flow is no longer pressurised at <strong>the</strong> highest pressure level in <strong>the</strong> <strong>CVT</strong>. These<br />
effects cause a significant reduction <strong>of</strong> actuation power. Calculations show a 2.4%<br />
reduction in fuel <strong>consumption</strong> for a conventional actuation strategy. For <strong>the</strong> slip control<br />
strategy this effect reduces to 1%.<br />
The E-pump is an add-on component and as such increases system cost. In order to<br />
extend its functionality it can be included in a start-stop feature.<br />
3.3.3. Start-stop<br />
Start-stop systems <strong>of</strong>fer a large fuel <strong>consumption</strong> benefit and already are available in<br />
<strong>CVT</strong> equipped vehicles (14). For cycles with a large standstill share, like <strong>the</strong> Japanese<br />
10-15 cycle, fuel <strong>consumption</strong> benefits for <strong>the</strong> test vehicle are calculated to lie at 12.1%.<br />
For <strong>the</strong> NEDC cycle this value is 5.9%. The results are based on <strong>the</strong> assumption that an<br />
engine start requires a fuel quantity, equivalent to ten seconds <strong>of</strong> idling.<br />
3.3.4. De-clutch at rest<br />
When <strong>the</strong> drive clutch remains engaged during standstill, <strong>the</strong> variator pressure stays<br />
high to support <strong>the</strong> torque from <strong>the</strong> slipping torque converter. The engine consumes fuel<br />
to compensate for torque converter and oil pump losses. Disengagement <strong>of</strong> <strong>the</strong> clutch<br />
during standstill reduces torque converter losses but also enables <strong>the</strong> reduction <strong>of</strong><br />
variator pressure and related pump losses. For <strong>the</strong> NEDC cycle, de-clutch at rest, or<br />
neutral control, is measured and calculated to reduce fuel <strong>consumption</strong> by 1.6%.<br />
In some <strong>CVT</strong> applications, de-clutch at rest is already applied (15).<br />
E-pump<br />
4. Results<br />
The discussed concepts for improving fuel <strong>consumption</strong> have resulted in a research<br />
program incorporating measurements and simulations. All measurements were<br />
performed in an A190 A-class vehicle with 180 Nm maximum engine torque combined<br />
with <strong>the</strong> reference <strong>CVT</strong>.<br />
E<br />
line<br />
primary<br />
secondary<br />
10
The <strong>CVT</strong> was fitted with sensors for measuring output torque <strong>of</strong> <strong>the</strong> <strong>CVT</strong>, pressures in<br />
<strong>the</strong> hydraulic circuit and shaft speeds. The measured signals were used as input for a<br />
<strong>CVT</strong> model that included component models <strong>of</strong> pump, torque converter, variator and<br />
final stage. These models were verified on test rig level. With <strong>the</strong> <strong>CVT</strong> model <strong>the</strong> engine<br />
torque could be calculated. An engine map enabled fuel <strong>consumption</strong> calculations and<br />
made a comparison between measured and calculated values possible. For <strong>the</strong><br />
evaluated cycles and constant speeds it was found that measurement and calculation<br />
showed satisfactory resemblance to use <strong>the</strong> model for <strong>the</strong> evaluation <strong>of</strong> new concepts.<br />
By altering <strong>the</strong> <strong>CVT</strong> model <strong>the</strong> impact <strong>of</strong> <strong>the</strong> discussed concepts for improvement could<br />
be assessed. The fuel <strong>consumption</strong> results <strong>of</strong> this assessment are shown in Table 3 and<br />
Figure 12. Some <strong>of</strong> <strong>the</strong>se results have already been addressed in <strong>the</strong> previous sections.<br />
Figure 12 shows <strong>the</strong> calculation results for <strong>the</strong> power losses <strong>of</strong> <strong>the</strong> main components.<br />
The numbers between brackets represent <strong>the</strong> fuel <strong>consumption</strong> results <strong>of</strong> Table 3.<br />
Individual concepts Combined concepts<br />
Features A B C D E F G H I J K L<br />
Conventional / reference M<br />
Torque fuse M<br />
Slip control M S S S S<br />
No internal belt losses S S<br />
Reduced pump capacity (-1.6 cc/rev) S<br />
Series E-pump system S S S S<br />
De-clutch at rest M/S S<br />
Start-stop (engine related) S S<br />
<strong>Fuel</strong> <strong>consumption</strong> improvement [%] Individual concepts Combined concepts<br />
NEDC cycle Europe 0.0 2.1 5.0 1.0 0.8 2.4 1.6 5.9 5.8 5.8 7.0 11.5<br />
10-15 cycle Japan 0.0 n.a. 5.2 0.8 0.8 2.6 2.8 12.1 5.5 6.2 8.4 17.8<br />
FTP72 cycle U.S.A. 0.0 n.a. 5.5 0.8 0.8 2.6 1.6 3.7 5.8 6.5 7.5 9.5<br />
Table 3. Concepts for fuel <strong>consumption</strong> reduction evaluated by measurement (M) and simulation (S).<br />
The results show that from <strong>the</strong> measures inside <strong>the</strong> <strong>CVT</strong>, slip control <strong>of</strong>fers <strong>the</strong> largest<br />
<strong>potential</strong> for fuel <strong>consumption</strong> reduction as it affects both variator and actuation losses.<br />
The reduced pressure requirement however decreases <strong>the</strong> <strong>potential</strong> <strong>of</strong> measures inside<br />
<strong>the</strong> hydraulic system and <strong>the</strong> variator. The <strong>potential</strong> <strong>of</strong> <strong>the</strong> series E-pump system is for<br />
example reduced from 2.4 to 0.8%. The <strong>potential</strong> <strong>of</strong> de-clutch at rest is less affected by<br />
slip control as it predominantly tackles torque converter losses.<br />
The optimisation <strong>of</strong> <strong>the</strong> internal losses <strong>of</strong> <strong>the</strong> <strong>pushbelt</strong> shows limited <strong>potential</strong> and does<br />
not affect <strong>the</strong> o<strong>the</strong>r system components. A measure like start-stop that lies outside <strong>the</strong><br />
<strong>CVT</strong> <strong>of</strong>fers a <strong>potential</strong> <strong>of</strong> 3.7 to 12.1%.<br />
Concept<br />
A<br />
C<br />
D<br />
E<br />
F<br />
G<br />
H<br />
I<br />
J<br />
K<br />
L<br />
NEDC cycle<br />
(93.0 [%])<br />
(88.5 [%])<br />
(95.0 [%])<br />
(94.2 [%])<br />
(94.2 [%])<br />
(94.1 [%])<br />
(97.6 [%])<br />
(98.4 [%])<br />
(100.0 [%])<br />
(99.0 [%])<br />
(99.2 [%])<br />
Concept<br />
Pump<br />
Torque converter<br />
Variator<br />
DNR + gears<br />
0 500 1000 1500 2000 2500<br />
Average power loss [Watt]<br />
A<br />
C<br />
D<br />
E<br />
F<br />
G<br />
H<br />
I<br />
J<br />
K<br />
L<br />
(91.6 [%])<br />
(82.2 [%])<br />
10-15 cycle<br />
(94.8 [%])<br />
(87.9 [%])<br />
(94.5 [%])<br />
(93.8 [%])<br />
(97.4 [%])<br />
(97.2 [%])<br />
(100.0 [%])<br />
(99.2 [%])<br />
(99.2 [%])<br />
Pump<br />
Torque converter<br />
Variator<br />
DNR + gears<br />
0 500 1000 1500 2000 2500<br />
Average power loss [Watt]<br />
0 500 1000 1500 2000 2500<br />
Average power loss [Watt]<br />
Fig. 12. Power losses, fuel <strong>consumption</strong> results (between brackets) for NEDC, 10-15 and FTP72 cycle.<br />
Concept<br />
A<br />
C<br />
D<br />
E<br />
F<br />
G<br />
H<br />
I<br />
J<br />
K<br />
L<br />
FTP72 cycle<br />
(93.5 [%])<br />
(92.5 [%])<br />
(90.5 [%])<br />
(94.5 [%])<br />
(96.3 [%])<br />
(94.2 [%])<br />
(99.2 [%])<br />
(99.2 [%])<br />
(97.4 [%])<br />
(98.4 [%])<br />
(100.0 [%])<br />
Pump<br />
Torque converter<br />
Variator<br />
DNR + gears<br />
11
A combination <strong>of</strong> <strong>the</strong> measures slip control, series E-pump and start-stop ultimately<br />
leads to fuel <strong>consumption</strong> reductions <strong>of</strong> up to 11.5% for <strong>the</strong> NEDC and 17.8% for <strong>the</strong><br />
10-15 cycle. The E-pump required for start-stop is usefully applied to also enhance <strong>the</strong><br />
reduction <strong>of</strong> fuel <strong>consumption</strong> while driving.<br />
From Figure 12 it is clear that <strong>the</strong> optimisation features all target <strong>the</strong>ir specific<br />
component. The E-pump system only influences pump losses. De-clutch at rest and<br />
start-stop target torque converter and pump losses during standstill. Slip control targets<br />
all losses with exception <strong>of</strong> <strong>the</strong> losses <strong>of</strong> <strong>the</strong> torque converter. Obviously a combination<br />
<strong>of</strong> <strong>the</strong>se features <strong>of</strong>fers <strong>the</strong> largest <strong>potential</strong>.<br />
The optimisations lead to a reduced torque demand to <strong>the</strong> engine which results in a<br />
drop in engine efficiency. Fur<strong>the</strong>r fuel <strong>consumption</strong> reductions can be achieved in case<br />
<strong>the</strong> <strong>CVT</strong> and engine control are approached integrally. This remains a topic for fur<strong>the</strong>r<br />
investigation.<br />
5. CONCLUSIONS<br />
• <strong>Fuel</strong> <strong>consumption</strong> data from <strong>the</strong> Japanese and European market show that vehicles<br />
equipped with a <strong>CVT</strong> based on <strong>the</strong> <strong>pushbelt</strong> principle currently prove to be excellent<br />
performing applications.<br />
• The <strong>pushbelt</strong> <strong>CVT</strong> still <strong>of</strong>fers a large <strong>potential</strong> for <strong>the</strong> reduction <strong>of</strong> fuel <strong>consumption</strong><br />
by <strong>the</strong> introduction <strong>of</strong> features like slip control, an improved hydraulic actuation<br />
system and de-clutch at rest or start-stop.<br />
• The concept <strong>of</strong> slip control has been implemented in a prototype <strong>pushbelt</strong> <strong>CVT</strong> that<br />
was installed in a vehicle with a 1.9 ltr gasoline engine.<br />
• <strong>Fuel</strong> <strong>consumption</strong> <strong>of</strong> this vehicle has been measured. A comparison with <strong>the</strong><br />
identical <strong>CVT</strong> with conventional control shows a 5.0, 5.2 and 5.5% reduction <strong>of</strong> fuel<br />
<strong>consumption</strong> for <strong>the</strong> NEDC, 10-15, and FTP72 cycle respectively.<br />
• Improvements to <strong>the</strong> actuation system are calculated to fur<strong>the</strong>r raise <strong>the</strong>se<br />
measurement results towards a fuel <strong>consumption</strong> reduction <strong>of</strong> 8.4%, incorporating<br />
measures like an electrically driven support pump and de-clutch at rest.<br />
• An electrically driven support pump optionally enables start-stop functionality. When<br />
combined with slip control this leads to fuel <strong>consumption</strong> benefits <strong>of</strong> 11.5% for <strong>the</strong><br />
NEDC and 17.8% for <strong>the</strong> 10-15 cycle.<br />
• Future work focuses on expanding <strong>the</strong> operational area <strong>of</strong> slip control and on <strong>the</strong><br />
practical realization <strong>of</strong> this feature towards production.<br />
References<br />
(1) Van Schaik, Marco, “New Phase 7 <strong>pushbelt</strong> design to cover all FWD<br />
applications”, CTI congress Paris, 2005<br />
(2) Ishida, Shigeo, “Recent innovations in transmission development”, Keynote<br />
presentation 4 th CTI congress, Berlin 2005<br />
(3) Van der Sluis, Francis et al., “<strong>Fuel</strong> economy <strong>potential</strong> <strong>of</strong> <strong>the</strong> <strong>pushbelt</strong> <strong>CVT</strong>”,<br />
paper Fisita 2006 congress, Yokohama 2006<br />
(4) Yamamoto, Masahiro et al., “Hydraulic system, shift and lock-up clutch controls<br />
developed for a large torque capacity <strong>CVT</strong>”, paper 04<strong>CVT</strong>-07, <strong>CVT</strong> congress,<br />
2004<br />
12
(5) Maeder, Klaus-Martin, “Continuously Variable Transmission: Benchmark, status<br />
and <strong>potential</strong>s”, Keynote presentation 4 th CTI congress, Berlin 2005.<br />
(6) Toyota website, http://toyota.jp/corollaaxio/spec/spec/index.html<br />
(7) Ohashi et al., “Development <strong>of</strong> high-efficiency <strong>CVT</strong> for luxury compact vehicle”,<br />
SAE paper 2005-01-1019, SAE 2005<br />
(8) Van der Sluis, Francis, “A new pump for <strong>CVT</strong> applications”, SAE paper 2003-01-<br />
3207, SAE 2003<br />
(9) Sue, Armin, “Betriebsverhalten stufenloser Umschlingungsgetrieben<br />
unterEinfluss von Kippspiel und Verformungen”, Dissertation University <strong>of</strong><br />
Hannover, 2003<br />
(10) Nishigaya Masabumi et al., “Development <strong>of</strong> Toyota's ‘New Super <strong>CVT</strong>’”, SAE<br />
paper 2001-01-0872, SAE 2001<br />
(11) Schul<strong>the</strong>iß et al., “Torque fuse Regelung der Abtriebskupplung eines <strong>CVT</strong>”, VDI<br />
Bericht 1917, page 287-305, 2005<br />
(12) Van der Laan et al., “Improving <strong>Bosch</strong>-VDT <strong>pushbelt</strong> efficiency by control<br />
strategies based on new variator wear insight”, paper 04<strong>CVT</strong>-039, <strong>CVT</strong><br />
congress, 2004<br />
(13) Veenhuizen et al., “Variator slip control implemented in a production vehicle with<br />
<strong>pushbelt</strong> <strong>CVT</strong>”, 3 rd CTI congress, Würzburg 2004<br />
(14) Takahara et al., “<strong>CVT</strong> control system for Toyota intelligent idling stop system”,<br />
SAE paper 2004-01-1635, SAE 2004<br />
(15) Tsukuda et al., “Toyota new belt <strong>CVT</strong> for 1.3 ltr FWD cars”, SAE paper 2006-01-<br />
1305, SAE 2006<br />
13
5th International CTI-Symposium<br />
Innovative Automotive Transmissions 4th – 7th December 2006, Berlin, Germany<br />
- ) % ) * " * " % '<br />
* ) %<br />
%"* %% ( $ "<br />
. %<br />
. ) "<br />
. " % )<br />
! " " # # $ %% "& $ " $ ' " ( ) " % * * +<br />
"& # , $ %% "& ' ( " * % ) * + " & ( * " & " ( * " #<br />
- " $ ( %) "<br />
/ 0 " "
CTI symposium 2006, Berlin<br />
24<br />
20<br />
16<br />
12<br />
8<br />
1 2 * 3 & %"<br />
- ) % ) * " - , $ " % + $ " % 4 "&<br />
better<br />
6AT<br />
<strong>CVT</strong> belt<br />
750 1000 1250 1500 1750 2000<br />
The <strong>pushbelt</strong> <strong>CVT</strong> <strong>of</strong>fers state <strong>of</strong> <strong>the</strong> art fuel <strong>consumption</strong><br />
! " " # # $ %% "& $ " $ ' " ( ) " % * * +<br />
"& # , $ %% "& ' ( " * % ) * + " & ( * " & " ( * " #<br />
4AT<br />
4/5 AT<br />
6AT<br />
<strong>CVT</strong> belt<br />
<strong>CVT</strong> chain<br />
DCT<br />
Specifics<br />
- Sources: OEM data<br />
- Japan, 10-15 cycle<br />
- Applications beyond 2002<br />
- FWD, gasoline<br />
- uncharged engines
5<br />
CTI symposium 2006, Berlin<br />
1 ) * 3 & %"<br />
- ) % ) * " - , $ " % + $ " % 4 "&<br />
better<br />
12<br />
11<br />
10<br />
9<br />
8<br />
7<br />
6<br />
5<br />
4/5 AT 6AT<br />
<strong>CVT</strong> belt<br />
1000 1200 1400 1600 1800 2000<br />
The <strong>pushbelt</strong> <strong>CVT</strong> <strong>of</strong>fers state <strong>of</strong> <strong>the</strong> art fuel <strong>consumption</strong><br />
! " " # # $ %% "& $ " $ ' " ( ) " % * * +<br />
"& # , $ %% "& ' ( " * % ) * + " & ( * " & " ( * " #<br />
4/5 AT<br />
6AT<br />
<strong>CVT</strong> belt<br />
<strong>CVT</strong> chain<br />
DCT<br />
Specifics<br />
- Sources: KBA, OEM data<br />
- Europe, combined NEDC cycle<br />
- Applications beyond 2002<br />
- FWD, gasoline<br />
- uncharged engines
6<br />
CTI symposium 2006, Berlin<br />
1 ) * 3 ( " %<br />
- ) % ) * " - , $ " % + $ " % 4 "&<br />
better<br />
12<br />
11<br />
10<br />
9<br />
8<br />
7<br />
6<br />
5<br />
The <strong>pushbelt</strong> <strong>CVT</strong> <strong>of</strong>fers state <strong>of</strong> <strong>the</strong> art fuel <strong>consumption</strong><br />
! " " # # $ %% "& $ " $ ' " ( ) " % * * +<br />
"& # , $ %% "& ' ( " * % ) * + " & ( * " & " ( * " #<br />
DCT<br />
6AT<br />
<strong>CVT</strong> belt<br />
1000 1200 1400 1600 1800 2000<br />
4/5 AT<br />
6AT<br />
<strong>CVT</strong> belt<br />
<strong>CVT</strong> chain<br />
DCT<br />
Specifics<br />
- Sources: KBA, OEM data<br />
- Europe, combined NEDC cycle<br />
- Applications beyond 2002<br />
- FWD, diesel<br />
- <strong>CVT</strong> chain: with DPF
7<br />
CTI symposium 2006, Berlin<br />
8 "<br />
* % $ + %<br />
Pump<br />
Torque<br />
Converter<br />
Variator<br />
DNR<br />
Gears<br />
<strong>Fuel</strong><br />
100%<br />
Engine<br />
100%<br />
NEDC<br />
NEDC<br />
Engine<br />
66.3%<br />
Variator and pump <strong>of</strong>fer largest <strong>potential</strong> for improvement <strong>of</strong> efficiency<br />
Pump<br />
12%<br />
T/C<br />
4.7%<br />
! " " # # $ %% "& $ " $ ' " ( ) " % * * +<br />
"& # , $ %% "& ' ( " * % ) * + " & ( * " & " ( * " #<br />
Engine idle<br />
9.8%<br />
Variator<br />
13.5%<br />
Transmission<br />
8%<br />
DNR+gears<br />
3.2%<br />
To road<br />
15.9%<br />
To road<br />
66.6%
Clamping force [kN]<br />
Clamping force<br />
16<br />
current clamping force<br />
NEDC cycle<br />
40<br />
14 optimal clamping force unrestricted<br />
optimal clamping force restricted<br />
35<br />
12<br />
Force control<br />
30<br />
10<br />
CTI symposium 2006, Berlin<br />
9 " * " "* % ' % "<br />
8<br />
6<br />
4<br />
2<br />
% * " & ' %<br />
0 20 40 60 80 100 120 140 160 180 0<br />
≤ 0<br />
Engine torque [Nm]<br />
-52%<br />
Slip control<br />
! " " # # $ %% "& $ " $ ' " ( ) " % * * +<br />
"& # , $ %% "& ' ( " * % ) * + " & ( * " & " ( * " #<br />
25<br />
20<br />
15<br />
10<br />
5<br />
Optimal control strategy significantly reduces clamping force<br />
Time share NEDC cycle [%]<br />
F clamp<br />
F clamp<br />
F radial<br />
F radial<br />
F ring<br />
F ring<br />
F ring<br />
F ring<br />
F radial<br />
F radial<br />
F clamp<br />
F clamp
Cycle<br />
:<br />
NEDC<br />
reference<br />
NEDC<br />
slip control<br />
10-15<br />
reference<br />
10-15<br />
slip control<br />
CTI symposium 2006, Berlin<br />
; 4 % " "( $ "<br />
'' ' ( ) ( % * " & ' $ + %<br />
Bearings<br />
Element-pulley contact<br />
Belt internal<br />
0 500 1000<br />
Average power loss [Watt]<br />
F clamp<br />
F clamp<br />
F radial<br />
F radial<br />
Clamping force is <strong>the</strong> main initiator <strong>of</strong> losses inside <strong>the</strong> <strong>CVT</strong><br />
! " " # # $ %% "& $ " $ ' " ( ) " % * * +<br />
"& # , $ %% "& ' ( " * % ) * + " & ( * " & " ( * " #<br />
F ring<br />
F ring<br />
F ring<br />
F ring<br />
F radial<br />
F radial<br />
F clamp<br />
F clamp
CTI symposium 2006, Berlin<br />
% ' %"* %<br />
= $ " +<br />
Element normal force [N]<br />
800<br />
700<br />
600<br />
500<br />
400<br />
300<br />
200<br />
100<br />
Primary speed n p =1500[rpm]<br />
Low OD<br />
Safe region<br />
Unsafe region<br />
Low failure line<br />
OD failure line<br />
current area OD<br />
new area OD<br />
0<br />
0 2 4 6<br />
Slip speed [m/s]<br />
8 10 12<br />
The <strong>pushbelt</strong> can handle more slip than previously assumed<br />
< ! " " # # $ %% "& $ " $ ' " ( ) " % * * +<br />
"& # , $ %% "& ' ( " * % ) * + " & ( * " & " ( * " #
CTI symposium 2006, Berlin<br />
% ' %"* %<br />
= " % +<br />
? * )<br />
. / * " % ''" " +<br />
. " "<br />
. % %& "<br />
. " ) ' %"*<br />
. + ( ) %" +<br />
i 0 ...<br />
Setpoint<br />
generation<br />
secondary/<br />
primary<br />
auxiliary<br />
Slipset<br />
! " " # # $ %% "& $ " $ ' " ( ) " % * * +<br />
"& # , $ %% "& ' ( " * % ) * + " & ( * " & " ( * " #<br />
+<br />
-<br />
Controller<br />
The control system must be adapted for slip control<br />
Slip<br />
detection<br />
primary<br />
secondary
CTI symposium 2006, Berlin<br />
3 )<br />
"'" ( %% "& ) $ " % % $ %<br />
( 4<br />
5 * + *<br />
5 %"* % ( * "<br />
5 vehicle<br />
3 )<br />
5 ' $ " %<br />
5 4 $ " %<br />
( + %<br />
5 6 /6 7 8 0<br />
5 / 9 6 9<br />
Slip control has been tested in a vehicle for several cycles<br />
! " " # # $ %% "& $ " $ ' " ( ) " % * * +<br />
"& # , $ %% "& ' ( " * % ) * + " & ( * " & " ( * " #
CTI symposium 2006, Berlin<br />
) %<br />
"'' 4 ' ( 4 & + $ + %<br />
/<br />
7 8 0<br />
/ 9<br />
9<br />
7 ) % ) * " ( ) " % * " & ' ( ) "<br />
/# :<br />
/# :<br />
/#/ :<br />
/#0 :<br />
#0 :<br />
Slip control achieves fuel economy reductions <strong>of</strong> 5 to 6.7%<br />
! " " # # $ %% "& $ " $ ' " ( ) " % * * +<br />
"& # , $ %% "& ' ( " * % ) * + " & ( * " & " ( * " #<br />
.2 :<br />
. :<br />
./ :<br />
2 :<br />
/0 :
auxiliary<br />
CTI symposium 2006, Berlin<br />
7 ) )<br />
; * " " ( + ( ) %" < % " %%+ ( "$ ) * * * ) * = * ) * ><br />
primary<br />
secondary<br />
auxiliary<br />
E-pump<br />
$ " % % $ " % % 4 " * ) *<br />
! " " # # $ %% "& $ " $ ' " ( ) " % * * +<br />
"& # , $ %% "& ' ( " * % ) * + " & ( * " & " ( * " #<br />
E<br />
primary<br />
secondary
CTI symposium 2006, Berlin<br />
7 ) )<br />
; * " " ( + ( ) %" < % " %%+ ( "$ ) * * * ) * = * ) * ><br />
7 )<br />
5 ( ) ( " * ) * * )<br />
5 * " % $ " ) * * %+<br />
5 #.: ') % ) * " '"<br />
auxiliary<br />
E-pump<br />
$ " % % 4 " * ) *<br />
An E-pump can deliver a 2.4% fuel <strong>consumption</strong> benefit<br />
- ! " " # # $ %% "& $ " $ ' " ( ) " % * * +<br />
"& # , $ %% "& ' ( " * % ) * + " & ( * " & " ( * " #<br />
E<br />
primary<br />
secondary
CTI symposium 2006, Berlin<br />
7 ) )<br />
%) ( *<br />
5 ( / + % ? . - : "( %<br />
%)<br />
5 ( ) ( * ) * % ( ) " & "( %<br />
5 # #1: ') % ) * " '" @<br />
*<br />
5 * $ " " ( & " % ( ) " & "( %<br />
5 /#2 # : ') % ) * " '" @<br />
@ ) % ' ( / + %<br />
Measures during idle <strong>of</strong>fer a 1.6 to 12.1% fuel <strong>consumption</strong> benefit<br />
. ! " " # # $ %% "& $ " $ ' " ( ) " % * * +<br />
"& # , $ %% "& ' ( " * % ) * + " & ( * " & " ( * " #
CTI symposium 2006, Berlin<br />
) % ') )<br />
A * $ + * " " " ' ) "<br />
+ ( ) %" * " " "<br />
%)<br />
% * " % ' ?<br />
+ %<br />
/ + %<br />
@ " ( ) % ' (<br />
7 ) % ) * " ( ) "<br />
#. : = + % ><br />
# : = + % ><br />
0# : @<br />
1#. : @<br />
Total fuel <strong>consumption</strong> <strong>potential</strong> for <strong>CVT</strong> is 7 to 8.4%<br />
/ ! " " # # $ %% "& $ " $ ' " ( ) " % * * +<br />
"& # , $ %% "& ' ( " * % ) * + " & ( * " & " ( * " #<br />
) % " $ ( +<br />
3 )<br />
" ) % "<br />
" ) % "<br />
" ) % "
etter<br />
CTI symposium 2006, Berlin<br />
9<br />
7 ) % ) * " * " % ' $ % " " *<br />
6AT DCT <strong>CVT</strong><br />
7 , 6 & %" 6 6 ) ? @> 6 A / @@> B 7 6 A @@@> & , 6 " & " + * ") / @@@@> & 6 A<br />
Future <strong>CVT</strong> will remain to <strong>of</strong>fer state <strong>of</strong> <strong>the</strong> art fuel <strong>consumption</strong><br />
! " " # # $ %% "& $ " $ ' " ( ) " % * * +<br />
"& # , $ %% "& ' ( " * % ) * + " & ( * " & " ( * " #
CTI symposium 2006, Berlin<br />
) +<br />
Current fuel <strong>consumption</strong> situation<br />
State <strong>of</strong> <strong>the</strong> art <strong>CVT</strong>s show very competitive fuel <strong>consumption</strong> results<br />
The <strong>CVT</strong> <strong>of</strong>fers significant <strong>potential</strong> for fuel <strong>consumption</strong> reduction<br />
Potential<br />
Main <strong>potential</strong> is found in <strong>the</strong> variator and actuation system<br />
Slip control enables up to 70% reduction <strong>of</strong> belt clamping forces<br />
Measurements<br />
Slip control <strong>of</strong>fers around 5% fuel <strong>consumption</strong> <strong>potential</strong><br />
Fur<strong>the</strong>r measures lead to a <strong>potential</strong> <strong>of</strong> up to 8.4%<br />
0 ! " " # # $ %% "& $ " $ ' " ( ) " % * * +<br />
"& # , $ %% "& ' ( " * % ) * + " & ( * " & " ( * " #
1<br />
CTI symposium 2006, Berlin<br />
Thank you for your attention.<br />
! " " # # $ %% "& $ " $ ' " ( ) " % * * +<br />
"& # , $ %% "& ' ( " * % ) * + " & ( * " & " ( * " #<br />
! !<br />
" # $ % & ' ( )


