Who Can Afford to Live in Delaware? - Delaware Housing Coalition
Who Can Afford to Live in Delaware? - Delaware Housing Coalition
Who Can Afford to Live in Delaware? - Delaware Housing Coalition
- No tags were found...

You also want an ePaper? Increase the reach of your titles
YUMPU automatically turns print PDFs into web optimized ePapers that Google loves.
2<br />
<strong>Who</strong> <strong>Can</strong> <strong>Afford</strong> <strong>to</strong> <strong>Live</strong> <strong>in</strong> <strong>Delaware</strong><br />
Special Hous<strong>in</strong>g Needs:<br />
Homelessness<br />
In 2007, the Ten‐Year Plan <strong>to</strong> End Chronic<br />
Homeless <strong>in</strong> <strong>Delaware</strong> identified the need<br />
for 2003 beds across the hous<strong>in</strong>g cont<strong>in</strong>uum.<br />
<strong>Delaware</strong> cont<strong>in</strong>ues <strong>to</strong> have a nightly,<br />
measurable sheltered homeless population<br />
that averages 1000, with an estimated<br />
6000 unduplicated homeless per year.<br />
Homelessness is exacerbated by vicious<br />
cycles. The lack of supportive services can<br />
lead <strong>to</strong> homelessness or prolong the period<br />
of homelessness of a vulnerable person.<br />
Lack of hous<strong>in</strong>g, on the other hand,<br />
constitutes a major barrier <strong>to</strong> successful<br />
use of the supportive services that such a<br />
person can access.<br />
<strong>Delaware</strong>ans with Disabilities<br />
There are an estimated 108,500 people<br />
with disabilities <strong>in</strong> the State of <strong>Delaware</strong>.<br />
An additional approximately 4,600 people<br />
<strong>in</strong> <strong>Delaware</strong> live <strong>in</strong> nurs<strong>in</strong>g facilities and<br />
are excluded from these numbers,<br />
though many likely have disabilities. In<br />
<strong>Delaware</strong>, 11% of adults aged 18‐64 and 31%<br />
of adults over 65 have a disability.<br />
The new report, Community and Choice<br />
(April 2012), estimates that <strong>in</strong> <strong>Delaware</strong><br />
there are 4,500 households with at least<br />
one nonelderly member with a disability<br />
with worst case hous<strong>in</strong>g needs and<br />
1,600 households with an elderly member<br />
with a disability with worst case needs.<br />
People with disabilities typically have<br />
lower <strong>in</strong>comes, are far more likely <strong>to</strong> be <strong>in</strong><br />
poverty, and are more likely <strong>to</strong> need hous<strong>in</strong>g<br />
assistance than those with no disabilities.<br />
People with severe disabilities that<br />
<strong>in</strong>terfere with their ability <strong>to</strong> work or with<br />
activities of daily or <strong>in</strong>dependent liv<strong>in</strong>g<br />
are even more likely <strong>to</strong> be <strong>in</strong> poverty, an<br />
estimated 26% compared <strong>to</strong> 17% of all people<br />
with disabilities and 10% of people<br />
with no disabilities.<br />
The need for accessible, affordable hous<strong>in</strong>g<br />
is a major barrier <strong>to</strong> people with disabilities<br />
liv<strong>in</strong>g <strong>in</strong> the community, and these<br />
hous<strong>in</strong>g needs severely limit the options<br />
of people with disabilities <strong>to</strong> live <strong>in</strong> the<br />
least restrictive sett<strong>in</strong>g of their choice.<br />
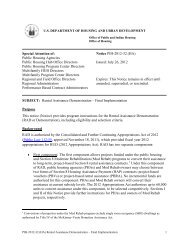
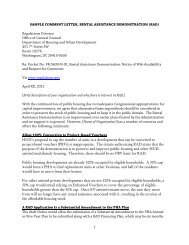
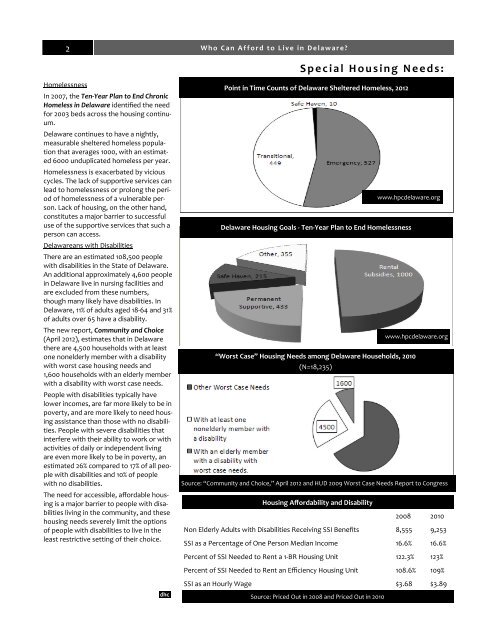
Po<strong>in</strong>t <strong>in</strong> Time Counts of <strong>Delaware</strong> Sheltered Homeless, 2012<br />
www.hpcdelaware.org<br />
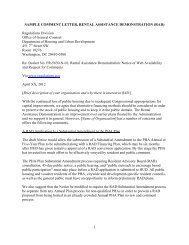
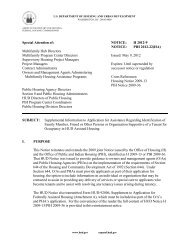
<strong>Delaware</strong> Hous<strong>in</strong>g Goals ‐ Ten‐Year Plan <strong>to</strong> End Homelessness<br />
www.hpcdelaware.org<br />
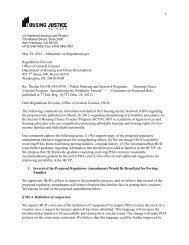
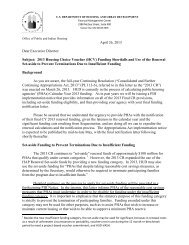
“Worst Case” Hous<strong>in</strong>g Needs among <strong>Delaware</strong> Households, 2010<br />
(N=18,235)<br />
Source: “Community and Choice,” April 2012 and HUD 2009 Worst Case Needs Report <strong>to</strong> Congress<br />
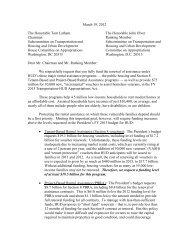
Hous<strong>in</strong>g <strong>Afford</strong>ability and Disability<br />
2008 2010<br />
Non Elderly Adults with Disabilities Receiv<strong>in</strong>g SSI Benefits 8,555 9,253<br />
SSI as a Percentage of One Person Median Income 16.6% 16.6%<br />
Percent of SSI Needed <strong>to</strong> Rent a 1‐BR Hous<strong>in</strong>g Unit 122.3% 123%<br />
Percent of SSI Needed <strong>to</strong> Rent an Efficiency Hous<strong>in</strong>g Unit 108.6% 109%<br />
SSI as an Hourly Wage $3.68 $3.89<br />
Source: Priced Out <strong>in</strong> 2008 and Priced Out <strong>in</strong> 2010