Who Can Afford to Live in Delaware? - Delaware Housing Coalition
Who Can Afford to Live in Delaware? - Delaware Housing Coalition
Who Can Afford to Live in Delaware? - Delaware Housing Coalition
- No tags were found...

Create successful ePaper yourself
Turn your PDF publications into a flip-book with our unique Google optimized e-Paper software.
6<br />
<strong>Who</strong> <strong>Can</strong> <strong>Afford</strong> <strong>to</strong> <strong>Live</strong> <strong>in</strong> <strong>Delaware</strong><br />
Income, Employment, and Wealth:<br />
The M<strong>in</strong>imum Wage<br />
A full‐time year‐round worker at the m<strong>in</strong>imum<br />
wage ($7.25/hour) cannot meet the<br />
most basic need for hous<strong>in</strong>g. In reality it<br />
takes work<strong>in</strong>g 103 hours a week<br />
(equivalent <strong>to</strong>2.6 full‐time year‐round<br />
jobs) at the m<strong>in</strong>imum wage <strong>in</strong> order <strong>to</strong><br />
afford a modest two‐bedroom apartment<br />
<strong>in</strong> <strong>Delaware</strong> (NLIHC, 2012).<br />
The value of the m<strong>in</strong>imum wage relative<br />
<strong>to</strong> the poverty l<strong>in</strong>e peaked <strong>in</strong> 1968 at 90%;<br />
it has averaged 2/3 of poverty s<strong>in</strong>ce 1959<br />
when the poverty l<strong>in</strong>e was established.<br />
(M<strong>in</strong>imum Wage, 2009)<br />
NLIHC Hous<strong>in</strong>g Wage<br />
As developed by the National Low Income<br />
Hous<strong>in</strong>g <strong>Coalition</strong>, the hous<strong>in</strong>g wage<br />
is the <strong>in</strong>come needed <strong>in</strong> order <strong>to</strong> pay no<br />
more than 30% of monthly <strong>in</strong>come on<br />
hous<strong>in</strong>g costs. The 2012 statewide hous<strong>in</strong>g<br />
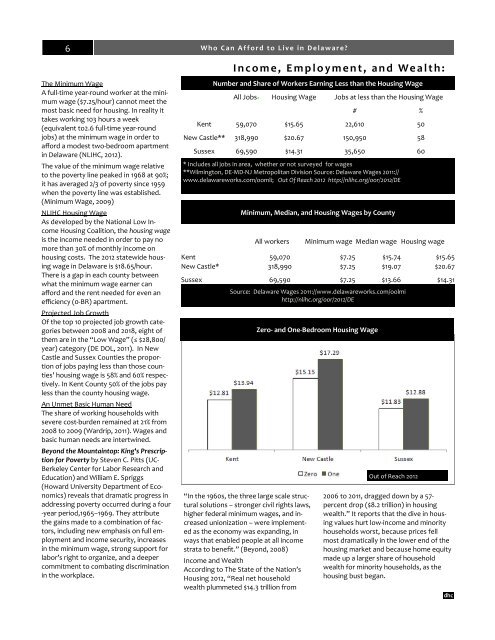
wage <strong>in</strong> <strong>Delaware</strong> is $18.65/hour.<br />
There is a gap <strong>in</strong> each county between<br />
what the m<strong>in</strong>imum wage earner can<br />
afford and the rent needed for even an<br />
efficiency (0‐BR) apartment.<br />
Projected Job Growth<br />
Of the <strong>to</strong>p 10 projected job growth categories<br />
between 2008 and 2018, eight of<br />
them are <strong>in</strong> the “Low Wage” (≤ $28,800/<br />
year) category (DE DOL, 2011). In New<br />
Castle and Sussex Counties the proportion<br />
of jobs pay<strong>in</strong>g less than those counties’<br />
hous<strong>in</strong>g wage is 58% and 60% respectively.<br />
In Kent County 50% of the jobs pay<br />
less than the county hous<strong>in</strong>g wage.<br />
An Unmet Basic Human Need<br />
The share of work<strong>in</strong>g households with<br />
severe cost‐burden rema<strong>in</strong>ed at 21% from<br />
2008 <strong>to</strong> 2009 (Wardrip, 2011). Wages and<br />
basic human needs are <strong>in</strong>tertw<strong>in</strong>ed.<br />
Beyond the Mounta<strong>in</strong><strong>to</strong>p: K<strong>in</strong>g's Prescription<br />
for Poverty by Steven C. Pitts (UC‐<br />
Berkeley Center for Labor Research and<br />
Education) and William E. Spriggs<br />
(Howard University Department of Economics)<br />
reveals that dramatic progress <strong>in</strong><br />
address<strong>in</strong>g poverty occurred dur<strong>in</strong>g a four<br />
‐year period,1965–1969. They attribute<br />
the ga<strong>in</strong>s made <strong>to</strong> a comb<strong>in</strong>ation of fac<strong>to</strong>rs,<br />
<strong>in</strong>clud<strong>in</strong>g new emphasis on full employment<br />
and <strong>in</strong>come security, <strong>in</strong>creases<br />
<strong>in</strong> the m<strong>in</strong>imum wage, strong support for<br />
labor’s right <strong>to</strong> organize, and a deeper<br />
commitment <strong>to</strong> combat<strong>in</strong>g discrim<strong>in</strong>ation<br />
<strong>in</strong> the workplace.<br />
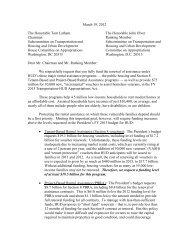
Number and Share of Workers Earn<strong>in</strong>g Less than the Hous<strong>in</strong>g Wage<br />
All Jobs * Hous<strong>in</strong>g Wage Jobs at less than the Hous<strong>in</strong>g Wage<br />
# %<br />
Kent 59,070 $15.65 22,610 50<br />
New Castle** 318,990 $20.67 150,950 58<br />
Sussex 69,590 $14.31 35,650 60<br />
* Includes all jobs <strong>in</strong> area, whether or not surveyed for wages<br />
**Wilm<strong>in</strong>g<strong>to</strong>n, DE‐MD‐NJ Metropolitan Division Source: <strong>Delaware</strong> Wages 2011://<br />
www.delawareworks.com/oomli; Out Of Reach 2012 http://nlihc.org/oor/2012/DE<br />
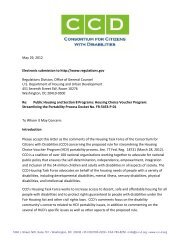
M<strong>in</strong>imum, Median, and Hous<strong>in</strong>g Wages by County<br />
All workers<br />
M<strong>in</strong>imum wage Median wage Hous<strong>in</strong>g wage<br />
Kent 59,070 $7.25 $15.74 $15.65<br />
New Castle* 318,990 $7.25 $19.07 $20.67<br />
Sussex 69,590 $7.25 $13.66 $14.31<br />
Source: <strong>Delaware</strong> Wages 2011://www.delawareworks.com/oolmi<br />
http://nlihc.org/oor/2012/DE<br />
“In the 1960s, the three large scale structural<br />
solutions – stronger civil rights laws,<br />
higher federal m<strong>in</strong>imum wages, and <strong>in</strong>creased<br />
unionization – were implemented<br />
as the economy was expand<strong>in</strong>g, <strong>in</strong><br />
ways that enabled people at all <strong>in</strong>come<br />
strata <strong>to</strong> benefit.” (Beyond, 2008)<br />
Income and Wealth<br />
Accord<strong>in</strong>g <strong>to</strong> The State of the Nation’s<br />
Hous<strong>in</strong>g 2012, “Real net household<br />
wealth plummeted $14.3 trillion from<br />
Zero‐ and One‐Bedroom Hous<strong>in</strong>g Wage<br />
Out of Reach 2012<br />
2006 <strong>to</strong> 2011, dragged down by a 57‐<br />
percent drop ($8.2 trillion) <strong>in</strong> hous<strong>in</strong>g<br />
wealth.” It reports that the dive <strong>in</strong> hous<strong>in</strong>g<br />
values hurt low‐<strong>in</strong>come and m<strong>in</strong>ority<br />
households worst, because prices fell<br />
most dramatically <strong>in</strong> the lower end of the<br />
hous<strong>in</strong>g market and because home equity<br />
made up a larger share of household<br />
wealth for m<strong>in</strong>ority households, as the<br />
hous<strong>in</strong>g bust began.