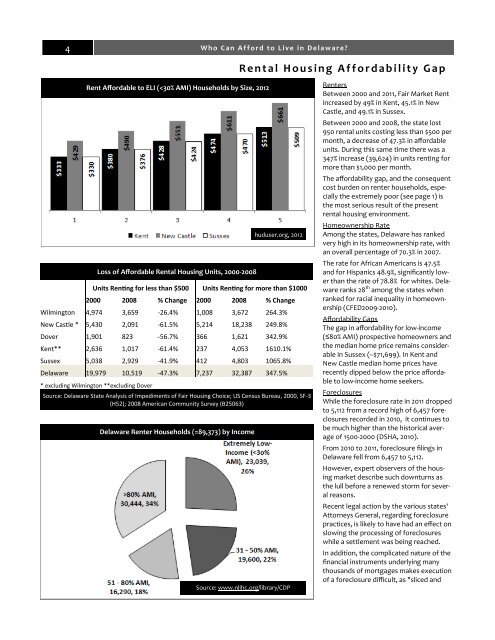
4 <strong>Who</strong> <strong>Can</strong> <strong>Afford</strong> <strong>to</strong> <strong>Live</strong> <strong>in</strong> <strong>Delaware</strong> Rental Hous<strong>in</strong>g <strong>Afford</strong>ability Gap Rent <strong>Afford</strong>able <strong>to</strong> ELI (
Hous<strong>in</strong>gForAll.org | <strong>Delaware</strong> Hous<strong>in</strong>g <strong>Coalition</strong> | WhyNIMBY.org 5 Home Ownership and Foreclosures Homeownership <strong>Afford</strong>ability Gaps by County, 2006 ‐ 2010 destatehous<strong>in</strong>g.com, 2011 bundled" mortgages make ownership identification problematic. Tight credit guidel<strong>in</strong>es and the uncerta<strong>in</strong>ty of the s<strong>in</strong>gle family home ownership market have also made mortgage companies reluctant <strong>to</strong> foreclose <strong>in</strong> greater volume on homes that cannot be resold. F<strong>in</strong>ally, the job market is still a major fac<strong>to</strong>r contribut<strong>in</strong>g <strong>to</strong> home owners fac<strong>in</strong>g foreclosure. <strong>Delaware</strong> has experienced 26,000 foreclosures <strong>in</strong> the past five years, and the number of homes sold at sheriff’s sales <strong>in</strong>creased 35 percent from 2010 <strong>to</strong> 2011, accord<strong>in</strong>g <strong>to</strong> a June 2012 announcement from the office of Governor Markell. The Role of Residential Segregation A 2011 study of the Racial Dimensions of the Foreclosure Crisis found residential segregation <strong>to</strong> be a powerful predic<strong>to</strong>r of the number and rate of foreclosures <strong>in</strong> the nation. “Racial segregation, discrim<strong>in</strong>a<strong>to</strong>ry lend<strong>in</strong>g, and an overheated hous<strong>in</strong>g market comb<strong>in</strong>ed <strong>to</strong> leave m<strong>in</strong>ority group members and neighborhoods uniquely vulnerable <strong>to</strong> the hous<strong>in</strong>g bust.” (Racial Dimensions, 2011). Comparison of Median Income & Median Hous<strong>in</strong>g Prices 2000 & 2011 Home Price/ Median Median Income Ratio Household Income Hous<strong>in</strong>g Price 2000 2011 2000 (Q4) 2011 2000 2011 Kent $40,950 $62,000 $114,575 $165,000 2.8 2.7 New Castle $52,514 $80,400 $151,600 $183,000 2.9 2.3 Sussex $39,208 $61,300 $164,650 $255,000 4.2 4.2 Source: Out of Reach 2012, www,nlihc..org; DSHA, http://www.destatehous<strong>in</strong>g.com/ <strong>Delaware</strong> Foreclosure Fil<strong>in</strong>gs, 2000 ‐ 2011 Source: destatehous<strong>in</strong>g.com