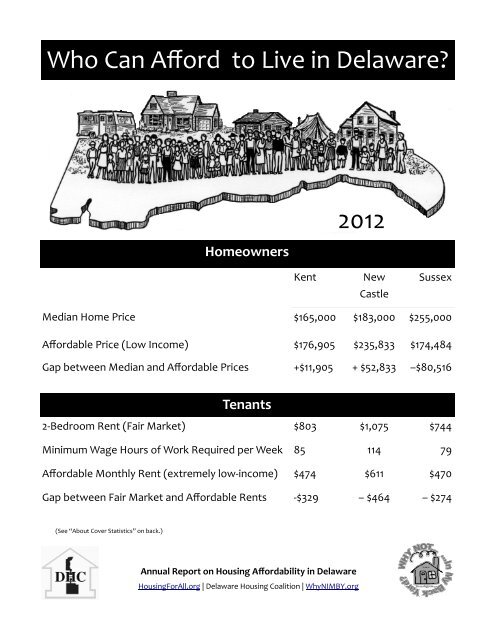
Who Can Afford to Live in Delaware? - Delaware Housing Coalition
Who Can Afford to Live in Delaware? - Delaware Housing Coalition
Who Can Afford to Live in Delaware? - Delaware Housing Coalition
- No tags were found...

Create successful ePaper yourself
Turn your PDF publications into a flip-book with our unique Google optimized e-Paper software.
<strong>Who</strong> <strong>Can</strong> <strong>Afford</strong> <strong>to</strong> <strong>Live</strong> <strong>in</strong> <strong>Delaware</strong><br />
Homeowners<br />
2012<br />
Kent<br />
New<br />
Castle<br />
Sussex<br />
Median Home Price $165,000 $183,000 $255,000<br />
<strong>Afford</strong>able Price (Low Income) $176,905 $235,833 $174,484<br />
Gap between Median and <strong>Afford</strong>able Prices +$11,905 + $52,833 –$80,516<br />
Tenants<br />
2‐Bedroom Rent (Fair Market) $803 $1,075 $744<br />
M<strong>in</strong>imum Wage Hours of Work Required per Week 85 114 79<br />
<strong>Afford</strong>able Monthly Rent (extremely low‐<strong>in</strong>come) $474 $611 $470<br />
Gap between Fair Market and <strong>Afford</strong>able Rents ‐$329 – $464 – $274<br />
(See “About Cover Statistics” on back.)<br />
Annual Report on Hous<strong>in</strong>g <strong>Afford</strong>ability <strong>in</strong> <strong>Delaware</strong><br />
Hous<strong>in</strong>gForAll.org | <strong>Delaware</strong> Hous<strong>in</strong>g <strong>Coalition</strong> | WhyNIMBY.org
SUMMARY<br />
Hous<strong>in</strong>g and Poverty 1<br />
Special Hous<strong>in</strong>g Needs 2<br />
Rental Hous<strong>in</strong>g 4<br />
Homeownership 5<br />
Income, Employment, Wealth 6<br />
Hous<strong>in</strong>g and Communities 8<br />
Sources<br />
Summary<br />
Hous<strong>in</strong>g Burden Among the Very Poor<br />
<br />
<br />
<br />
<br />
Of the 89,373 renter households <strong>in</strong><br />
<strong>Delaware</strong>, 24,002 are severely costburdened,<br />
spend<strong>in</strong>g more than 50%<br />
of their <strong>in</strong>come for hous<strong>in</strong>g.<br />
Of the severely cost‐burdened renter<br />
households, 97% (23,165) have very<br />
low <strong>in</strong>comes, below 50% of area median<br />
<strong>in</strong>come (AMI) and 71% (17,049)<br />
have extremely low <strong>in</strong>comes, below<br />
30% of area median <strong>in</strong>come (AMI).<br />
There are 23,039 extremely low<strong>in</strong>come<br />
renter households <strong>in</strong> <strong>Delaware</strong>.<br />
74% (17,049) of extremely low<strong>in</strong>come<br />
households are severely cost<br />
‐burdened.<br />
For every 100 extremely low‐<strong>in</strong>come<br />
households (those at or below 30%<br />
of the area median <strong>in</strong>come), there<br />
are only 33 units affordable and available.<br />
Special Hous<strong>in</strong>g Needs<br />
<br />
<br />
<br />
There are 4,500 households with at<br />
least one nonelderly member with a<br />
disability with worst case hous<strong>in</strong>g<br />
needs and 1,600 households with an<br />
elderly member with a disability with<br />
worst case needs.<br />
Approximately 1,000 <strong>Delaware</strong>ans<br />
annually cont<strong>in</strong>ue <strong>to</strong> be identified as<br />
sheltered homeless on any particular<br />
night, with 6,000 state residents<br />
experienc<strong>in</strong>g homelessness dur<strong>in</strong>g<br />
the year.<br />
The efficiency apartment hous<strong>in</strong>g<br />
wage is $14.23 for <strong>Delaware</strong>, the<br />
equivalent of an annual salary of<br />
Contents<br />
<strong>Who</strong> <strong>Can</strong> <strong>Afford</strong> <strong>to</strong> <strong>Live</strong> <strong>in</strong> <strong>Delaware</strong><br />
<br />
<br />
<br />
<br />
$29,599, and 196% of the federal m<strong>in</strong>imum<br />
wage of $7.25.<br />
A disabled person dependent on SSI<br />
cannot afford an efficiency (zerobedroom)<br />
apartment anywhere <strong>in</strong><br />
the state.<br />
About 70,000 <strong>Delaware</strong>ans live <strong>in</strong><br />
41,000 manufactured homes. These<br />
comprise 10% of <strong>Delaware</strong>’s hous<strong>in</strong>g<br />
s<strong>to</strong>ck.<br />
In <strong>Delaware</strong> 50% of manufactured<br />
homeowners live on leased land, a<br />
higher rate than national estimates of<br />
30‐35%.<br />
Approximately 25,000 <strong>Delaware</strong><br />
households are “at risk” due <strong>to</strong> hous<strong>in</strong>g<br />
cost burdens or other serious<br />
hous<strong>in</strong>g problems.<br />
Renters<br />
<br />
<br />
<br />
<br />
<br />
<br />
The Fair Market Rent for a twobedroom<br />
apartment ranges from a<br />
low of $744 <strong>in</strong> Sussex County <strong>to</strong> $803<br />
<strong>in</strong> Kent County <strong>to</strong> a high of $1,075 <strong>in</strong><br />
New Castle.<br />
A worker <strong>in</strong> <strong>Delaware</strong> must earn<br />
$18.65 per hour–or $38,784 annually–<br />
<strong>to</strong> afford a modest two‐bedroom<br />
apartment.<br />
54% of <strong>Delaware</strong> renters can not<br />
afford a two‐bedroom apartment <strong>in</strong><br />
their county.<br />
In all three counties, monthly twobedroom<br />
fair market rents far exceed<br />
(by a range of $274 <strong>to</strong> $464) rents<br />
affordable <strong>to</strong> extremely low‐<strong>in</strong>come<br />
households, as well as m<strong>in</strong>imumwage<br />
workers. For <strong>in</strong>dividuals who<br />
rely on Supplemental Security Income<br />
(SSI), rents exceed <strong>in</strong>come by a<br />
range of $435 <strong>to</strong> $766.<br />
<strong>Delaware</strong> has an immediate and<br />
press<strong>in</strong>g need for at least 13,422 rental<br />
units affordable <strong>to</strong> ELI households,<br />
whether through project‐based or<br />
tenant‐based assistance. At least<br />
1,132 of these are needed as new<br />
subsidized units <strong>to</strong> be added <strong>to</strong> <strong>Delaware</strong>’s<br />
hous<strong>in</strong>g s<strong>to</strong>ck.<br />
Between 2000 and 2008, <strong>Delaware</strong><br />
lost 9,460 affordable rental units<br />
while it ga<strong>in</strong>ed 25,150 high‐end units.<br />
Equitable Hous<strong>in</strong>g Distribution<br />
<br />
In 2000, 156 of 317 census tracts<br />
(49%) had clear deficits of rental<br />
hous<strong>in</strong>g units that are affordable and<br />
available <strong>to</strong> extremely low‐<strong>in</strong>come<br />
households.<br />
There is a net need for 9,186 assisted<br />
hous<strong>in</strong>g opportunities throughout<br />
the state, redistributed <strong>in</strong> a manner<br />
which better satisfies the Fair Share<br />
Hous<strong>in</strong>g Measure.<br />
Download a .pdf version of this report from the publications page of our website: www.hous<strong>in</strong>gforall.org<br />
<br />
<br />
The effect of new multifamily hous<strong>in</strong>g<br />
on the values of exist<strong>in</strong>g s<strong>in</strong>gle<br />
family properties is a subject of<br />
great concern, but the body of research<br />
on the issue fails <strong>to</strong> show any<br />
negative impact on those properties.<br />
Homeownership<br />
<br />
<br />
<br />
In late 2011, the median purchase<br />
price for a house <strong>in</strong> <strong>Delaware</strong> ranged<br />
from $165,000 <strong>in</strong> Kent County <strong>to</strong><br />
$255,000 <strong>in</strong> Sussex.<br />
Median household <strong>in</strong>come <strong>in</strong> <strong>Delaware</strong><br />
ranges from $62,600 <strong>in</strong> Sussex<br />
County <strong>to</strong> $81,500 <strong>in</strong> New Castle.<br />
In <strong>Delaware</strong> <strong>in</strong> 2011, foreclosure fil<strong>in</strong>gs<br />
dropped <strong>to</strong> 5,112 from a record<br />
high of 6,457 the year before. This<br />
was still a 356% <strong>in</strong>crease from 1,434<br />
<strong>in</strong> 2000.<br />
The Economy<br />
<br />
<br />
<br />
<br />
<br />
<br />
Between 2006‐2010, 11.0% of <strong>Delaware</strong>ans<br />
lived below the poverty<br />
level which was $23,050 for a family<br />
of four.<br />
Eight of the ten <strong>to</strong>p growth occupations<br />
(2008‐2018) <strong>in</strong> <strong>Delaware</strong> do not<br />
pay a median wage adequate <strong>to</strong> rent<br />
a two‐bedroom unit (FMR) <strong>in</strong> any<br />
county.<br />
Every dollar spent on affordable<br />
hous<strong>in</strong>g stimulates additional spend<strong>in</strong>g,<br />
result<strong>in</strong>g <strong>in</strong> at least $7 of additional<br />
economic activity.<br />
There are very few state expenditures<br />
that can match the amount of<br />
new tax revenue generated by an<br />
<strong>in</strong>vestment <strong>in</strong> affordable hous<strong>in</strong>g,<br />
<strong>in</strong>clud<strong>in</strong>g tax cuts and transportation.<br />
Reductions <strong>in</strong> poverty correlate his<strong>to</strong>rically<br />
with real <strong>in</strong>creases <strong>in</strong> the<br />
m<strong>in</strong>imum wage.<br />
Income <strong>in</strong>equality plays a major role<br />
<strong>in</strong> the production and perpetuation<br />
of harmful social conditions.
Hous<strong>in</strong>gForAll.org | <strong>Delaware</strong> Hous<strong>in</strong>g <strong>Coalition</strong> | WhyNIMBY.org 1<br />
Hous<strong>in</strong>g and Poverty: The Poorest Carry the Burden<br />
Extremely Poor <strong>Delaware</strong> Renters<br />
Rental <strong>Afford</strong>ability Gaps by County for 4‐Person Household<br />
Comparison of <strong>Delaware</strong> <strong>Afford</strong>able and Fair Market Rents<br />
SSI<br />
Recipient<br />
Rent <strong>Afford</strong>able <strong>to</strong><br />
4‐Person<br />
Renter<br />
Household<br />
Median<br />
(Extremely<br />
Wage<br />
Low‐Income)<br />
Fair Market Rent for<br />
Zero‐BR One‐BR Two‐BR<br />
Kent $209 $474 $914 $666 $725 $803<br />
New Castle $209 $611 $902 $788 $899 $1,075<br />
Sussex $209 $470 $851 $615 $670 $744<br />
Out of Reach 2012, nlihc.org<br />
Severely Cost‐Burdened <strong>Delaware</strong> Renter Households (=20,871)<br />
Hous<strong>in</strong>g Cost Burden<br />
To be burdened by hous<strong>in</strong>g costs means<br />
pay<strong>in</strong>g more than 30% of <strong>in</strong>come on rent<br />
and utilities or a mortgage. To be<br />
“severely cost‐burdened” means hav<strong>in</strong>g<br />
<strong>to</strong> pay more than half of <strong>in</strong>come for hous<strong>in</strong>g.<br />
Extremely Low Income<br />
Households with <strong>in</strong>comes at or below 30%<br />
percent of the area median <strong>in</strong>come are<br />
extremely low‐<strong>in</strong>come (ELI).<br />
Cost‐burdened extremely low‐<strong>in</strong>come<br />
households were a grow<strong>in</strong>g hous<strong>in</strong>g problem<br />
<strong>in</strong> <strong>Delaware</strong>, even before this recession.<br />
The prolonged economic downturn<br />
has only exacerbated this crisis. For these<br />
households there is not enough left over<br />
after pay<strong>in</strong>g hous<strong>in</strong>g expenses <strong>to</strong> cover<br />
other basic expenses such as food or<br />
cloth<strong>in</strong>g.<br />
ELI households and <strong>in</strong>dividuals <strong>in</strong>clude the<br />
majority of the homeless and those at risk<br />
of homelessness, households who are<br />
hous<strong>in</strong>g cost‐burdened, elderly on fixed<br />
<strong>in</strong>comes, people with disabilities, and<br />
many of the work<strong>in</strong>g poor. The extremely<br />
low‐<strong>in</strong>come population suffers regardless<br />
of tenure, with homeowners and renters<br />
almost equally represented.<br />
Rent Cost Burdens<br />
The Congressional District Hous<strong>in</strong>g Profile<br />
for <strong>Delaware</strong>, produced by the National<br />
Low Income Hous<strong>in</strong>g <strong>Coalition</strong>, counts<br />
89,373 renter households <strong>in</strong> <strong>Delaware</strong>,<br />
24,002 of which are severely costburdened,<br />
spend<strong>in</strong>g more than 50% of<br />
their <strong>in</strong>come for hous<strong>in</strong>g.<br />
Of the severely cost‐burdened renter<br />
households, 97% (23,165) have very low<br />
<strong>in</strong>comes, below 50% of area median <strong>in</strong>come<br />
(AMI) and 71% (17,049) have extremely<br />
low <strong>in</strong>comes, below 30% of area<br />
median <strong>in</strong>come (AMI).<br />
There are 23,039 extremely low‐<strong>in</strong>come<br />
renter households <strong>in</strong> <strong>Delaware</strong>. 74%<br />
(17,049) of extremely low‐<strong>in</strong>come households<br />
are severely cost‐burdened.<br />
For every 100 extremely low‐<strong>in</strong>come<br />
households (those at or below 30% of the<br />
area median <strong>in</strong>come), there are only 33<br />
units affordable and available.<br />
Source: NLIHC Tabulations of2010 ACS/PUMS
2<br />
<strong>Who</strong> <strong>Can</strong> <strong>Afford</strong> <strong>to</strong> <strong>Live</strong> <strong>in</strong> <strong>Delaware</strong><br />
Special Hous<strong>in</strong>g Needs:<br />
Homelessness<br />
In 2007, the Ten‐Year Plan <strong>to</strong> End Chronic<br />
Homeless <strong>in</strong> <strong>Delaware</strong> identified the need<br />
for 2003 beds across the hous<strong>in</strong>g cont<strong>in</strong>uum.<br />
<strong>Delaware</strong> cont<strong>in</strong>ues <strong>to</strong> have a nightly,<br />
measurable sheltered homeless population<br />
that averages 1000, with an estimated<br />
6000 unduplicated homeless per year.<br />
Homelessness is exacerbated by vicious<br />
cycles. The lack of supportive services can<br />
lead <strong>to</strong> homelessness or prolong the period<br />
of homelessness of a vulnerable person.<br />
Lack of hous<strong>in</strong>g, on the other hand,<br />
constitutes a major barrier <strong>to</strong> successful<br />
use of the supportive services that such a<br />
person can access.<br />
<strong>Delaware</strong>ans with Disabilities<br />
There are an estimated 108,500 people<br />
with disabilities <strong>in</strong> the State of <strong>Delaware</strong>.<br />
An additional approximately 4,600 people<br />
<strong>in</strong> <strong>Delaware</strong> live <strong>in</strong> nurs<strong>in</strong>g facilities and<br />
are excluded from these numbers,<br />
though many likely have disabilities. In<br />
<strong>Delaware</strong>, 11% of adults aged 18‐64 and 31%<br />
of adults over 65 have a disability.<br />
The new report, Community and Choice<br />
(April 2012), estimates that <strong>in</strong> <strong>Delaware</strong><br />
there are 4,500 households with at least<br />
one nonelderly member with a disability<br />
with worst case hous<strong>in</strong>g needs and<br />
1,600 households with an elderly member<br />
with a disability with worst case needs.<br />
People with disabilities typically have<br />
lower <strong>in</strong>comes, are far more likely <strong>to</strong> be <strong>in</strong><br />
poverty, and are more likely <strong>to</strong> need hous<strong>in</strong>g<br />
assistance than those with no disabilities.<br />
People with severe disabilities that<br />
<strong>in</strong>terfere with their ability <strong>to</strong> work or with<br />
activities of daily or <strong>in</strong>dependent liv<strong>in</strong>g<br />
are even more likely <strong>to</strong> be <strong>in</strong> poverty, an<br />
estimated 26% compared <strong>to</strong> 17% of all people<br />
with disabilities and 10% of people<br />
with no disabilities.<br />
The need for accessible, affordable hous<strong>in</strong>g<br />
is a major barrier <strong>to</strong> people with disabilities<br />
liv<strong>in</strong>g <strong>in</strong> the community, and these<br />
hous<strong>in</strong>g needs severely limit the options<br />
of people with disabilities <strong>to</strong> live <strong>in</strong> the<br />
least restrictive sett<strong>in</strong>g of their choice.<br />
Po<strong>in</strong>t <strong>in</strong> Time Counts of <strong>Delaware</strong> Sheltered Homeless, 2012<br />
www.hpcdelaware.org<br />
<strong>Delaware</strong> Hous<strong>in</strong>g Goals ‐ Ten‐Year Plan <strong>to</strong> End Homelessness<br />
www.hpcdelaware.org<br />
“Worst Case” Hous<strong>in</strong>g Needs among <strong>Delaware</strong> Households, 2010<br />
(N=18,235)<br />
Source: “Community and Choice,” April 2012 and HUD 2009 Worst Case Needs Report <strong>to</strong> Congress<br />
Hous<strong>in</strong>g <strong>Afford</strong>ability and Disability<br />
2008 2010<br />
Non Elderly Adults with Disabilities Receiv<strong>in</strong>g SSI Benefits 8,555 9,253<br />
SSI as a Percentage of One Person Median Income 16.6% 16.6%<br />
Percent of SSI Needed <strong>to</strong> Rent a 1‐BR Hous<strong>in</strong>g Unit 122.3% 123%<br />
Percent of SSI Needed <strong>to</strong> Rent an Efficiency Hous<strong>in</strong>g Unit 108.6% 109%<br />
SSI as an Hourly Wage $3.68 $3.89<br />
Source: Priced Out <strong>in</strong> 2008 and Priced Out <strong>in</strong> 2010
Hous<strong>in</strong>gForAll.org | <strong>Delaware</strong> Hous<strong>in</strong>g <strong>Coalition</strong> | WhyNIMBY.org 3<br />
Independence, Integration, Choice<br />
Elders<br />
As the population ages – with 30% of <strong>Delaware</strong>’s<br />
population projected <strong>to</strong> be over<br />
60 by 2040 – the number of <strong>Delaware</strong>ans<br />
with disabilities and special hous<strong>in</strong>g needs<br />
will <strong>in</strong>crease significantly.<br />
The ag<strong>in</strong>g population has, <strong>in</strong> common<br />
with the other groups with these hous<strong>in</strong>g<br />
needs, a lack of resources, a critical hous<strong>in</strong>g<br />
cost burden, and a desire <strong>to</strong> rema<strong>in</strong><br />
<strong>in</strong>dependent and part of a traditi0nal<br />
community and not be <strong>in</strong>stitutionalized.<br />
It also faces a number of problems related<br />
<strong>to</strong> hous<strong>in</strong>g and <strong>in</strong>come.<br />
Extremely low‐<strong>in</strong>come residents and social<br />
security recipients cannot afford an<br />
efficiency apartment anywhere <strong>in</strong> the<br />
state.<br />
A high proportion of low‐<strong>in</strong>come elderly<br />
renters (58%) and homeowners (67%)<br />
have “hous<strong>in</strong>g problems”: lack of complete<br />
kitchen facilities, lack of complete<br />
plumb<strong>in</strong>g facilities, hav<strong>in</strong>g more than 1<br />
person per room, and hav<strong>in</strong>g a cost burden<br />
over 30%.<br />
Over 15,000 very low‐<strong>in</strong>come elderly<br />
households (both renter and owner) have<br />
hous<strong>in</strong>g cost burdens above 30% of their<br />
<strong>in</strong>comes. And more than 7,500 have severe<br />
cost burdens above 50% of their <strong>in</strong>come.<br />
Manufactured Home Owners<br />
About 70,000 <strong>Delaware</strong>ans live <strong>in</strong> 41,000<br />
manufactured homes. These comprise 10%<br />
of <strong>Delaware</strong>’s hous<strong>in</strong>g s<strong>to</strong>ck (DSHA, December<br />
2008).<br />
In <strong>Delaware</strong>, 50% of manufactured homeowners<br />
live on leased land, a higher rate<br />
than national estimates of 30‐35%. This<br />
arrangement raises a cont<strong>in</strong>ual question<br />
about the security of tenure and possible<br />
loss of equity that can come with sudden<br />
dislocation due <strong>to</strong> a community closure or<br />
steep lot rent hike. Inves<strong>to</strong>r‐owned communities<br />
‐‐ regardless of how well‐run or<br />
how well‐<strong>in</strong>tentioned the land owners,<br />
place manufactured home owners <strong>in</strong> a<br />
precarious position.<br />
Manufactured Hous<strong>in</strong>g <strong>in</strong> <strong>Delaware</strong> has<br />
proven <strong>to</strong> be a truly affordable hous<strong>in</strong>g<br />
option. Yet <strong>to</strong>o many of the owners of<br />
manufactured homes are also renters of<br />
their land, and thereby are subject <strong>to</strong><br />
great uncerta<strong>in</strong>ty.<br />
Low‐Income <strong>Delaware</strong> Homeowner Households<br />
That Have a Member with a Disability or <strong>Who</strong> is Elderly<br />
Source: “Community and Choice,” April 2012 and HUD 2006 ‐2008 CHAS Data<br />
<strong>Delaware</strong> Manufactured Homes by County<br />
Source: MH <strong>in</strong> <strong>Delaware</strong>, DSHA 2008<br />
<strong>Delaware</strong> Manufactured Homes Population by County<br />
Source: MH <strong>in</strong> <strong>Delaware</strong>, DSHA 2008
4<br />
<strong>Who</strong> <strong>Can</strong> <strong>Afford</strong> <strong>to</strong> <strong>Live</strong> <strong>in</strong> <strong>Delaware</strong><br />
Rental Hous<strong>in</strong>g <strong>Afford</strong>ability Gap<br />
Rent <strong>Afford</strong>able <strong>to</strong> ELI (
Hous<strong>in</strong>gForAll.org | <strong>Delaware</strong> Hous<strong>in</strong>g <strong>Coalition</strong> | WhyNIMBY.org 5<br />
Home Ownership and Foreclosures<br />
Homeownership <strong>Afford</strong>ability Gaps by County, 2006 ‐ 2010<br />
destatehous<strong>in</strong>g.com, 2011<br />
bundled" mortgages make ownership<br />
identification problematic.<br />
Tight credit guidel<strong>in</strong>es and the uncerta<strong>in</strong>ty<br />
of the s<strong>in</strong>gle family home ownership<br />
market have also made mortgage companies<br />
reluctant <strong>to</strong> foreclose <strong>in</strong> greater volume<br />
on homes that cannot be resold.<br />
F<strong>in</strong>ally, the job market is still a major fac<strong>to</strong>r<br />
contribut<strong>in</strong>g <strong>to</strong> home owners fac<strong>in</strong>g<br />
foreclosure.<br />
<strong>Delaware</strong> has experienced 26,000 foreclosures<br />
<strong>in</strong> the past five years, and the<br />
number of homes sold at sheriff’s sales<br />
<strong>in</strong>creased 35 percent from 2010 <strong>to</strong> 2011,<br />
accord<strong>in</strong>g <strong>to</strong> a June 2012 announcement<br />
from the office of Governor Markell.<br />
The Role of Residential Segregation<br />
A 2011 study of the Racial Dimensions of<br />
the Foreclosure Crisis found residential<br />
segregation <strong>to</strong> be a powerful predic<strong>to</strong>r of<br />
the number and rate of foreclosures <strong>in</strong><br />
the nation. “Racial segregation, discrim<strong>in</strong>a<strong>to</strong>ry<br />
lend<strong>in</strong>g, and an overheated hous<strong>in</strong>g<br />
market comb<strong>in</strong>ed <strong>to</strong> leave m<strong>in</strong>ority<br />
group members and neighborhoods<br />
uniquely vulnerable <strong>to</strong> the hous<strong>in</strong>g<br />
bust.” (Racial Dimensions, 2011).<br />
Comparison of Median Income & Median Hous<strong>in</strong>g Prices 2000 & 2011<br />
Home Price/<br />
Median<br />
Median<br />
Income Ratio<br />
Household Income Hous<strong>in</strong>g Price<br />
2000 2011 2000 (Q4) 2011 2000 2011<br />
Kent $40,950 $62,000 $114,575 $165,000 2.8 2.7<br />
New Castle $52,514 $80,400 $151,600 $183,000 2.9 2.3<br />
Sussex $39,208 $61,300 $164,650 $255,000 4.2 4.2<br />
Source: Out of Reach 2012, www,nlihc..org; DSHA, http://www.destatehous<strong>in</strong>g.com/<br />
<strong>Delaware</strong> Foreclosure Fil<strong>in</strong>gs, 2000 ‐ 2011<br />
Source: destatehous<strong>in</strong>g.com
6<br />
<strong>Who</strong> <strong>Can</strong> <strong>Afford</strong> <strong>to</strong> <strong>Live</strong> <strong>in</strong> <strong>Delaware</strong><br />
Income, Employment, and Wealth:<br />
The M<strong>in</strong>imum Wage<br />
A full‐time year‐round worker at the m<strong>in</strong>imum<br />
wage ($7.25/hour) cannot meet the<br />
most basic need for hous<strong>in</strong>g. In reality it<br />
takes work<strong>in</strong>g 103 hours a week<br />
(equivalent <strong>to</strong>2.6 full‐time year‐round<br />
jobs) at the m<strong>in</strong>imum wage <strong>in</strong> order <strong>to</strong><br />
afford a modest two‐bedroom apartment<br />
<strong>in</strong> <strong>Delaware</strong> (NLIHC, 2012).<br />
The value of the m<strong>in</strong>imum wage relative<br />
<strong>to</strong> the poverty l<strong>in</strong>e peaked <strong>in</strong> 1968 at 90%;<br />
it has averaged 2/3 of poverty s<strong>in</strong>ce 1959<br />
when the poverty l<strong>in</strong>e was established.<br />
(M<strong>in</strong>imum Wage, 2009)<br />
NLIHC Hous<strong>in</strong>g Wage<br />
As developed by the National Low Income<br />
Hous<strong>in</strong>g <strong>Coalition</strong>, the hous<strong>in</strong>g wage<br />
is the <strong>in</strong>come needed <strong>in</strong> order <strong>to</strong> pay no<br />
more than 30% of monthly <strong>in</strong>come on<br />
hous<strong>in</strong>g costs. The 2012 statewide hous<strong>in</strong>g<br />
wage <strong>in</strong> <strong>Delaware</strong> is $18.65/hour.<br />
There is a gap <strong>in</strong> each county between<br />
what the m<strong>in</strong>imum wage earner can<br />
afford and the rent needed for even an<br />
efficiency (0‐BR) apartment.<br />
Projected Job Growth<br />
Of the <strong>to</strong>p 10 projected job growth categories<br />
between 2008 and 2018, eight of<br />
them are <strong>in</strong> the “Low Wage” (≤ $28,800/<br />
year) category (DE DOL, 2011). In New<br />
Castle and Sussex Counties the proportion<br />
of jobs pay<strong>in</strong>g less than those counties’<br />
hous<strong>in</strong>g wage is 58% and 60% respectively.<br />
In Kent County 50% of the jobs pay<br />
less than the county hous<strong>in</strong>g wage.<br />
An Unmet Basic Human Need<br />
The share of work<strong>in</strong>g households with<br />
severe cost‐burden rema<strong>in</strong>ed at 21% from<br />
2008 <strong>to</strong> 2009 (Wardrip, 2011). Wages and<br />
basic human needs are <strong>in</strong>tertw<strong>in</strong>ed.<br />
Beyond the Mounta<strong>in</strong><strong>to</strong>p: K<strong>in</strong>g's Prescription<br />
for Poverty by Steven C. Pitts (UC‐<br />
Berkeley Center for Labor Research and<br />
Education) and William E. Spriggs<br />
(Howard University Department of Economics)<br />
reveals that dramatic progress <strong>in</strong><br />
address<strong>in</strong>g poverty occurred dur<strong>in</strong>g a four<br />
‐year period,1965–1969. They attribute<br />
the ga<strong>in</strong>s made <strong>to</strong> a comb<strong>in</strong>ation of fac<strong>to</strong>rs,<br />
<strong>in</strong>clud<strong>in</strong>g new emphasis on full employment<br />
and <strong>in</strong>come security, <strong>in</strong>creases<br />
<strong>in</strong> the m<strong>in</strong>imum wage, strong support for<br />
labor’s right <strong>to</strong> organize, and a deeper<br />
commitment <strong>to</strong> combat<strong>in</strong>g discrim<strong>in</strong>ation<br />
<strong>in</strong> the workplace.<br />
Number and Share of Workers Earn<strong>in</strong>g Less than the Hous<strong>in</strong>g Wage<br />
All Jobs * Hous<strong>in</strong>g Wage Jobs at less than the Hous<strong>in</strong>g Wage<br />
# %<br />
Kent 59,070 $15.65 22,610 50<br />
New Castle** 318,990 $20.67 150,950 58<br />
Sussex 69,590 $14.31 35,650 60<br />
* Includes all jobs <strong>in</strong> area, whether or not surveyed for wages<br />
**Wilm<strong>in</strong>g<strong>to</strong>n, DE‐MD‐NJ Metropolitan Division Source: <strong>Delaware</strong> Wages 2011://<br />
www.delawareworks.com/oomli; Out Of Reach 2012 http://nlihc.org/oor/2012/DE<br />
M<strong>in</strong>imum, Median, and Hous<strong>in</strong>g Wages by County<br />
All workers<br />
M<strong>in</strong>imum wage Median wage Hous<strong>in</strong>g wage<br />
Kent 59,070 $7.25 $15.74 $15.65<br />
New Castle* 318,990 $7.25 $19.07 $20.67<br />
Sussex 69,590 $7.25 $13.66 $14.31<br />
Source: <strong>Delaware</strong> Wages 2011://www.delawareworks.com/oolmi<br />
http://nlihc.org/oor/2012/DE<br />
“In the 1960s, the three large scale structural<br />
solutions – stronger civil rights laws,<br />
higher federal m<strong>in</strong>imum wages, and <strong>in</strong>creased<br />
unionization – were implemented<br />
as the economy was expand<strong>in</strong>g, <strong>in</strong><br />
ways that enabled people at all <strong>in</strong>come<br />
strata <strong>to</strong> benefit.” (Beyond, 2008)<br />
Income and Wealth<br />
Accord<strong>in</strong>g <strong>to</strong> The State of the Nation’s<br />
Hous<strong>in</strong>g 2012, “Real net household<br />
wealth plummeted $14.3 trillion from<br />
Zero‐ and One‐Bedroom Hous<strong>in</strong>g Wage<br />
Out of Reach 2012<br />
2006 <strong>to</strong> 2011, dragged down by a 57‐<br />
percent drop ($8.2 trillion) <strong>in</strong> hous<strong>in</strong>g<br />
wealth.” It reports that the dive <strong>in</strong> hous<strong>in</strong>g<br />
values hurt low‐<strong>in</strong>come and m<strong>in</strong>ority<br />
households worst, because prices fell<br />
most dramatically <strong>in</strong> the lower end of the<br />
hous<strong>in</strong>g market and because home equity<br />
made up a larger share of household<br />
wealth for m<strong>in</strong>ority households, as the<br />
hous<strong>in</strong>g bust began.
Hous<strong>in</strong>gForAll.org | <strong>Delaware</strong> Hous<strong>in</strong>g <strong>Coalition</strong> | WhyNIMBY.org 7<br />
Inequality Hurts Us All<br />
N<strong>in</strong>ety‐N<strong>in</strong>e <strong>to</strong> One<br />
S<strong>in</strong>ce the mid‐Twentieth Century, there<br />
has been an <strong>in</strong>creas<strong>in</strong>g trend <strong>to</strong>ward <strong>in</strong>equality<br />
of wealth and <strong>in</strong>come. This translates<br />
<strong>in</strong><strong>to</strong> dim<strong>in</strong>ished opportunity and<br />
well‐be<strong>in</strong>g for the great majority.<br />
Chuck Coll<strong>in</strong>s is co‐founder of Wealth for<br />
the Common Good, a network of bus<strong>in</strong>ess<br />
leaders, high‐<strong>in</strong>come households<br />
and partners work<strong>in</strong>g <strong>to</strong>gether <strong>to</strong> promote<br />
shared prosperity and fair taxation.<br />
Accord<strong>in</strong>g <strong>to</strong> Coll<strong>in</strong>s:<br />
“The richest 1 percent now owns over<br />
36 percent of all the wealth <strong>in</strong> the<br />
United States. That’s more than the<br />
net worth of the bot<strong>to</strong>m 95 percent<br />
comb<strong>in</strong>ed. This 1 percent has pocketed<br />
almost all of the wealth ga<strong>in</strong>s of<br />
the last decade.<br />
In 2010, the 1 percent earned 21 percent<br />
of all <strong>in</strong>come, up from only 8<br />
percent <strong>in</strong> mid‐1970s. The 400 wealthiest<br />
<strong>in</strong>dividuals on the Forbes 400 list<br />
have more wealth than the bot<strong>to</strong>m<br />
150 million Americans.<br />
These trends among the 1 percent<br />
are bad for the rest of us. Concentrated<br />
wealth translates <strong>in</strong><strong>to</strong> political<br />
clout — the power <strong>to</strong> use campaign<br />
contributions <strong>to</strong> rent politicians and<br />
tilt the rules of the economy <strong>in</strong> their<br />
favor.”<br />
Racial Disparities<br />
People of color have, and cont<strong>in</strong>ue, <strong>to</strong><br />
experience a disproportionate gap <strong>in</strong><br />
<strong>in</strong>come and wealth.<br />
Organizations such as United for a Fair<br />
Economy (UFE) emphasize the his<strong>to</strong>ric<br />
and current barriers <strong>to</strong> "wealth and<br />
wealth‐build<strong>in</strong>g strategies among communities<br />
struggl<strong>in</strong>g <strong>to</strong> atta<strong>in</strong> greater economic<br />
equality." Each year UFE releases a<br />
report on the "state of the dream," <strong>in</strong><br />
honor of Dr. Mart<strong>in</strong> Luther K<strong>in</strong>g, Jr., that<br />
"exam<strong>in</strong>es the state of racial <strong>in</strong>equality <strong>in</strong><br />
America as it relates <strong>to</strong> contemporary<br />
political issues, such as foreclosure, the<br />
austerity agenda, and unemployment."<br />
The Spirit Level<br />
Recently, the discussion of <strong>in</strong>come (and<br />
wealth) <strong>in</strong>equality has been significantly<br />
broadened by new research that <strong>in</strong>dicates<br />
that the effects of <strong>in</strong>equality accrue<br />
<strong>to</strong> everyone <strong>in</strong> an unequal society, not<br />
just the most disadvantaged.<br />
The Real Value of the M<strong>in</strong>imum Wage, 1960 ‐ 2010<br />
www.stateofwork<strong>in</strong>gamerica.org<br />
Top Occupations and Employment Increase 2008‐2018*<br />
Median earn<strong>in</strong>gs<br />
(2011) hour/annum<br />
Availability Wage<br />
Category<br />
1. Retail Sales $9.73/$20,2038 E Low<br />
2. Cashiers $9.13/ $18,990 E Low<br />
3. Waiters/Waitresses $10.03/$20,862 E Low<br />
4. Registered Nurses $34.50/$71,760 E High<br />
5. Cus<strong>to</strong>mer Service Reps $17.34/$36,067 E ‐Avg.<br />
6. Servers, food prep<br />
$9.50/ $19.760 E Low<br />
(<strong>in</strong>clud<strong>in</strong>g fast food)<br />
7. Cafeteria/Counter Attendants $10.30/ $21,424 E Low<br />
8. Laborers, Freight, S<strong>to</strong>ck,<br />
$11.91/$24,773 G ‐Avg.<br />
Material Movers<br />
9. S<strong>to</strong>ck Clerks and Order Fillers $10.20/ $21,216 E Low<br />
10. Nurs<strong>in</strong>g Aides, Orderlies,<br />
Attendants<br />
$13.32/$27,706 E Low<br />
* In descend<strong>in</strong>g order<br />
Column: Job Availability Categories/Year: Poor=0;Fair 1‐3;Good=4‐14;Excellent >15<br />
Column: Wage Categories: Low:≤$28,800;‐Average$28,800‐$36,800;Average:$36,801‐$49,850;<br />
Above Average:$49,801‐$66,300;High:≥$66,301<br />
Source: http://www.delawareworks.com/oolmi/Information/Publications/<strong>Delaware</strong>.aspx (Oc<strong>to</strong>ber<br />
2010) ; <strong>Delaware</strong> Wages 2011://www.delawareworks.com/oomli<br />
The Spirit Level: Why Greater Equality<br />
Makes Societies Stronger by Richard Wilk<strong>in</strong>son<br />
and Kate Pickett (and the companion<br />
website www.equalitytrust.org.uk)<br />
provides evidence on each of eleven<br />
different health and social problems:<br />
physical health, mental health, drug<br />
abuse, education, imprisonment, obesity,<br />
social mobility, trust and community life,<br />
violence, teenage births, and child wellbe<strong>in</strong>g,<br />
f<strong>in</strong>d<strong>in</strong>g “outcomes are very substantially<br />
worse <strong>in</strong> more unequal societies”<br />
for all eleven of them.<br />
The authors f<strong>in</strong>d that <strong>in</strong>equality affects<br />
the vast majority of the population ‐ not<br />
just the poorest. View<strong>in</strong>g the prevalence<br />
of these problems, the author’s found<br />
that some problems are two or three<br />
times as common <strong>in</strong> more unequal societies,<br />
but others are as much as ten times<br />
as common. This means that all levels of<br />
society are suffer<strong>in</strong>g from these problems<br />
more <strong>in</strong> the more unequal societies.
8<br />
<strong>Who</strong> <strong>Can</strong> <strong>Afford</strong> <strong>to</strong> <strong>Live</strong> <strong>in</strong> <strong>Delaware</strong><br />
Hous<strong>in</strong>g <strong>to</strong> Strengthen Community and Build Opportunity<br />
The Fair Share Hous<strong>in</strong>g Measure uses the<br />
needs of extremely low‐<strong>in</strong>come <strong>Delaware</strong><br />
households with unaffordable hous<strong>in</strong>g<br />
cost burdens as its basis. It describes the<br />
additional affordable hous<strong>in</strong>g units that a<br />
community would need <strong>to</strong> make available<br />
<strong>in</strong> order for that community <strong>to</strong> bear an<br />
equitable geographic share of the <strong>to</strong>tal<br />
need.<br />
Surplus and Deficit Census Tracts<br />
An analysis of the geographic distribution<br />
of affordable rental hous<strong>in</strong>g by the <strong>Delaware</strong><br />
Hous<strong>in</strong>g <strong>Coalition</strong>, us<strong>in</strong>g 2000 Census<br />
data, showed only 13 of 317 census<br />
tracts (4%) with clear surpluses. Almost<br />
half of all tracts (47%) fell <strong>in</strong><strong>to</strong> the borderl<strong>in</strong>e<br />
category somewhere between a deficit<br />
of ‐ 25 and a surplus of +25. 156 tracts<br />
(49%) had clear deficits. The tract with the<br />
highest surplus (+118) was then <strong>in</strong> Claymont<br />
and the one with the highest deficit<br />
was <strong>in</strong> Upper Christiana (‐ 173). The median<br />
for all census tracts was ‐ 25.<br />
Net Need<br />
After count<strong>in</strong>g the extremely low‐<strong>in</strong>come<br />
hous<strong>in</strong>g need, the Fair Share Hous<strong>in</strong>g<br />
Measure compensated for units affordable<br />
and available <strong>in</strong> each census tract. This<br />
still left a need for 9,186 assisted hous<strong>in</strong>g<br />
opportunities throughout the state.<br />
Counties<br />
By county, the need broke down as<br />
shown <strong>in</strong> the accompany<strong>in</strong>g chart, reveal<strong>in</strong>g<br />
a disproportionate need for more<br />
affordable hous<strong>in</strong>g for extremely low<strong>in</strong>come<br />
households <strong>in</strong> Sussex County.<br />
Equitable Distribution<br />
A set of recommendations designed <strong>to</strong><br />
create a more equitable distribution of<br />
affordable hous<strong>in</strong>g throughout <strong>Delaware</strong><br />
must be sensitive <strong>to</strong> a number of fac<strong>to</strong>rs,<br />
one of which is the need <strong>to</strong> build with<strong>in</strong><br />
recognized “growth zones.” The use of<br />
permanently affordable hous<strong>in</strong>g mechanisms,<br />
such as the community land trust<br />
(CLT), <strong>to</strong> acquire and ma<strong>in</strong>ta<strong>in</strong> an <strong>in</strong>ven<strong>to</strong>ry<br />
of affordable hous<strong>in</strong>g opportunities<br />
outside of these growth zones can be an<br />
important strategy for better geographic<br />
distribution of affordable homes.<br />
Property Values and NIMBYism<br />
One major objection <strong>to</strong> affordable hous<strong>in</strong>g<br />
is often that its development will be<br />
detrimental <strong>to</strong> s<strong>in</strong>gle‐family property values<br />
<strong>in</strong> the neighborhood where it is <strong>to</strong> be<br />
situated.<br />
Surplus and Deficit Census Tracts, Fair Share Hous<strong>in</strong>g Measure<br />
Deficits by County, Fair Share Hous<strong>in</strong>g Measure<br />
In an article <strong>in</strong> the Spr<strong>in</strong>g 2010 issue of<br />
The Hous<strong>in</strong>g Journal, Professor Rachel<br />
Bratt, of the Department of Urban and<br />
Environmental Policy and Plann<strong>in</strong>g at<br />
Tufts University, reviewed numerous<br />
examples of recent research on just this<br />
question. She began with a description<br />
of the problem: “Invariably, there is local<br />
opposition <strong>to</strong> the development of multifamily<br />
hous<strong>in</strong>g, particularly hous<strong>in</strong>g that<br />
is targeted for a lower <strong>in</strong>come population.<br />
The phrase that is often used <strong>to</strong><br />
express this opposition is known as<br />
NIMBY, mean<strong>in</strong>g “Not In My Back Yard.”<br />
Opponents <strong>to</strong> subsidized hous<strong>in</strong>g developments<br />
often <strong>in</strong>voke the likelihood that<br />
the new hous<strong>in</strong>g will create a number of<br />
problems, such as <strong>in</strong>creased traffic, burdens<br />
on the local school systems due <strong>to</strong><br />
DHC Fair Share Hous<strong>in</strong>g Measure<br />
an <strong>in</strong>creased student population, the<br />
possibility of <strong>in</strong>creased crime, and a fear<br />
that property values of neighbor<strong>in</strong>g<br />
homes will be reduced.”<br />
Review<strong>in</strong>g a range of studies by US researchers,<br />
she concluded that “it appears<br />
that if hous<strong>in</strong>g is well designed, fits <strong>in</strong><br />
with the surround<strong>in</strong>g neighborhood, and<br />
is managed well, there are no negative<br />
impacts of affordable hous<strong>in</strong>g on the<br />
property values of neighbor<strong>in</strong>g s<strong>in</strong>gle<br />
family homes. In addition, <strong>in</strong> view of the<br />
serious need for affordable hous<strong>in</strong>g, the<br />
public sec<strong>to</strong>r can play a positive role <strong>in</strong><br />
provid<strong>in</strong>g local governments subsidies <strong>to</strong><br />
cover any additional costs that accompany<br />
the new hous<strong>in</strong>g.” (Bratt, 2010)
www.hous<strong>in</strong>gforall.org Hous<strong>in</strong>gForAll.org | <strong>Delaware</strong> Hous<strong>in</strong>g <strong>Coalition</strong> | www.whynimby.org<br />
WhyNIMBY.org 1<br />
Sources<br />
American Community Survey, 2005 ‐ 2009.<br />
ADAPT, 2010, http://www.adapt.org/<strong>in</strong>dex.php<br />
ARC of <strong>Delaware</strong>, 2010, http://<br />
www.thearcofdelaware.org/<br />
Basic Economic Security Tables ,<br />
www.ywcade.org), 2011.<br />
Rachel Bratt, “The Impact of <strong>Afford</strong>able Hous<strong>in</strong>g on<br />
Property Values: A Review of Key Studies,” http://<br />
whynimby.org/library.html#Community_Impact<br />
Calcula<strong>to</strong>r: www.mortgagecalcula<strong>to</strong>r.org<br />
Center for Neighborhood Technology (CNT), Penny<br />
Wise Pound Fuelish New Measures of Hous<strong>in</strong>g and<br />
Transportation <strong>Afford</strong>ability; March 2010<br />
CLT Network, 2010 ‐ www.cltnetwork.org<br />
CFED – Corporation For Enterprise Development,<br />
2007 Development Report Card on the States, 2008.<br />
Community and Choice: Hous<strong>in</strong>g Needs for People<br />
with Disabilities <strong>in</strong> <strong>Delaware</strong>, April 2012.<br />
2010‐2014 Comprehensive HIV Prevention Plan and<br />
Statewide Coord<strong>in</strong>ated Statement of Need, September<br />
2009, <strong>Delaware</strong> HIV Consortium,<br />
www.delawarehiv.org<br />
Connections, 2010, http://www.connectionscsp.org/<br />
John Emmeus Davis, The <strong>Afford</strong>able City: Toward a<br />
Third Sec<strong>to</strong>r Hous<strong>in</strong>g Policy, Temple University, 1994.<br />
DeGenova, Goodw<strong>in</strong>, Moriarty, Robitaille, “On the<br />
Ground: 40B Developments Before and After,” Tufts<br />
University, 2009, http://ase.tufts.edu/UEP/Degrees/<br />
field_project_reports/2009/Team_4_F<strong>in</strong>al_Report.pdf<br />
<strong>Delaware</strong> Department of Labor, Office of Occupational<br />
and Labor Market Information, found at<br />
www.oolmi.net.<br />
<strong>Delaware</strong> Foreclosure Help:<br />
www.deforeclosurehelp.org<br />
<strong>Delaware</strong> Hous<strong>in</strong>g <strong>Coalition</strong>, Invest<strong>in</strong>g <strong>to</strong> Meet<br />
<strong>Delaware</strong>’s <strong>Afford</strong>able Hous<strong>in</strong>g Needs: An Economic<br />
Impact Analysis, http://www.hous<strong>in</strong>gforall.org/F<strong>in</strong>al%<br />
20DE%20Economic%20Impact%20Study%20November%<br />
202004.pdf<br />
<strong>Delaware</strong> Hous<strong>in</strong>g <strong>Coalition</strong> ‐ The Realities of Poverty<br />
<strong>in</strong> <strong>Delaware</strong>, 2007 ‐ 2008, November 2008.<br />
<strong>Delaware</strong> Hous<strong>in</strong>g <strong>Coalition</strong> ‐ The Realities of Poverty<br />
<strong>in</strong> <strong>Delaware</strong>, 2009 ‐ 2010, November 2010.<br />
<strong>Delaware</strong> State Consortium, <strong>Delaware</strong> State Analysis<br />
of Impediments <strong>to</strong> Fair Hous<strong>in</strong>g Choice, F<strong>in</strong>al Draft,<br />
April 2011, Mull<strong>in</strong> & Lonergan Associates, Inc.<br />
<strong>Delaware</strong> State Hous<strong>in</strong>g Authority, <strong>Delaware</strong> Hous<strong>in</strong>g<br />
Fact Sheet, <strong>Afford</strong>ability Gap, Q3 2011,<br />
destatehous<strong>in</strong>g.com.<br />
<strong>Delaware</strong> State Hous<strong>in</strong>g Authority, Hous<strong>in</strong>g Production<br />
Report, 2007.<br />
<strong>Delaware</strong> State Hous<strong>in</strong>g Authority, Statewide<br />
Hous<strong>in</strong>g Needs Assessment 2008‐2012, Mull<strong>in</strong>, Lonergan<br />
and Associates, November 2007, p.48.<br />
<strong>Delaware</strong> State Hous<strong>in</strong>g Authority ‐ Manufactured<br />
Hous<strong>in</strong>g <strong>in</strong> <strong>Delaware</strong>: A Summary of Information and<br />
Issues, DSHA, December 2008.<br />
Economic Policy Institute (EPI), M<strong>in</strong>imum Wage<br />
Issue Guide, http://www.epi.org/publications/entry/<br />
tables_figures_data/<br />
Ingrid Gould Ellen, “Spillovers and Subsidized<br />
Hous<strong>in</strong>g: The Impact of Subsidized Rental Hous<strong>in</strong>g on<br />
Neighborhoods,” <strong>in</strong> Rets<strong>in</strong>as and Belsky, eds., Revisit<strong>in</strong>g<br />
Rental Hous<strong>in</strong>g: Policies, Programs and Priorities,<br />
Brook<strong>in</strong>gs Institution Press, 2008<br />
Foster<strong>in</strong>g a Livable <strong>Delaware</strong>: A Five Year Strategic<br />
Hous<strong>in</strong>g Plan, http://www.hous<strong>in</strong>gforall.org/5YP%<br />
20Summary.pdf<br />
FIC ‐ Foremost Insurance Company, Market Facts<br />
Report 2005, triennial report on manufactured hous<strong>in</strong>g<br />
<strong>in</strong>dustry by its lead<strong>in</strong>g <strong>in</strong>surer.<br />
Galster, Levy, Sawyer, Temk<strong>in</strong>, Walker, “The Impact<br />
of Community Development Corporations on<br />
Urban Neighborhoods,” Urban Institute, 2005, http://<br />
www.urban.org/UploadedPDF/311217_CDCs.pdf<br />
“Hous<strong>in</strong>g <strong>Afford</strong>ability Trends for Work<strong>in</strong>g Households:<br />
<strong>Afford</strong>ability Worsens Despite Decl<strong>in</strong>e <strong>in</strong> Home<br />
Prices”; Keith Wardrip; Center for Hous<strong>in</strong>g Policy;<br />
December 2009<br />
Homeless Plann<strong>in</strong>g Council of <strong>Delaware</strong>, Po<strong>in</strong>t <strong>in</strong><br />
Time Studies, 2006 ‐ 2012, www.hpcdelaware.org.<br />
Jo<strong>in</strong>t Center for Hous<strong>in</strong>g Studies, State of the<br />
Nation’s Hous<strong>in</strong>g, Harvard University, 2012.<br />
Howard Karger, “Question<strong>in</strong>g Low‐Income Homeownership,”<br />
The Realities of Poverty <strong>in</strong> <strong>Delaware</strong>,<br />
2007‐2008, http://www.hous<strong>in</strong>gforall.org/<br />
ROP0708_100608_onl<strong>in</strong>e.pdf<br />
Rosal<strong>in</strong>d Kotz, Hous<strong>in</strong>g Needs of Extremely Low<br />
Income Households <strong>in</strong> <strong>Delaware</strong>, Center for Community<br />
Research and Service, University of <strong>Delaware</strong>,<br />
November 2007.<br />
Lexis‐Nexis: Foreclosure Fill<strong>in</strong>gs Database as compiled<br />
by the <strong>Delaware</strong> State Hous<strong>in</strong>g Authority, 2011.<br />
Mak<strong>in</strong>g Home <strong>Afford</strong>able: www.Mak<strong>in</strong>g Home<br />
<strong>Afford</strong>able.gov<br />
Douglas Massey and Jacob Rugh, Racial Dimensions<br />
of the Foreclosure Crisis, Woodrow Wilson School of<br />
Pr<strong>in</strong>ce<strong>to</strong>n University, 2011.<br />
M<strong>in</strong>imum Wage ‐ oregonstate.edu/<strong>in</strong>struct/<br />
anth484/m<strong>in</strong>wage/htm<br />
M<strong>in</strong>imum Wage ‐ stateofwork<strong>in</strong>gamerica.org<br />
National Association of Real<strong>to</strong>rs, House Prices <strong>in</strong><br />
America, Wash<strong>in</strong>g<strong>to</strong>n DC, 2008.<br />
Nguyen, “Does <strong>Afford</strong>able Hous<strong>in</strong>g Detrimentally<br />
Affect Property Values A Review of the Literature,”<br />
Journal of Plann<strong>in</strong>g Literature, 2005 (http://<br />
jpl.sagepub.com/cgi/content/abstract/20/1/15<br />
National Hous<strong>in</strong>g Conference, Paycheck <strong>to</strong><br />
Paycheck, Wash<strong>in</strong>g<strong>to</strong>n DC, February 2008.<br />
National Low Income Hous<strong>in</strong>g <strong>Coalition</strong>, Congressional<br />
District Hous<strong>in</strong>g Profiles, www.nlihc.org<br />
National Low Income Hous<strong>in</strong>g <strong>Coalition</strong>, Out of<br />
Reach, 2011 ‐ National Low Income Hous<strong>in</strong>g <strong>Coalition</strong>,<br />
www.nlihc.org<br />
Parrott, S. (2008). Recession Could Cause Large<br />
Increases <strong>in</strong> Poverty and Push Millions <strong>in</strong><strong>to</strong> Deep Poverty.<br />
Wash<strong>in</strong>g<strong>to</strong>n, D.C.: Center for Budget and Policy<br />
Priorities. (http://www.cbpp.org/11‐24‐08pov.pdf)<br />
Pelletiere, D., & Wardrip, K.E (2006). Recent Data<br />
Shows Cont<strong>in</strong>uation, Acceleration of Hous<strong>in</strong>g <strong>Afford</strong>ability<br />
Crisis (Research Note #06‐05). Wash<strong>in</strong>g<strong>to</strong>n, D.C.:<br />
National Low Income Hous<strong>in</strong>g <strong>Coalition</strong>. Also: Rice, D.<br />
& Sard, B. (2009). Decade of Neglect has Weakened<br />
Federal Low‐Income Hous<strong>in</strong>g Programs. Wash<strong>in</strong>g<strong>to</strong>n,<br />
D.C.: Center on Budget and Policy Priorities.<br />
Steven C. Pitts (UC‐Berkeley Center for Labor Research<br />
and Education) and William E. Spriggs, Beyond<br />
the Mounta<strong>in</strong><strong>to</strong>p: K<strong>in</strong>g's Prescription for Poverty<br />
(Howard University Department of Economics), April<br />
2008. http://laborcenter.berkeley.edu/blackworkers/<br />
mounta<strong>in</strong><strong>to</strong>p_report.pdf<br />
Pollakowski, Ritchay, We<strong>in</strong>robe, “Effects of Mixed‐<br />
Income, Multi‐Family Rental Hous<strong>in</strong>g Developments<br />
on S<strong>in</strong>gle‐Family Hous<strong>in</strong>g Values,” MIT Center for Real<br />
Estate, 2005, http://web.mit.edu/cre/research/hai/<br />
pdf/40B_report_HAI_0405.pdf<br />
PRB ‐ Population Reference Bureau, Study F<strong>in</strong>ds US<br />
Manufactured Home Owners Face ‘Quasi‐<br />
Homelessness,’ by Paola Scommegna, Oc<strong>to</strong>ber 2004.<br />
Report and Recommendations of the Work<strong>in</strong>g<br />
Group on Extremely Low‐Income Hous<strong>in</strong>g Needs,<br />
December 2009, http://www.hous<strong>in</strong>gforall.org/ELI%<br />
20WG%20F<strong>in</strong>al%20Report%20121409.pdf<br />
Technical Assistance Collaborative, Priced Out 2010:<br />
the Hous<strong>in</strong>g Crisis for People with Disabilities<br />
The Re<strong>in</strong>vestment Fund ‐ Mortgage Foreclosure<br />
Fil<strong>in</strong>gs <strong>in</strong> <strong>Delaware</strong>: A Study by The Re<strong>in</strong>vestment<br />
Fund for the Office of the State Bank Commissioner,<br />
June 2006.<br />
Lori Traw<strong>in</strong>ski, Nightmare on Ma<strong>in</strong> Street: Older<br />
Americans and the Mortgage Market Crisis, AARP<br />
Public Policy Institute, July 2012.<br />
TWP ‐ Mortgage Bankers Association cited <strong>in</strong> The<br />
Wash<strong>in</strong>g<strong>to</strong>n Post, March 6, 2008<br />
ULW— Universal Liv<strong>in</strong>g Wage Campaign, for more<br />
<strong>in</strong>formation, www.universalliv<strong>in</strong>gwage.org<br />
U. S. Census Bureau (June 2011), State and County<br />
QuickFacts.<br />
U.S. Census Bureau (2009). Income, Poverty and<br />
Health Insurance Coverage <strong>in</strong> the United States: 2008.<br />
Wash<strong>in</strong>g<strong>to</strong>n, D.C.: U.S. Census Bureau. (http://<br />
www.census.gov/hhes/www/poverty/<br />
poverty08.html)<br />
US Conference of Mayors and The Council for the<br />
New American City, The Mortgage Crisis: Economic and<br />
Fiscal Implications for Metro Areas, prepared by Global<br />
Insight, Lex<strong>in</strong>g<strong>to</strong>n MA, for November 26, 2007.<br />
U.S. Department of Hous<strong>in</strong>g and Urban Development,<br />
huduser.org, 2011.<br />
Sally Ward, Charlie French, and Kelly Giraud, Resident<br />
Owned Communities <strong>in</strong> New Hampshire: A Study<br />
of Outcomes, The Carsey Institute at the University of<br />
New Hampshire, November 2005; http://<br />
www.carsey<strong>in</strong>stitute.unh.edu/documents/<br />
evalution_report_nov20_2006.pdf<br />
Keith Wardrip, An Annual Look at the Hous<strong>in</strong>g<br />
<strong>Afford</strong>ability Challenges of America's Work<strong>in</strong>g Households;<br />
Center for Hous<strong>in</strong>g Policy, February 2011<br />
Richard Wilk<strong>in</strong>son and Kate Pickett, The Spirit Level.<br />
New York: Bloomsbury Press, 2010.
<strong>Who</strong> <strong>Can</strong> <strong>Afford</strong> <strong>to</strong> <strong>Live</strong> <strong>in</strong> <strong>Delaware</strong><br />
July 2012<br />
Research and Proofread<strong>in</strong>g:<br />
G<strong>in</strong>a Miserend<strong>in</strong>o<br />
Edit<strong>in</strong>g and Design:<br />
Ken Smith<br />
About Cover Statistics:<br />
HOMEOWNERS: <strong>Delaware</strong> State Hous<strong>in</strong>g Authority, U.S. Dept. of Hous<strong>in</strong>g and Urban<br />
Development. <strong>Afford</strong>ability is calculated for a household with an <strong>in</strong>come of 80%<br />
of Area Median Income with a mortgage at 5% for 30 years and $125/month for taxes<br />
and <strong>in</strong>surance and “other debt” of 12%.<br />
TENANTS: Out of Reach 2012, National Low Income Hous<strong>in</strong>g <strong>Coalition</strong>. M<strong>in</strong>imum<br />
wage <strong>in</strong> <strong>Delaware</strong> is $7.25. An extremely low <strong>in</strong>come household has an <strong>in</strong>come at or<br />
below 30% of the Area Median Income.<br />
For more <strong>in</strong>formation<br />
American Hous<strong>in</strong>g Survey Def<strong>in</strong>itions: www.census.gov/hhes/www/hous<strong>in</strong>g/ahs/ahs01/appendixa.pdf<br />
Census: http://www.census.gov/acs/www/Downloads/ACSQandA.pdf<br />
Center on Budget and Policy Priorities, http://www.cbpp.org<br />
FANNIEMAE: http://www.fanniemae.com/aboutfm/pdf/key_mortgage_terms_eng.pdf<br />
Hous<strong>in</strong>g Justice: http://www.hous<strong>in</strong>gjustice.org/beta/resources/affordable_hous<strong>in</strong>g_glossary<br />
HUD’s Glossary of Terms: www.hud.gov/offices/cpd/library/glossary/<br />
National Low Income Hous<strong>in</strong>g <strong>Coalition</strong>: http://www.nlihc.org<br />
Novgradac: http://www.ngrdc.org/cedschapter8.pdf<br />
ROC USA: http://www.rocusa.org/manufacturedhome.htm<br />
ONLINE HOUSING RESOURCES IN DELAWARE<br />
Listed below are some of the organizations <strong>in</strong> <strong>Delaware</strong> which are <strong>in</strong>volved <strong>in</strong><br />
provid<strong>in</strong>g <strong>in</strong>formation on the affordable hous<strong>in</strong>g crisis here.<br />
<strong>Delaware</strong> Hous<strong>in</strong>g <strong>Coalition</strong>: www.hous<strong>in</strong>gforall.org<br />
<strong>Delaware</strong> Community Re<strong>in</strong>vestment Action Council: www.dcrac.org<br />
<strong>Delaware</strong> Manufactured Home Owners Association: www.dmhoa.org<br />
<strong>Delaware</strong> State Hous<strong>in</strong>g Authority: www.destatehous<strong>in</strong>g.com<br />
Diamond State CLT: www.diamondstateclt.org<br />
Homeless Plann<strong>in</strong>g Council: www.hpcdelaware.org<br />
NCALL Research: www.ncall.org<br />
University of <strong>Delaware</strong>: www.udel.edu/ccrs/<br />
Why NOT In My Back Yard: www.whynimby.org<br />
<strong>Delaware</strong> Hous<strong>in</strong>g <strong>Coalition</strong><br />
PO Box 1633, Dover, <strong>Delaware</strong> 19903‐1633<br />
Phone: 302‐678‐2286 | Fax: 302‐678‐8645<br />
www.hous<strong>in</strong>gforall.org | www.whynimby.org<br />
Karen Curtis<br />
Bobbie Hemmerich<br />
Leslie Holland (Treasurer)<br />
Sara Keifer<br />
Patricia Kelleher (President)<br />
Jocelyn McBride<br />
Dorothy Medeiros<br />
<br />
BOARD OF DIRECTORS<br />
Joe L. Myer<br />
Veronica Oliver<br />
Brenda Osborne<br />
James Peffley<br />
Sandy Spence<br />
Susan Starrett (Vice President)<br />
Amy Walls (Secretary)<br />
AFFORDABLE HOUSING: The 30 Percent<br />
Rule of Thumb<br />
The 30 percent “rule of thumb” represents<br />
an evolution of empirical<br />
norms and public policy dat<strong>in</strong>g from<br />
the era of the Great Depression.<br />
Dur<strong>in</strong>g that period, “one week’s pay<br />
for one month’s rent” was the norm<br />
and was accepted. This formula was<br />
subsequently <strong>in</strong>corporated <strong>in</strong><strong>to</strong> public<br />
policy which both identified hous<strong>in</strong>g<br />
need and eventually, was used as<br />
a Hous<strong>in</strong>g Cost <strong>to</strong> Income Ratio<br />
(HCIR). We use the 30% rule here for<br />
simplicity and <strong>in</strong> order <strong>to</strong> compare <strong>to</strong><br />
other research <strong>in</strong>clud<strong>in</strong>g the previous<br />
editions of <strong>Who</strong> <strong>Can</strong> <strong>Afford</strong> <strong>to</strong><br />
<strong>Live</strong> <strong>in</strong> <strong>Delaware</strong><br />
For a thorough explanation of the<br />
his<strong>to</strong>ry and current proposed alternatives<br />
<strong>to</strong> the 30% rule of thumb, see<br />
Gett<strong>in</strong>g <strong>to</strong> the Heart of Hous<strong>in</strong>g’s Fundamental<br />
Question: How Much <strong>Can</strong> a<br />
Family <strong>Afford</strong> A Primer on Hous<strong>in</strong>g<br />
<strong>Afford</strong>ability Standards <strong>in</strong> U.S. Hous<strong>in</strong>g<br />
Policy by Danilo Pelletiere, Ph.D.<br />
February 2008 National Low Income<br />
Hous<strong>in</strong>g <strong>Coalition</strong>. http://<br />
www.nlihc.org/doc/<br />
<strong>Afford</strong>abilityResearchNote_2‐19‐<br />
08.pdf<br />
For an onl<strong>in</strong>e glossary of terms, go <strong>to</strong> www.whynimby.org.