Monolayer Behavior of NBD-Labeled Phospholipids at the Air/Water ...
Monolayer Behavior of NBD-Labeled Phospholipids at the Air/Water ...
Monolayer Behavior of NBD-Labeled Phospholipids at the Air/Water ...
- No tags were found...

You also want an ePaper? Increase the reach of your titles
YUMPU automatically turns print PDFs into web optimized ePapers that Google loves.
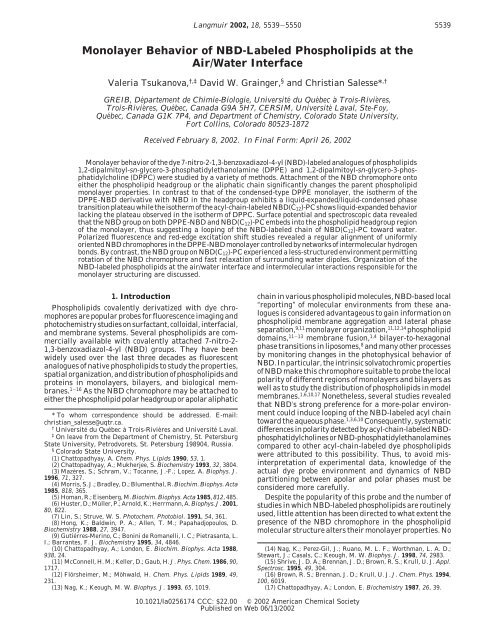
Langmuir 2002, 18, 5539-5550<br />
5539<br />
<strong>Monolayer</strong> <strong>Behavior</strong> <strong>of</strong> <strong>NBD</strong>-<strong>Labeled</strong> <strong>Phospholipids</strong> <strong>at</strong> <strong>the</strong><br />
<strong>Air</strong>/W<strong>at</strong>er Interface<br />
Valeria Tsukanova, †,‡ David W. Grainger, § and Christian Salesse* ,†<br />
GREIB, Département de Chimie-Biologie, Université du Québec à Trois-Rivières,<br />
Trois-Rivières, Québec, Canada G9A 5H7, CERSIM, Université Laval, Ste-Foy,<br />
Québec, Canada G1K 7P4, and Department <strong>of</strong> Chemistry, Colorado St<strong>at</strong>e University,<br />
Fort Collins, Colorado 80523-1872<br />
Received February 8, 2002. In Final Form: April 26, 2002<br />
<strong>Monolayer</strong> behavior <strong>of</strong> <strong>the</strong> dye 7-nitro-2-1,3-benzoxadiazol-4-yl (<strong>NBD</strong>)-labeled analogues <strong>of</strong> phospholipids<br />
1,2-dipalmitoyl-sn-glycero-3-phosph<strong>at</strong>idylethanolamine (DPPE) and 1,2-dipalmitoyl-sn-glycero-3-phosph<strong>at</strong>idylcholine<br />
(DPPC) were studied by a variety <strong>of</strong> methods. Attachment <strong>of</strong> <strong>the</strong> <strong>NBD</strong> chromophore onto<br />
ei<strong>the</strong>r <strong>the</strong> phospholipid headgroup or <strong>the</strong> aliph<strong>at</strong>ic chain significantly changes <strong>the</strong> parent phospholipid<br />
monolayer properties. In contrast to th<strong>at</strong> <strong>of</strong> <strong>the</strong> condensed-type DPPE monolayer, <strong>the</strong> iso<strong>the</strong>rm <strong>of</strong> <strong>the</strong><br />
DPPE-<strong>NBD</strong> deriv<strong>at</strong>ive with <strong>NBD</strong> in <strong>the</strong> headgroup exhibits a liquid-expanded/liquid-condensed phase<br />
transition pl<strong>at</strong>eau while <strong>the</strong> iso<strong>the</strong>rm <strong>of</strong> <strong>the</strong> acyl-chain-labeled <strong>NBD</strong>(C 12)-PC shows liquid-expanded behavior<br />
lacking <strong>the</strong> pl<strong>at</strong>eau observed in <strong>the</strong> iso<strong>the</strong>rm <strong>of</strong> DPPC. Surface potential and spectroscopic d<strong>at</strong>a revealed<br />
th<strong>at</strong> <strong>the</strong> <strong>NBD</strong> group on both DPPE-<strong>NBD</strong> and <strong>NBD</strong>(C 12)-PC embeds into <strong>the</strong> phospholipid headgroup region<br />
<strong>of</strong> <strong>the</strong> monolayer, thus suggesting a looping <strong>of</strong> <strong>the</strong> <strong>NBD</strong>-labeled chain <strong>of</strong> <strong>NBD</strong>(C 12)-PC toward w<strong>at</strong>er.<br />
Polarized fluorescence and red-edge excit<strong>at</strong>ion shift studies revealed a regular alignment <strong>of</strong> uniformly<br />
oriented <strong>NBD</strong> chromophores in <strong>the</strong> DPPE-<strong>NBD</strong> monolayer controlled by networks <strong>of</strong> intermolecular hydrogen<br />
bonds. By contrast, <strong>the</strong> <strong>NBD</strong> group on <strong>NBD</strong>(C 12)-PC experienced a less-structured environment permitting<br />
rot<strong>at</strong>ion <strong>of</strong> <strong>the</strong> <strong>NBD</strong> chromophore and fast relax<strong>at</strong>ion <strong>of</strong> surrounding w<strong>at</strong>er dipoles. Organiz<strong>at</strong>ion <strong>of</strong> <strong>the</strong><br />
<strong>NBD</strong>-labeled phospholipids <strong>at</strong> <strong>the</strong> air/w<strong>at</strong>er interface and intermolecular interactions responsible for <strong>the</strong><br />
monolayer structuring are discussed.<br />
1. Introduction<br />
<strong>Phospholipids</strong> covalently deriv<strong>at</strong>ized with dye chromophores<br />
are popular probes for fluorescence imaging and<br />
photochemistry studies on surfactant, colloidal, interfacial,<br />
and membrane systems. Several phospholipids are commercially<br />
available with covalently <strong>at</strong>tached 7-nitro-2-<br />
1,3-benzoxadiazol-4-yl (<strong>NBD</strong>) groups. They have been<br />
widely used over <strong>the</strong> last three decades as fluorescent<br />
analogues <strong>of</strong> n<strong>at</strong>ive phospholipids to study <strong>the</strong> properties,<br />
sp<strong>at</strong>ial organiz<strong>at</strong>ion, and distribution <strong>of</strong> phospholipids and<br />
proteins in monolayers, bilayers, and biological membranes.<br />
1-16 As <strong>the</strong> <strong>NBD</strong> chromophore may be <strong>at</strong>tached to<br />
ei<strong>the</strong>r <strong>the</strong> phospholipid polar headgroup or apolar aliph<strong>at</strong>ic<br />
* To whom correspondence should be addressed. E-mail:<br />
christian_salesse@uqtr.ca.<br />
† Université du Québec à Trois-Rivières and Université Laval.<br />
‡ On leave from <strong>the</strong> Department <strong>of</strong> Chemistry, St. Petersburg<br />
St<strong>at</strong>e University, Petrodvorets, St. Petersburg 198904, Russia.<br />
§ Colorado St<strong>at</strong>e University.<br />
(1) Ch<strong>at</strong>topadhyay, A. Chem. Phys. Lipids 1990, 53, 1.<br />
(2) Ch<strong>at</strong>topadhyay, A.; Mukherjee, S. Biochemistry 1993, 32, 3804.<br />
(3) Mazères, S.; Schram, V.; Tocanne, J.-F.; Lopez, A. Biophys. J.<br />
1996, 71, 327.<br />
(4) Morris, S. J.; Bradley, D.; Blumenthal, R. Biochim. Biophys. Acta<br />
1985, 818, 365.<br />
(5) Homan, R.; Eisenberg, M. Biochim. Biophys. Acta 1985, 812, 485.<br />
(6) Huster, D.; Müller, P.; Arnold, K.; Herrmann, A. Biophys. J. 2001,<br />
80, 822.<br />
(7) Lin, S.; Struve, W. S. Photochem. Photobiol. 1991, 54, 361.<br />
(8) Hong, K.; Baldwin, P. A.; Allen, T. M.; Papahadjopoulos, D.<br />
Biochemistry 1988, 27, 3947.<br />
(9) Gutiérres-Merino, C.; Bonini de Romanelli, I. C.; Pietrasanta, L.<br />
I.; Barrantes, F. J. Biochemistry 1995, 34, 4846.<br />
(10) Ch<strong>at</strong>topadhyay, A.; London, E. Biochim. Biophys. Acta 1988,<br />
938, 24.<br />
(11) McConnell, H. M.; Keller, D.; Gaub, H. J. Phys. Chem. 1986, 90,<br />
1717.<br />
(12) Flörsheimer, M.; Möhwald, H. Chem. Phys. Lipids 1989, 49,<br />
231.<br />
(13) Nag, K.; Keough, M. W. Biophys. J. 1993, 65, 1019.<br />
chain in various phospholipid molecules, <strong>NBD</strong>-based local<br />
“reporting” <strong>of</strong> molecular environments from <strong>the</strong>se analogues<br />
is considered advantageous to gain inform<strong>at</strong>ion on<br />
phospholipid membrane aggreg<strong>at</strong>ion and l<strong>at</strong>eral phase<br />
separ<strong>at</strong>ion, 9,11 monolayer organiz<strong>at</strong>ion, 11,12,14 phospholipid<br />
domains, 11-13 membrane fusion, 1,4 bilayer-to-hexagonal<br />
phase transitions in liposomes, 8 and many o<strong>the</strong>r processes<br />
by monitoring changes in <strong>the</strong> photophysical behavior <strong>of</strong><br />
<strong>NBD</strong>. In particular, <strong>the</strong> intrinsic solv<strong>at</strong>ochromic properties<br />
<strong>of</strong> <strong>NBD</strong> make this chromophore suitable to probe <strong>the</strong> local<br />
polarity <strong>of</strong> different regions <strong>of</strong> monolayers and bilayers as<br />
well as to study <strong>the</strong> distribution <strong>of</strong> phospholipids in model<br />
membranes. 1,6,10,17 None<strong>the</strong>less, several studies revealed<br />
th<strong>at</strong> <strong>NBD</strong>’s strong preference for a more-polar environment<br />
could induce looping <strong>of</strong> <strong>the</strong> <strong>NBD</strong>-labeled acyl chain<br />
toward <strong>the</strong> aqueous phase. 1,3,6,10 Consequently, system<strong>at</strong>ic<br />
differences in polarity detected by acyl-chain-labeled <strong>NBD</strong>phosph<strong>at</strong>idylcholines<br />
or <strong>NBD</strong>-phosph<strong>at</strong>idylethanolamines<br />
compared to o<strong>the</strong>r acyl-chain-labeled dye phospholipids<br />
were <strong>at</strong>tributed to this possibility. Thus, to avoid misinterpret<strong>at</strong>ion<br />
<strong>of</strong> experimental d<strong>at</strong>a, knowledge <strong>of</strong> <strong>the</strong><br />
actual dye probe environment and dynamics <strong>of</strong> <strong>NBD</strong><br />
partitioning between apolar and polar phases must be<br />
considered more carefully.<br />
Despite <strong>the</strong> popularity <strong>of</strong> this probe and <strong>the</strong> number <strong>of</strong><br />
studies in which <strong>NBD</strong>-labeled phospholipids are routinely<br />
used, little <strong>at</strong>tention has been directed to wh<strong>at</strong> extent <strong>the</strong><br />
presence <strong>of</strong> <strong>the</strong> <strong>NBD</strong> chromophore in <strong>the</strong> phospholipid<br />
molecular structure alters <strong>the</strong>ir monolayer properties. No<br />
(14) Nag, K.; Perez-Gil, J.; Ruano, M. L. F.; Worthman, L. A. D.;<br />
Stewart, J.; Casals, C.; Keough, M. W. Biophys. J. 1998, 74, 2983.<br />
(15) Shrive, J. D. A.; Brennan, J. D.; Brown, R. S.; Krull, U. J. Appl.<br />
Spectrosc. 1995, 49, 304.<br />
(16) Brown, R. S.; Brennan, J. D.; Krull, U. J. J. Chem. Phys. 1994,<br />
100, 6019.<br />
(17) Ch<strong>at</strong>topadhyay, A.; London, E. Biochemistry 1987, 26, 39.<br />
10.1021/la0256174 CCC: $22.00 © 2002 American Chemical Society<br />
Published on Web 06/13/2002
5540 Langmuir, Vol. 18, No. 14, 2002 Tsukanova et al.<br />
system<strong>at</strong>ic studies <strong>of</strong> <strong>the</strong> monolayer behavior <strong>of</strong> <strong>NBD</strong>labeled<br />
analogues <strong>of</strong> phosph<strong>at</strong>idylcholine and phosph<strong>at</strong>idylethanolamine<br />
have been reported. However, such a<br />
study could provide several important, new sets <strong>of</strong><br />
inform<strong>at</strong>ion, in particular (1) how <strong>the</strong> photophysical<br />
properties <strong>of</strong> <strong>NBD</strong> respond to local changes in polarity<br />
and intermolecular interactions as molecules are brought<br />
into close contact by monolayer compression and (2) an<br />
understanding <strong>of</strong> <strong>the</strong> fundamental organiz<strong>at</strong>ional properties<br />
<strong>of</strong> <strong>NBD</strong>-phospholipid probes <strong>at</strong> <strong>the</strong> air/w<strong>at</strong>er interface.<br />
The l<strong>at</strong>ter is, undoubtedly, important for correct use <strong>of</strong><br />
<strong>NBD</strong>-labeled analogues to elucid<strong>at</strong>e mechanisms <strong>of</strong> membrane<br />
processes, membrane structures, and dynamics.<br />
In this paper, we report monolayer behavior for both<br />
headgroup-labeled <strong>NBD</strong>-dipalmitoylphosph<strong>at</strong>idylethanolamine<br />
(DPPE-<strong>NBD</strong>) and <strong>the</strong> acyl-chain-labeled <strong>NBD</strong>dipalmitoylphosph<strong>at</strong>idylcholine<br />
(<strong>NBD</strong>(C 12 )-PC). As it remains<br />
unclear whe<strong>the</strong>r looping <strong>of</strong> <strong>the</strong> <strong>NBD</strong>-labeled acyl<br />
chain <strong>of</strong> <strong>NBD</strong>(C 12 )-PC occurs in monolayers <strong>at</strong> <strong>the</strong> air/<br />
w<strong>at</strong>er interface and wh<strong>at</strong> influences result, localiz<strong>at</strong>ion<br />
<strong>of</strong> <strong>the</strong> <strong>NBD</strong> group was assessed through compar<strong>at</strong>ive<br />
analysis <strong>of</strong> surface potential d<strong>at</strong>a for <strong>NBD</strong>-labeled and<br />
parent phospholipid monolayers based on <strong>the</strong> Demchak-<br />
Fort model. 18-23 Surface potential d<strong>at</strong>a also provide<br />
evidence about <strong>the</strong> electrost<strong>at</strong>ics <strong>of</strong> <strong>the</strong> <strong>NBD</strong>-phospholipid/<br />
w<strong>at</strong>er interface, which are <strong>of</strong> particular interest in <strong>the</strong><br />
case <strong>of</strong> DPPE-<strong>NBD</strong>, as substitution <strong>of</strong> two amine protons<br />
<strong>of</strong> <strong>the</strong> phosph<strong>at</strong>idylethanolamine group by <strong>NBD</strong> alters<br />
<strong>the</strong> headgroup charge. To obtain fur<strong>the</strong>r evidence on <strong>the</strong><br />
localiz<strong>at</strong>ion <strong>of</strong> <strong>the</strong> <strong>NBD</strong> group and to characterize <strong>the</strong><br />
spectroscopic properties <strong>of</strong> DPPE-<strong>NBD</strong> and <strong>NBD</strong>(C 12 )-PC<br />
in monolayers, in situ absorption and fluorescence spectra<br />
measurements were performed <strong>at</strong> <strong>the</strong> air/w<strong>at</strong>er interface.<br />
To gain detailed inform<strong>at</strong>ion on <strong>the</strong> intermolecular<br />
interactions and structural ordering <strong>of</strong> <strong>the</strong> <strong>NBD</strong>-phospholipid<br />
monolayers, polarized fluorescence and red-edge<br />
excit<strong>at</strong>ion shift (REES) effects were measured. The REES<br />
effect is usually observed when <strong>the</strong> mobility <strong>of</strong> a chromophore<br />
rel<strong>at</strong>ive to <strong>the</strong> surrounding m<strong>at</strong>rix is considerably<br />
reduced. 2 Thus, REES may serve as an indic<strong>at</strong>or <strong>of</strong><br />
chromophore local environment and has been shown to<br />
be a powerful tool in probing interfacial organiz<strong>at</strong>ion. 2<br />
2. Experimental Section<br />
2.1. M<strong>at</strong>erials. <strong>NBD</strong>-labeled phospholipids 1,2-dipalmitoylsn-glycero-3-phosph<strong>at</strong>idylethanolamine-N-(7-nitro-2-1,3-benzoxadiazol-4-yl)<br />
(DPPE-<strong>NBD</strong>) and 1-palmitoyl-2-[12-[(7-nitro-2-<br />
1,3-benzoxadiazol-4-yl)amino]dodecanoyl]-sn-glycero-3-phosph<strong>at</strong>idylcholine<br />
(<strong>NBD</strong>(C 12)-PC) as well as <strong>the</strong> parent phospholipids<br />
1,2-dipalmitoyl-sn-glycero-3-phosph<strong>at</strong>idylethanolamine (DPPE)<br />
and 1,2-dipalmitoyl-sn-glycero-3-phosph<strong>at</strong>idylcholine (DPPC)<br />
were purchased from Avanti Polar Lipids (Birmingham, AL).<br />
The chemical structures <strong>of</strong> <strong>the</strong>se compounds are presented in<br />
Figure 1. Spreading solutions <strong>of</strong> both <strong>NBD</strong>-labeled and parent<br />
phospholipids were prepared with HPLC grade chlor<strong>of</strong>orm <strong>at</strong><br />
typical concentr<strong>at</strong>ions <strong>of</strong> 0.4 mg/mL and stored in glass vials<br />
wrapped in aluminum foil in <strong>the</strong> dark <strong>at</strong> 4 °C. In all experiments,<br />
unless mentioned o<strong>the</strong>rwise, deionized w<strong>at</strong>er produced by a<br />
Nanopure w<strong>at</strong>er purific<strong>at</strong>ion system was used as <strong>the</strong> subphase.<br />
The specific resistivity <strong>of</strong> w<strong>at</strong>er was 18 × 10 6 Ω‚cm (pH 5.6 in<br />
(18) Demchak, R. J.; Fort, T., Jr. J. Colloid Interface Sci. 1974, 46,<br />
191.<br />
(19) Petrov, J. G.; Polymeropoulos, E. E.; Möhwald, H. J. Phys. Chem.<br />
1996, 100, 9860.<br />
(20) Oliveira, O. N., Jr.; Taylor, D. M.; Stirling, C. J. M.; Trip<strong>at</strong>hi,<br />
S.; Guo, B. Z. Langmuir 1992, 8, 1619.<br />
(21) Oliveira, O. N., Jr.; Taylor, D. M.; Lewis, T. J.; Salvagno, S.;<br />
Stirling, C. J. M. J. Chem. Soc., Faraday Trans. 1 1989, 85, 1009.<br />
(22) Ahluwalia, A.; Piolanti, R.; De Rossi, D.; Fissi, A. Langmuir<br />
1997, 13, 5909.<br />
(23) Oliveira, O. N., Jr.; Bonarsi, C. Langmuir 1997, 13, 5920.<br />
Figure 1. Chemical structures <strong>of</strong> <strong>the</strong> studied phospholipid<br />
molecules.<br />
equilibrium with <strong>at</strong>mospheric carbon dioxide). Inorganic reagents<br />
HCl and CuSO 4 used in <strong>the</strong> experiments were <strong>of</strong> AnalaR grade<br />
(Omega, QC).<br />
2.2. Methods. A homemade Teflon-co<strong>at</strong>ed Langmuir trough<br />
with a movable barrier described elsewhere 24 was used to study<br />
<strong>the</strong> phospholipid monolayers. The trough was <strong>the</strong>rmost<strong>at</strong>ed and<br />
enclosed in a box. A filter paper Wilhelmy pl<strong>at</strong>e was used to<br />
measure surface pressure (π). <strong>Monolayer</strong> surface potential (∆V)<br />
was detected with an 241 Am-co<strong>at</strong>ed ionizing electrode loc<strong>at</strong>ed 2<br />
mm above <strong>the</strong> w<strong>at</strong>er surface while <strong>the</strong> reference electrode made<br />
<strong>of</strong> pl<strong>at</strong>inum was immersed <strong>at</strong> <strong>the</strong> bottom <strong>of</strong> <strong>the</strong> trough. During<br />
monolayer compression, π and ∆V were recorded simultaneously.<br />
Surface pressure was detected to an accuracy <strong>of</strong> 0.1 mN/m, while<br />
surface potential was measured to an accuracy <strong>of</strong> (15 mV.<br />
The trough was also interfaced with an epifluorescence<br />
microscope described previously. 25 Epifluorescence micrographs<br />
were captured from different regions <strong>of</strong> <strong>the</strong> <strong>NBD</strong>-phospholipid<br />
iso<strong>the</strong>rms. The filter set used to observe <strong>the</strong> <strong>NBD</strong> fluorescence<br />
was a combin<strong>at</strong>ion <strong>of</strong> a blue excit<strong>at</strong>ion filter (Nikon, M 420-490),<br />
a dichroic mirror (Nikon, DM 510), and a barrier filter (Nikon,<br />
M 520). Excit<strong>at</strong>ion light was focused on <strong>the</strong> monolayer with a<br />
20× objective (Nikon, MPlan 20).<br />
In situ measurements <strong>of</strong> <strong>the</strong> absorption and emission spectra<br />
<strong>at</strong> <strong>the</strong> air/w<strong>at</strong>er interface were performed with <strong>the</strong> trough<br />
described by Gallant et al. 26 To measure <strong>the</strong> quenching <strong>of</strong> <strong>the</strong><br />
<strong>NBD</strong>(C 12)-PC fluorescence with Cu 2+ ion, an <strong>NBD</strong>(C 12)-PC<br />
monolayer spread on w<strong>at</strong>er was compressed to an area <strong>of</strong> 0.5<br />
nm 2 /molecule and <strong>the</strong>n 10 mM CuSO 4 solution was injected into<br />
<strong>the</strong> subphase underne<strong>at</strong>h <strong>the</strong> monolayer to achieve a final<br />
subphase concentr<strong>at</strong>ion <strong>of</strong> approxim<strong>at</strong>ely 300-400 µMCu 2+ ion.<br />
After <strong>the</strong> addition <strong>of</strong> <strong>the</strong> quenching agent, <strong>the</strong> system was allowed<br />
to equilibr<strong>at</strong>e for 15 min before measurements <strong>of</strong> <strong>the</strong> fluorescence<br />
intensity. Slits with a nominal band-pass <strong>of</strong> 6 nm were used to<br />
measure REES upon changing <strong>the</strong> excit<strong>at</strong>ion wavelength. In<br />
polarized fluorescence measurements, <strong>the</strong> excit<strong>at</strong>ion beam passed<br />
through a polarizer and was <strong>the</strong>n focused by an elliptical mirror<br />
onto <strong>the</strong> air/w<strong>at</strong>er interface. To select ei<strong>the</strong>r <strong>the</strong> p- or s-polarized<br />
component <strong>of</strong> <strong>the</strong> monolayer fluorescence, ano<strong>the</strong>r polarizer was<br />
placed before <strong>the</strong> mirror collecting <strong>the</strong> emitted light prior to its<br />
detection by a CCD camera. 27 These experiments were carried<br />
out in a dark room, and electronic shutters were used to irradi<strong>at</strong>e<br />
monolayers within 30 s.<br />
(24) Dutta, A. K.; Salesse, C. Langmuir 1997, 13, 5401.<br />
(25) Maloney, K. M.; Grandbois, M.; Grainger, D. W.; Salesse, C.;<br />
Lewis, K. A.; Roberts, M. F. Biochim. Biophys. Acta 1995, 1235, 395.<br />
(26) Gallant, J.; Lavoie, H.; Tessier, A.; Munger, G.; Leblanc, R. M.;<br />
Salesse, C. Langmuir 1998, 14, 3954.<br />
(27) Vranken, N.; Van der Auweraer, M.; De Schryver, F. C.; Lavoie,<br />
H.; Bélanger, P.; Salesse, C. Langmuir 2000, 16, 9518.
<strong>Monolayer</strong> <strong>Behavior</strong> <strong>of</strong> <strong>NBD</strong>-<strong>Labeled</strong> <strong>Phospholipids</strong> Langmuir, Vol. 18, No. 14, 2002 5541<br />
Figure 2. π-A iso<strong>the</strong>rms <strong>of</strong> <strong>the</strong> DPPE-<strong>NBD</strong> (a), <strong>NBD</strong>(C 12)-PC<br />
(b), DPPE (c) and DPPC (d) monolayers <strong>at</strong> <strong>the</strong> air/w<strong>at</strong>er<br />
interface. The iso<strong>the</strong>rms were measured <strong>at</strong> 20 ( 1 °C and a<br />
compression speed <strong>of</strong> 0.05 nm 2 /(molecule‚min).<br />
3. Results and Discussion<br />
3.1. Surface Pressure-Area (π-A) Iso<strong>the</strong>rms and<br />
Morphology <strong>of</strong> <strong>NBD</strong>-Phospholipid <strong>Monolayer</strong>s. The<br />
π-A iso<strong>the</strong>rms <strong>of</strong> <strong>the</strong> studied phospholipid monolayers<br />
on w<strong>at</strong>er are presented in Figure 2. Iso<strong>the</strong>rms <strong>of</strong> <strong>the</strong> DPPE<br />
and DPPC monolayers are essentially <strong>the</strong> same as those<br />
reported earlier, 11,28-30 have already been analyzed in<br />
detail in <strong>the</strong>se reports, and are used only as references<br />
here.<br />
Comparing <strong>the</strong> iso<strong>the</strong>rms <strong>of</strong> parent phospholipids with<br />
those <strong>of</strong> <strong>NBD</strong>-labeled analogues, <strong>the</strong> influence <strong>of</strong> <strong>the</strong><br />
<strong>at</strong>tachment <strong>of</strong> <strong>the</strong> <strong>NBD</strong> chromophore ei<strong>the</strong>r to <strong>the</strong><br />
headgroup or to <strong>the</strong> aliph<strong>at</strong>ic chain is readily apparent.<br />
Significant differences in monolayer behavior <strong>of</strong> <strong>the</strong> <strong>NBD</strong>phospholipids<br />
and <strong>the</strong> parent phospholipids are observed.<br />
Notably, <strong>the</strong> surface pressure lift-<strong>of</strong>f <strong>of</strong> <strong>the</strong> DPPE-<strong>NBD</strong><br />
iso<strong>the</strong>rm is shifted toward larger molecular areas over<br />
th<strong>at</strong> <strong>of</strong> DPPE. Additionally, <strong>the</strong> DPPE-<strong>NBD</strong> iso<strong>the</strong>rm<br />
exhibits typical liquid-expanded behavior with monotonically<br />
increasing surface pressure in <strong>the</strong> 0.96-0.74 nm 2 /<br />
molecule region in contrast to monolayers <strong>of</strong> DPPE<br />
remaining in <strong>the</strong> condensed st<strong>at</strong>e, showing no distinct<br />
liquid-expanded st<strong>at</strong>es or phase transitions. Significantly,<br />
a pl<strong>at</strong>eaulike region appears in <strong>the</strong> iso<strong>the</strong>rm <strong>of</strong> <strong>NBD</strong>labeled<br />
DPPE <strong>at</strong> areas below 0.74 nm 2 /molecule, and<br />
pl<strong>at</strong>eau pressure increased with increasing temper<strong>at</strong>ure.<br />
Though <strong>the</strong> iso<strong>the</strong>rms measured <strong>at</strong> different temper<strong>at</strong>ures<br />
were similar in shape, <strong>the</strong> pl<strong>at</strong>eau pressure rose from 3<br />
to 7 mN/m as subphase temper<strong>at</strong>ures increased from 10<br />
to 20 °C while <strong>the</strong> area corresponding to <strong>the</strong> pl<strong>at</strong>eau onset<br />
decreased (d<strong>at</strong>a not shown). Upon subsequent compression-expansion,<br />
very little hysteresis occurred, suggesting<br />
th<strong>at</strong> <strong>the</strong> process leading to <strong>the</strong> appearance <strong>of</strong> <strong>the</strong> pl<strong>at</strong>eau<br />
is completely reversible. Such behavior is a strong<br />
indic<strong>at</strong>ion th<strong>at</strong> <strong>the</strong> pl<strong>at</strong>eau origin<strong>at</strong>es from phase coexistence<br />
associ<strong>at</strong>ed with a first-order phase transition between<br />
<strong>the</strong> liquid-expanded (LE) and liquid-condensed (LC)<br />
monolayer st<strong>at</strong>es. 31,32 The DPPE-<strong>NBD</strong> monolayer collapses<br />
<strong>at</strong> an area <strong>of</strong> 0.38 nm 2 /molecule and a surface pressure <strong>of</strong><br />
(28) Ducharme, D.; Max, J.-J.; Salesse, C.; Leblanc, R. M. J. Phys.<br />
Chem. 1990, 94, 1925.<br />
(29) Vogel, V.; Möbius, D. J. Colloid Interface Sci. 1988, 126, 408.<br />
(30) Gaub, H. E.; Moy, V. T.; McConnell, H. M. J. Phys. Chem. 1986,<br />
90, 1721.<br />
(31) Marcelja, S. Biochim. Biophys. Acta 1974, 367, 165.<br />
(32) Pallas, N. R.; Pethica, B. A. Langmuir 1995, 1, 509.<br />
approxim<strong>at</strong>ely 17 mN/m th<strong>at</strong> is surprisingly low compared<br />
to th<strong>at</strong> <strong>of</strong> <strong>the</strong> parent phospholipid.<br />
Analogously, <strong>the</strong> onset <strong>of</strong> <strong>the</strong> surface pressure for <strong>the</strong><br />
<strong>NBD</strong>(C 12 )-PC monolayer is detected <strong>at</strong> an area <strong>of</strong> 1.5 nm 2 /<br />
molecule, which is remarkably larger than <strong>the</strong> area per<br />
molecule corresponding to <strong>the</strong> surface pressure lift-<strong>of</strong>f <strong>of</strong><br />
<strong>the</strong> DPPC iso<strong>the</strong>rm (Figure 2). However, <strong>the</strong> iso<strong>the</strong>rm <strong>of</strong><br />
<strong>the</strong> <strong>NBD</strong>-labeled analogue <strong>of</strong> DPPC lacks any <strong>of</strong> <strong>the</strong><br />
pl<strong>at</strong>eau fe<strong>at</strong>ures typically observed in <strong>the</strong> iso<strong>the</strong>rm <strong>of</strong><br />
DPPC <strong>at</strong> areas between 0.8 and 0.55 nm 2 /molecule. 11,28-30<br />
The <strong>NBD</strong>(C 12 )-PC monolayer shows only an LE st<strong>at</strong>e and<br />
collapses <strong>at</strong> an area <strong>of</strong> 0.43 nm 2 /molecule and a surface<br />
pressure <strong>of</strong> 39 mN/m. Surprisingly, while <strong>the</strong> <strong>at</strong>tachment<br />
<strong>of</strong> <strong>NBD</strong> chromophore increases <strong>the</strong> area per phospholipid<br />
molecule in <strong>the</strong> expanded st<strong>at</strong>e by approxim<strong>at</strong>ely 0.45<br />
nm 2 for both phospholipids compared to <strong>the</strong> parent<br />
phospholipids, <strong>the</strong> molecular area in <strong>the</strong> condensed st<strong>at</strong>e<br />
does not seem to be affected by <strong>the</strong> presence <strong>of</strong> <strong>the</strong> <strong>NBD</strong><br />
moiety. A similar observ<strong>at</strong>ion was made by Huster et al. 6<br />
for <strong>NBD</strong>-phosph<strong>at</strong>idylcholine-containing bilayers where<br />
<strong>the</strong> <strong>NBD</strong> group induced an increase in <strong>the</strong> average area<br />
per phosph<strong>at</strong>idylcholine molecule <strong>of</strong> 0.02 nm 2 , a less than<br />
3% increase in area per molecule over th<strong>at</strong> <strong>of</strong> <strong>the</strong> parent<br />
phospholipid.<br />
The first-order LE-LC transition for <strong>the</strong> DPPE-<strong>NBD</strong><br />
monolayer was visualized directly by epifluorescence<br />
microscopy. As shown in Figure 3A, <strong>the</strong> monolayer was<br />
homogeneously fluorescent in <strong>the</strong> expanded region <strong>of</strong> <strong>the</strong><br />
iso<strong>the</strong>rm. Upon fur<strong>the</strong>r compression to areas below 0.74<br />
nm 2 /molecule, phase separ<strong>at</strong>ion is induced. As clearly seen<br />
in Figure 3B, <strong>the</strong>re are two phases, dark condensed<br />
domains and fluorescent background, coexisting in <strong>the</strong><br />
pl<strong>at</strong>eau region <strong>of</strong> <strong>the</strong> DPPE-<strong>NBD</strong> iso<strong>the</strong>rm. Small rosetteshaped<br />
domain structures appeared initially near <strong>the</strong><br />
onset <strong>of</strong> <strong>the</strong> pl<strong>at</strong>eau and, as compression proceeded, grew<br />
larger in size. Though <strong>the</strong> domains coexisting <strong>at</strong> a given<br />
surface pressure differ in size (i.e., from locally different<br />
compression conditions and kinetic artifacts), <strong>the</strong>y are<br />
rel<strong>at</strong>ively homogeneous in shape, making six-petalled<br />
rosettes, and distributed evenly over <strong>the</strong> field. Domains<br />
contact each o<strong>the</strong>r <strong>at</strong> a surface pressure <strong>of</strong> approxim<strong>at</strong>ely<br />
17 mN/m, but <strong>the</strong>y do not appear to coalesce. Instead,<br />
fur<strong>the</strong>r imaging shows <strong>the</strong> lack <strong>of</strong> crispness and a<br />
progressive blurring <strong>of</strong> <strong>the</strong> domain boundaries (d<strong>at</strong>a not<br />
shown). This effect was previously observed for monolayers<br />
<strong>of</strong> phospholipids mixed with <strong>NBD</strong>-labeled analogues 13,33<br />
and interpreted as an increased light sc<strong>at</strong>tering <strong>at</strong><br />
multilayered exclusion structures (collapsed phase) containing<br />
<strong>NBD</strong>-phospholipids. Never<strong>the</strong>less, <strong>the</strong> series <strong>of</strong><br />
micrographs captured during <strong>the</strong> compression-expansion<br />
run showed th<strong>at</strong> <strong>the</strong> monolayer respread readily with<br />
decreasing surface pressure and <strong>the</strong> order in which <strong>the</strong><br />
domains appeared and grew upon compression was<br />
completely reversed upon decompression (d<strong>at</strong>a not shown).<br />
This is in accord with <strong>the</strong> lack <strong>of</strong> observable hysteresis in<br />
<strong>the</strong> π-A iso<strong>the</strong>rm <strong>of</strong> DPPE-<strong>NBD</strong>, fur<strong>the</strong>r supporting th<strong>at</strong><br />
<strong>the</strong> pl<strong>at</strong>eau indeed corresponds to a first-order LE-LC<br />
phase transition.<br />
More complex morphology was observed for <strong>the</strong> <strong>NBD</strong>-<br />
(C 12 )-PC monolayer. A uniform fluorescent field was<br />
observed in <strong>the</strong> 1.5-0.82 nm 2 /molecule region (Figure 4A).<br />
However, upon fur<strong>the</strong>r decreasing <strong>the</strong> area per molecule,<br />
small domains started to appear. As seen in Figure 4B,<br />
<strong>the</strong>se structures varied in both shape and size, representing<br />
domains <strong>of</strong> two kinds irregularly distributed over <strong>the</strong><br />
field. Tiny dark circular spots and rel<strong>at</strong>ively large strongly<br />
(33) Krüger, P.; Schalke, M.; Wang, Z.; Notter, R. H.; Dluhy R. A.;<br />
Lösche, M. Biophys. J. 1999, 77, 903.
5542 Langmuir, Vol. 18, No. 14, 2002 Tsukanova et al.<br />
Figure 3. Typical epifluorescence micrographs for a DPPE-<strong>NBD</strong> monolayer in <strong>the</strong> expanded region (A) and in <strong>the</strong> pl<strong>at</strong>eau (B) <strong>of</strong><br />
<strong>the</strong> π-A iso<strong>the</strong>rm. Micrograph B was taken <strong>at</strong> A ) 0.55 nm 2 /molecule and π ) 8 mN/m. The scale bars are 40 µm.<br />
Figure 4. Typical epifluorescence micrographs for an <strong>NBD</strong>(C 12)-PC monolayer in <strong>the</strong> 1.5-0.82 nm 2 /molecule region (A) and <strong>at</strong><br />
areas below 0.82 nm 2 /molecule (B). Micrograph B was taken <strong>at</strong> A ) 0.5 nm 2 /molecule and π ) 33 mN/m. The scale bars are as in<br />
Figure 3.<br />
fluorescent domains in a low-intensity fluorescent background<br />
were typical <strong>of</strong> <strong>the</strong> micrographs taken <strong>at</strong> areas<br />
below 0.82 nm 2 /molecule. As compression proceeded,<br />
domains <strong>of</strong> both kinds grew slightly larger in size.<br />
The observ<strong>at</strong>ion <strong>of</strong> domains in <strong>the</strong> micrographs <strong>of</strong> an<br />
LE-type monolayer such as th<strong>at</strong> <strong>of</strong> <strong>NBD</strong>(C 12 )-PC (see<br />
iso<strong>the</strong>rm b, Figure 2), which is presumed to exhibit a single<br />
homogeneous phase up to <strong>the</strong> point <strong>of</strong> monolayer collapse,<br />
is unexpected. However, even more striking is <strong>the</strong> fact<br />
th<strong>at</strong> replacement <strong>of</strong> one aliph<strong>at</strong>ic chain in DPPC by an<br />
<strong>NBD</strong>-labeled chain changes <strong>the</strong> organiz<strong>at</strong>ion <strong>of</strong> DPPC <strong>at</strong><br />
<strong>the</strong> air/w<strong>at</strong>er interface in a way th<strong>at</strong> effectively prevents<br />
phosph<strong>at</strong>idylcholine molecules from <strong>the</strong>ir well-recognized<br />
form<strong>at</strong>ion <strong>of</strong> ferroelectric domains. 12,34 Thus, it is clear<br />
th<strong>at</strong> <strong>the</strong> unique morphology observed for <strong>the</strong> <strong>NBD</strong>(C 12 )-<br />
PC monolayer as well as <strong>the</strong> form<strong>at</strong>ion <strong>of</strong> a hex<strong>at</strong>ic phase<br />
in <strong>the</strong> DPPE-<strong>NBD</strong> monolayer should be considered in<br />
terms <strong>of</strong> localiz<strong>at</strong>ion <strong>of</strong> <strong>NBD</strong> chromophores <strong>at</strong> <strong>the</strong> interface<br />
and <strong>the</strong>ir interactions with each o<strong>the</strong>r and with <strong>the</strong><br />
headgroups <strong>of</strong> phospholipid molecules as discussed below.<br />
3.2. Surface Potential-Area (∆V-A) Iso<strong>the</strong>rms<br />
and Localiz<strong>at</strong>ion <strong>of</strong> <strong>the</strong> <strong>NBD</strong> Chromophore <strong>at</strong> <strong>the</strong><br />
<strong>Air</strong>/W<strong>at</strong>er Interface. Since <strong>the</strong> iso<strong>the</strong>rms <strong>of</strong> both <strong>NBD</strong>labeled<br />
phospholipids reach almost <strong>the</strong> same areas per<br />
molecule near monolayer collapse as those <strong>of</strong> <strong>the</strong> parent<br />
phospholipids, <strong>the</strong> <strong>NBD</strong> group might be assumed to be<br />
ei<strong>the</strong>r buried bene<strong>at</strong>h <strong>the</strong> DPPE-<strong>NBD</strong> headgroup or<br />
(34) Bowen, P. J.; Lewis, T. J. Thin Solid Films 1983, 99, 157.<br />
elev<strong>at</strong>ed on top <strong>of</strong> <strong>the</strong> <strong>NBD</strong>(C 12 )-PC monolayer to achieve<br />
monolayer packing densities similar to those <strong>of</strong> <strong>the</strong> parent<br />
phospholipids lacking <strong>NBD</strong>. To assess in a first approxim<strong>at</strong>ion<br />
<strong>the</strong> orient<strong>at</strong>ion <strong>of</strong> <strong>the</strong> <strong>NBD</strong> moiety <strong>at</strong> <strong>the</strong><br />
interface, surface potential measurements were performed.<br />
The ∆V-A iso<strong>the</strong>rms <strong>of</strong> <strong>the</strong> <strong>NBD</strong>-phospholipid<br />
and parent phospholipid monolayers <strong>at</strong> <strong>the</strong> air/w<strong>at</strong>er<br />
interface are presented in Figure 5A. Iso<strong>the</strong>rms <strong>of</strong> <strong>the</strong><br />
DPPC and DPPE monolayers are similar to those reported<br />
elsewhere, 28,29,35 and thus, <strong>the</strong>y are not discussed fur<strong>the</strong>r,<br />
but used for comparison. At large areas per molecule, <strong>the</strong><br />
surface potential <strong>of</strong> <strong>the</strong> <strong>NBD</strong>(C 12 )-PC monolayer was<br />
always positive. As seen in Figure 5A, after <strong>the</strong> jump, <strong>the</strong><br />
surface potential rises smoothly and reaches a value <strong>of</strong><br />
+287 mV <strong>at</strong> an area <strong>of</strong> 0.48 nm 2 /molecule, slightly larger<br />
than <strong>the</strong> collapse area <strong>of</strong> <strong>the</strong> π-A iso<strong>the</strong>rm. In contrast,<br />
<strong>the</strong> DPPE-<strong>NBD</strong> monolayer exhibits vari<strong>at</strong>ions <strong>of</strong> surface<br />
potential during compression. No jump in <strong>the</strong> surface<br />
potential is observed on lift-<strong>of</strong>f. The onset <strong>of</strong> <strong>the</strong> surface<br />
potential is r<strong>at</strong>her difficult to determine, but can be loc<strong>at</strong>ed<br />
anywhere between 1.5 and 1.3 nm 2 /molecule. Then, <strong>at</strong> an<br />
area <strong>of</strong> approxim<strong>at</strong>ely 1.1 nm 2 /molecule, <strong>the</strong> surface<br />
potential starts to decrease progressively until a minimum<br />
value <strong>of</strong> -81 mV is <strong>at</strong>tained <strong>at</strong> <strong>the</strong> beginning <strong>of</strong> <strong>the</strong> pl<strong>at</strong>eau<br />
in <strong>the</strong> π-A iso<strong>the</strong>rm. Upon fur<strong>the</strong>r compression, ano<strong>the</strong>r<br />
slope change occurs in <strong>the</strong> ∆V-A iso<strong>the</strong>rm <strong>at</strong> an area <strong>of</strong><br />
0.83 nm 2 /molecule from which ∆V increases rapidly,<br />
(35) Hayashi, M.; Muram<strong>at</strong>su, T.; Hara, I. Biochim. Biophys. Acta<br />
1972, 255, 98.
<strong>Monolayer</strong> <strong>Behavior</strong> <strong>of</strong> <strong>NBD</strong>-<strong>Labeled</strong> <strong>Phospholipids</strong> Langmuir, Vol. 18, No. 14, 2002 5543<br />
Figure 5. ∆V-A iso<strong>the</strong>rms <strong>of</strong> <strong>the</strong> DPPE-<strong>NBD</strong> (a) and <strong>NBD</strong>-<br />
(C 12)-PC (b) monolayers <strong>at</strong> <strong>the</strong> air/w<strong>at</strong>er interface, DPPE-<strong>NBD</strong><br />
on an HCl subphase with pH 1.9, DPPE (c), and DPPC (d) (A)<br />
and <strong>the</strong> ψ 0 potential <strong>of</strong> <strong>the</strong> DPPE-<strong>NBD</strong> monolayer (B). The<br />
experimental conditions are identical to those in Figure 2.<br />
yielding a value <strong>of</strong> +291 mV in <strong>the</strong> fully condensed st<strong>at</strong>e.<br />
Interestingly, despite <strong>the</strong> differences in ∆V-A iso<strong>the</strong>rms<br />
<strong>at</strong> larger areas per molecule, <strong>the</strong> values <strong>of</strong> <strong>the</strong> surface<br />
potentials for both closely packed <strong>NBD</strong>-phospholipid<br />
monolayers were essentially <strong>the</strong> same. The neg<strong>at</strong>ive<br />
surface potential <strong>of</strong> <strong>the</strong> DPPE-<strong>NBD</strong> monolayer in <strong>the</strong><br />
expanded region origin<strong>at</strong>es probably from <strong>the</strong> contribution<br />
<strong>of</strong> an electric double layer formed by phosph<strong>at</strong>idylethanolamine-<strong>NBD</strong><br />
(PE - -<strong>NBD</strong>) groups and protons, since <strong>the</strong><br />
monolayer is <strong>at</strong> least partly ionized <strong>at</strong> <strong>the</strong> subphase pH<br />
used. 36<br />
Surface potential, ∆V, has been shown to be rel<strong>at</strong>ed to<br />
<strong>the</strong> normal component <strong>of</strong> group dipole moments <strong>of</strong> aliph<strong>at</strong>ic<br />
molecules forming monolayers <strong>at</strong> <strong>the</strong> air/w<strong>at</strong>er interface<br />
using <strong>the</strong> Demchak-Fort three-layer capacitor model. 19-23<br />
According to this model, <strong>the</strong> monolayer surface potential<br />
results from <strong>the</strong> contribution <strong>of</strong> <strong>the</strong> dipole moments, µ i ,<br />
<strong>of</strong> (1) terminal CH 3 groups, (2) hydrophilic headgroups,<br />
and (3) w<strong>at</strong>er molecules reoriented and polarized by <strong>the</strong><br />
monolayer. 18 To take into account <strong>the</strong> local polarizabilities<br />
<strong>of</strong> <strong>the</strong> medium surrounding <strong>the</strong> dipoles, a different effective<br />
dielectric constant, ɛ i , is assigned to each layer. In addition,<br />
when <strong>the</strong> monolayer is ionized, an electric double-layer is<br />
expected to be formed th<strong>at</strong> contributes to <strong>the</strong> surface<br />
potential, ∆V, with <strong>the</strong> double-layer potential ψ 0 . Applying<br />
<strong>the</strong> Demchak-Fort approach, <strong>the</strong> surface potential for<br />
monolayers <strong>of</strong> DPPE and DPPE-<strong>NBD</strong> can be written,<br />
respectively, as<br />
1<br />
µ<br />
∆V DPPE )<br />
ɛ 0 A DPPE[ 2 CH3<br />
+ 2 µ CdO<br />
+ µ µ<br />
PE H2 O<br />
+<br />
ɛ CH3 ɛ CdO ɛ PE ɛ H2 O] + ψ 0<br />
(1)<br />
∆V DPPE-<strong>NBD</strong> )<br />
1<br />
ɛ 0 A DPPE-<strong>NBD</strong>[ 2 µ CH3<br />
ɛ CH3<br />
+ 2 µ CdO<br />
ɛ CdO<br />
+ µ PE<br />
ɛ PE<br />
+<br />
µ <strong>NBD</strong><br />
µ H2 O<br />
+<br />
ɛ <strong>NBD</strong> ɛ H2 O]<br />
+ ψ 0 (2)<br />
(36) Tocanne, J.-F.; Teissie J. Biochim. Biophys. Acta 1990, 1031,<br />
111.<br />
where ɛ 0 is <strong>the</strong> permittivity <strong>of</strong> vacuum, A i is <strong>the</strong> area per<br />
molecule, µ CH3 , µ CdO , µ PE , and µ <strong>NBD</strong> are <strong>the</strong> normal<br />
components <strong>of</strong> <strong>the</strong> dipole moments <strong>of</strong> <strong>the</strong> terminal CH 3<br />
group <strong>of</strong> <strong>the</strong> acyl chain, <strong>the</strong> carbonyl CdO group, <strong>the</strong><br />
phosph<strong>at</strong>idylethanolamine headgroup, and <strong>the</strong> <strong>NBD</strong><br />
chromophore, respectively. The term µ H2O/ɛ H2O is used to<br />
account for <strong>the</strong> reorient<strong>at</strong>ion and polariz<strong>at</strong>ion <strong>of</strong> w<strong>at</strong>er<br />
molecules induced by <strong>the</strong> phospholipid monolayer. Though<br />
<strong>the</strong> Demchak-Fort model has been widely used to gain<br />
microscopic structural or dielectric inform<strong>at</strong>ion, 19-23,37 <strong>the</strong><br />
model is in some ways tied to questionable assumptions<br />
and oversimplific<strong>at</strong>ions, 37 as it deals with a number <strong>of</strong><br />
parameters whose reliable values are difficult, if not<br />
impossible, to obtain. In particular, values reported so far<br />
for <strong>the</strong> effective dielectric constant <strong>of</strong> <strong>the</strong> terminal CH 3<br />
group region, ɛ CH3 , differ across a range <strong>of</strong> 2.1-5.3 19,21,37,38<br />
while <strong>the</strong> µ CH3 value can vary between 0.12 and 0.4 D. 19,29,39<br />
Values for o<strong>the</strong>r parameters <strong>of</strong> eqs 1 and 2 found in <strong>the</strong><br />
liter<strong>at</strong>ure differ even more. For instance, depending on<br />
<strong>the</strong> method <strong>of</strong> analysis, values <strong>of</strong> µ H2O/ɛ H2O were found<br />
within 0.05-10 D, 37,39,40 suggesting th<strong>at</strong> <strong>the</strong> reorganized<br />
w<strong>at</strong>er molecules hydr<strong>at</strong>ing lipid polar headgroups could<br />
contribute from 4 up to 500 mV to <strong>the</strong> measured ∆V.<br />
Therefore, <strong>the</strong> aim <strong>of</strong> <strong>the</strong> present analysis <strong>of</strong> ∆V d<strong>at</strong>a is<br />
to make, on a compar<strong>at</strong>ive basis, a rough estim<strong>at</strong>ion <strong>of</strong><br />
<strong>the</strong> <strong>NBD</strong> chromophore contribution to <strong>the</strong> normal component<br />
<strong>of</strong> <strong>the</strong> phospholipid dipole moment, whe<strong>the</strong>r it is<br />
neg<strong>at</strong>ive or positive, r<strong>at</strong>her than to derive any quantit<strong>at</strong>ive<br />
inform<strong>at</strong>ion.<br />
We argue th<strong>at</strong> <strong>the</strong> decrease <strong>of</strong> approxim<strong>at</strong>ely 230 mV<br />
observed in <strong>the</strong> surface potential <strong>of</strong> <strong>the</strong> fully condensed<br />
monolayer <strong>of</strong> DPPE-<strong>NBD</strong> compared to DPPE is due mainly<br />
to <strong>the</strong> presence <strong>of</strong> <strong>the</strong> <strong>NBD</strong> group. The <strong>NBD</strong> chromophore<br />
has a permanent dipole moment <strong>of</strong> 11.8 D in its plane. 41<br />
Moreover, substitution <strong>of</strong> two headgroup protons by <strong>NBD</strong><br />
alters <strong>the</strong> charge distribution <strong>of</strong> <strong>the</strong> phosph<strong>at</strong>idylethanolamine<br />
dipole so th<strong>at</strong> only <strong>the</strong> neg<strong>at</strong>ive charge on <strong>the</strong><br />
phosph<strong>at</strong>idyl group remains. Consequently, <strong>the</strong> DPPE-<br />
<strong>NBD</strong> monolayer should have a neg<strong>at</strong>ive ψ 0 potential <strong>at</strong> a<br />
subphase pH <strong>of</strong> 5.6. 36 Presumably, both <strong>the</strong> <strong>NBD</strong> dipole<br />
with its projection µ <strong>NBD</strong> on <strong>the</strong> surface normal and <strong>the</strong> ψ 0<br />
potential contribute neg<strong>at</strong>ively to <strong>the</strong> surface potential<br />
∆V. Although <strong>the</strong> <strong>NBD</strong>-induced distortion <strong>of</strong> charge<br />
distribution likely causes a decrease in <strong>the</strong> dipole moment<br />
<strong>of</strong> <strong>the</strong> phosph<strong>at</strong>idylethanolamine headgroup, its effect on<br />
∆V is believed to be rel<strong>at</strong>ively minor because <strong>the</strong> normal<br />
component µ PE <strong>of</strong> <strong>the</strong> phosph<strong>at</strong>idylethanolamine dipole is<br />
oriented more parallel to <strong>the</strong> interface and does not seem<br />
to be a dominant contributor to <strong>the</strong> surface potential.<br />
18,21,29,36 The presence <strong>of</strong> <strong>the</strong> <strong>NBD</strong> chromophore will<br />
also alter <strong>the</strong> ordering <strong>of</strong> w<strong>at</strong>er molecules in <strong>the</strong> hydr<strong>at</strong>ion<br />
shell <strong>of</strong> <strong>the</strong> phosph<strong>at</strong>idylethanolamine headgroup 42 and,<br />
as a result, may affect, to some extent, <strong>the</strong> value <strong>of</strong> µ H2O/<br />
ɛ H2O. However, this type <strong>of</strong> change is expected to increase<br />
<strong>the</strong> value <strong>of</strong> ∆V r<strong>at</strong>her than decrease it. As mentioned<br />
above, though a lot <strong>of</strong> controversy over <strong>the</strong> contribution<br />
<strong>of</strong> ordered w<strong>at</strong>er dipoles to ∆V exists, <strong>the</strong> value is estim<strong>at</strong>ed<br />
to be approxim<strong>at</strong>ely +93 and +124 mV for phosph<strong>at</strong>idylethanolamine<br />
and phosph<strong>at</strong>idylcholine monolayers,<br />
respectively. 37,40 A more positive contribution <strong>of</strong> ordered<br />
w<strong>at</strong>er dipoles to ∆V <strong>of</strong> phosph<strong>at</strong>idylcholine can be <strong>at</strong>tributed<br />
to <strong>the</strong> progressive increase in hydr<strong>at</strong>ion level as<br />
(37) Brockman, H. Chem. Phys. Lipids 1994, 73, 57.<br />
(38) Taylor, D. M.; Bayes, G. F. Phys. Rev. E 1994, 49, 1439.<br />
(39) Raudino, A.; Mauzerall, D. Biophys. J. 1986, 50, 441.<br />
(40) Gawrisch, K.; Ruston, D.; Zimmerberg, J.; Parsegian, V. A.; Rang,<br />
R. P.; Fuller, N. Biophys. J. 1992, 61, 1213.<br />
(41) Müller, P.; Gallet, F. J. Phys. Chem. 1991, 95, 3257.<br />
(42) Willard, D. M.; Riter, R. E.; Levinger, N. E. J. Am. Chem. Soc.<br />
1998, 120, 4151.
5544 Langmuir, Vol. 18, No. 14, 2002 Tsukanova et al.<br />
one goes from phosph<strong>at</strong>idylethanolamine to phosph<strong>at</strong>idylcholine<br />
through <strong>the</strong> addition <strong>of</strong> methyl groups: <strong>the</strong><br />
former phospholipid was found to bind 7-12 w<strong>at</strong>er<br />
molecules, while values ranging from 30 to 35 w<strong>at</strong>er<br />
molecules per phospholipid were reported for <strong>the</strong> l<strong>at</strong>ter. 43<br />
Due to <strong>the</strong> presence <strong>of</strong> <strong>the</strong> <strong>NBD</strong> chromophore, a larger<br />
headgroup size will likely favor a fur<strong>the</strong>r increase in<br />
hydr<strong>at</strong>ion. Never<strong>the</strong>less, comparing <strong>the</strong> hydr<strong>at</strong>ion potentials<br />
<strong>of</strong> phosph<strong>at</strong>idylethanolamine and phosph<strong>at</strong>idylcholine,<br />
large changes in hydr<strong>at</strong>ion give rise to a value <strong>of</strong><br />
µ H2O/ɛ H2O equivalent to an increase in ∆V <strong>of</strong> ∼31 mV. Hence,<br />
considering th<strong>at</strong> this simplific<strong>at</strong>ion leads to some underestim<strong>at</strong>ion<br />
<strong>of</strong> group dipole contributions, we choose to<br />
neglect changes in µ H2O/ɛ H2O due to <strong>NBD</strong> incorpor<strong>at</strong>ion in<br />
<strong>the</strong> phospholipid structure in our calcul<strong>at</strong>ions as rel<strong>at</strong>ively<br />
insignificant. Then, we will consider th<strong>at</strong> for a given<br />
temper<strong>at</strong>ure, pH and area per molecule <strong>the</strong> contributions<br />
<strong>of</strong> µ CH3 /ɛ CH3 and <strong>of</strong> µ CdO /ɛ CdO to ∆V are identical to those<br />
pertaining to <strong>the</strong> DPPE monolayer. 20 Thus, we may ascribe<br />
differences in <strong>the</strong> surface potentials <strong>of</strong> DPPE and DPPE-<br />
<strong>NBD</strong> mainly to <strong>the</strong> substitution <strong>of</strong> two phosph<strong>at</strong>idylethanolamine<br />
headgroup protons by <strong>the</strong> <strong>NBD</strong> chromophore.<br />
Then, we may write, after <strong>the</strong> subtraction <strong>of</strong> eq 1<br />
from eq 2<br />
µ <strong>NBD</strong> /ɛ <strong>NBD</strong> ) ɛ 0 A(∆V DPPE-<strong>NBD</strong> - ψ 0 - ∆V DPPE ) (3)<br />
where ψ 0 is <strong>the</strong> double-layer potential <strong>of</strong> <strong>the</strong> DPPE-<strong>NBD</strong><br />
monolayer. On <strong>the</strong> basis <strong>of</strong> <strong>the</strong> intrinsic pK a <strong>of</strong> <strong>the</strong><br />
phosph<strong>at</strong>idylethanolamine headgroup, DPPE can be<br />
considered as a zwitterion bearing a permanent positive<br />
charge on <strong>the</strong> amine group and a neg<strong>at</strong>ive charge on <strong>the</strong><br />
phosph<strong>at</strong>idyl group over a pH range <strong>of</strong> 2.3-8. 36 As a result,<br />
<strong>the</strong> contribution <strong>of</strong> <strong>the</strong> ψ 0 potential in ∆V DPPE , in particular,<br />
<strong>at</strong> pH 5.6 will be negligible.<br />
To calcul<strong>at</strong>e µ <strong>NBD</strong> /ɛ <strong>NBD</strong> using eq 3, <strong>the</strong> ψ 0 potential <strong>of</strong> <strong>the</strong><br />
DPPE-<strong>NBD</strong> monolayer should be determined. As suggested<br />
by Dynarowicz-L<strong>at</strong>ka et al., 44 a portion <strong>of</strong> ∆V<br />
associ<strong>at</strong>ed with <strong>the</strong> double-layer potential can be found<br />
through a comparison <strong>of</strong> <strong>the</strong> surface potentials <strong>of</strong> a<br />
nonionized DPPE-<strong>NBD</strong> monolayer on an acidic subphase<br />
and an ionized one on pure w<strong>at</strong>er. Given an intrinsic pK a<br />
<strong>of</strong> 0.32-0.7 for <strong>the</strong> phosph<strong>at</strong>idyl group 36 and taking into<br />
account <strong>the</strong> ioniz<strong>at</strong>ion properties <strong>of</strong> <strong>the</strong> <strong>NBD</strong> chromophore,<br />
1,10 it is reasonable to expect th<strong>at</strong> <strong>the</strong> PE - -<strong>NBD</strong><br />
group will be completely neutralized by a proton, probably<br />
in <strong>the</strong> form <strong>of</strong> an ion pair, <strong>at</strong> a subphase pH e 2. Thus,<br />
to obtain <strong>the</strong> dependence <strong>of</strong> <strong>the</strong> ψ 0 potential on <strong>the</strong> area<br />
per molecule for <strong>the</strong> DPPE-<strong>NBD</strong> monolayer on pure w<strong>at</strong>er,<br />
<strong>the</strong> ∆V-A iso<strong>the</strong>rm <strong>of</strong> <strong>the</strong> DPPE-<strong>NBD</strong> monolayer spread<br />
onto a subphase containing HCl <strong>at</strong> a pH <strong>of</strong> 1.9 was<br />
measured (curve c in Figure 5) and, <strong>the</strong>n, subtracted from<br />
<strong>the</strong> ∆V-A iso<strong>the</strong>rm shown in Figure 5A (curve a). The<br />
dependence <strong>of</strong> <strong>the</strong> ψ 0 potential on <strong>the</strong> area per molecule<br />
is presented in Figure 5B. The fact th<strong>at</strong> <strong>the</strong> resulting ψ 0<br />
potential does not obey <strong>the</strong> exponential dependence<br />
predicted by <strong>the</strong> Gouy-Chapman model is worth special<br />
<strong>at</strong>tention and will be discussed below. Since values <strong>of</strong> <strong>the</strong><br />
ψ 0 potential <strong>of</strong> <strong>the</strong> DPPE-<strong>NBD</strong> monolayer <strong>at</strong> <strong>the</strong> air/w<strong>at</strong>er<br />
interface <strong>at</strong> different areas per molecule can be obtained<br />
from Figure 5B, <strong>the</strong> value <strong>of</strong> µ <strong>NBD</strong> /ɛ <strong>NBD</strong> can be readily<br />
assessed using eq 3. In <strong>the</strong> 0.6-0.4 nm 2 /molecule region,<br />
eq 3 yields µ <strong>NBD</strong> /ɛ <strong>NBD</strong> ≈ -0.23 D (to convert <strong>the</strong> calcul<strong>at</strong>ed<br />
value <strong>of</strong> µ <strong>NBD</strong> /ɛ <strong>NBD</strong> into Debye units, <strong>the</strong> conversion factor<br />
1D) 3.335 × 10 -30 C‚m was applied 29 ). We stress th<strong>at</strong>,<br />
although <strong>the</strong> absolute value <strong>of</strong> µ <strong>NBD</strong> /ɛ <strong>NBD</strong> might be underestim<strong>at</strong>ed<br />
due to <strong>the</strong> simplific<strong>at</strong>ion <strong>of</strong> our analysis,<br />
(43) Sen, A.; Hui, S.-W. Chem. Phys. Lipids 1988, 49, 179.<br />
(44) Dynarowicz-L<strong>at</strong>ka, P.; Dhanabalan, A.; Cavalli, A.; Oliveira, O.<br />
N., Jr. J. Phys. Chem. B 2000, 104, 1701.<br />
<strong>the</strong> contribution <strong>of</strong> µ <strong>NBD</strong> /ɛ <strong>NBD</strong> to ∆V was indeed found to<br />
be neg<strong>at</strong>ive, which is not unreasonable as explained below.<br />
The <strong>NBD</strong> heterocyclic chromophore is fl<strong>at</strong> and, because<br />
<strong>of</strong> <strong>the</strong> distribution <strong>of</strong> charges in its structure, bears a<br />
permanent electric dipole moment oriented as drawn<br />
schem<strong>at</strong>ically in Figure 6a, making an angle <strong>of</strong> 43° with<br />
respect to <strong>the</strong> N-NO 2 axis. 41 With this model, it is thus<br />
possible to discuss <strong>the</strong> orient<strong>at</strong>ion <strong>of</strong> <strong>the</strong> dipole moment<br />
MB <strong>at</strong> <strong>the</strong> air/w<strong>at</strong>er interface on <strong>the</strong> basis <strong>of</strong> <strong>the</strong> ∆V d<strong>at</strong>a<br />
analysis. Recent calcul<strong>at</strong>ions 29,36 showed th<strong>at</strong> a positive<br />
portion <strong>of</strong> ∆V <strong>of</strong> <strong>the</strong> DPPE monolayer origin<strong>at</strong>es from two<br />
main dipole moments: µ CH3 th<strong>at</strong> characterizes <strong>the</strong> aliph<strong>at</strong>ic<br />
chain terminal group and µ CdO corresponding to <strong>the</strong><br />
carbonyl CdO group <strong>of</strong> <strong>the</strong> phospholipid molecule. Structural<br />
studies on phospholipid monolayers and bilayers 36<br />
indic<strong>at</strong>ed th<strong>at</strong> both dipoles in a closely packed st<strong>at</strong>e were<br />
oriented essentially parallel to <strong>the</strong> surface normal with<br />
<strong>the</strong>ir strong projected dipole moments µ CH3 and µ CdO<br />
directed into <strong>the</strong> monolayer (see Figure 6b), thus contributing<br />
positively to <strong>the</strong> surface potential. By contrast,<br />
<strong>the</strong> phosph<strong>at</strong>idylethanolamine dipole with its ethanolamine<br />
group slightly repelled away from <strong>the</strong> monolayer<br />
toward <strong>the</strong> w<strong>at</strong>er subphase gives <strong>the</strong> projection µ PE onto<br />
<strong>the</strong> surface normal antiparallel to µ CH3 and µ CdO as shown<br />
in Figure 6b. As a result, it contributes neg<strong>at</strong>ively to <strong>the</strong><br />
surface potential. 29,36 Consequently, <strong>the</strong> neg<strong>at</strong>ive µ <strong>NBD</strong> /<br />
ɛ <strong>NBD</strong> value implies th<strong>at</strong> <strong>the</strong> orient<strong>at</strong>ion <strong>of</strong> <strong>the</strong> <strong>NBD</strong> dipole<br />
moment MB <strong>at</strong> <strong>the</strong> air/w<strong>at</strong>er interface must be similar to<br />
th<strong>at</strong> <strong>of</strong> <strong>the</strong> phosph<strong>at</strong>idylethanolamine dipole. Therefore,<br />
any orient<strong>at</strong>ion <strong>of</strong> <strong>the</strong> <strong>NBD</strong> group as shown in Figure 6c<br />
may be ascribed to <strong>the</strong> <strong>NBD</strong> chromophore in <strong>the</strong> DPPE-<br />
<strong>NBD</strong> monolayer as long as <strong>the</strong> projection µ <strong>NBD</strong> on <strong>the</strong><br />
surface normal remains neg<strong>at</strong>ive. As shown in Figure 6b,<br />
<strong>the</strong> depiction with <strong>the</strong> <strong>NBD</strong> chromophore loc<strong>at</strong>ed underne<strong>at</strong>h<br />
<strong>the</strong> phosph<strong>at</strong>idylethanolamine group is consistent<br />
with <strong>the</strong> conclusion derived from <strong>the</strong> π-A iso<strong>the</strong>rm: <strong>the</strong><br />
<strong>NBD</strong> group does not require any additional area in <strong>the</strong><br />
condensed monolayer. Indeed, given <strong>the</strong> size <strong>of</strong> <strong>the</strong> <strong>NBD</strong><br />
group (approxim<strong>at</strong>ely 0.6 nm × 0.5 nm in <strong>the</strong> plane and<br />
0.025 nm thick 45 ), such a localiz<strong>at</strong>ion (Figure 6b) will not<br />
alter <strong>the</strong> area per molecule in <strong>the</strong> condensed st<strong>at</strong>e to any<br />
remarkable extent because <strong>the</strong> area <strong>of</strong> ∼0.125 nm 2<br />
required per <strong>NBD</strong> is sufficiently small to be readily<br />
accommod<strong>at</strong>ed underne<strong>at</strong>h <strong>the</strong> phosph<strong>at</strong>idylethanolamine<br />
headgroup.<br />
Following a similar approach, <strong>the</strong> contribution <strong>of</strong> <strong>the</strong><br />
<strong>NBD</strong> chromophore to <strong>the</strong> surface potential <strong>of</strong> <strong>the</strong> <strong>NBD</strong>-<br />
(C 12 )-PC monolayer was also estim<strong>at</strong>ed. Comparing <strong>the</strong><br />
∆V-A iso<strong>the</strong>rm <strong>of</strong> <strong>the</strong> <strong>NBD</strong>(C 12 )-PC monolayer (curve b,<br />
Figure 5A) and th<strong>at</strong> <strong>of</strong> <strong>the</strong> parent phospholipid (curve d,<br />
Figure 5A), <strong>the</strong> <strong>at</strong>tachment <strong>of</strong> <strong>the</strong> <strong>NBD</strong> chromophore<br />
terminally to an aliph<strong>at</strong>ic chain notably causes a decrease<br />
in ∆V <strong>of</strong> 320 mV. As <strong>the</strong> headgroup <strong>of</strong> both monolayerforming<br />
compounds is phosph<strong>at</strong>idylcholine completely<br />
ionized <strong>at</strong> pH 5.6 used in <strong>the</strong> experiments, <strong>the</strong> presence<br />
<strong>of</strong> both DPPC and <strong>NBD</strong>(C 12 )-PC <strong>at</strong> <strong>the</strong> interface in<br />
zwitterionic form rules out <strong>the</strong> possibility for <strong>the</strong> doublelayer<br />
ψ 0 potential to alter <strong>the</strong> monolayer ∆V. Moreover,<br />
both monolayers collapse <strong>at</strong> approxim<strong>at</strong>ely <strong>the</strong> same area<br />
per molecule, so th<strong>at</strong> <strong>at</strong> <strong>the</strong> end <strong>of</strong> <strong>the</strong> iso<strong>the</strong>rm <strong>the</strong><br />
terminal CH 3 group, <strong>the</strong> carbonyl, and <strong>the</strong> phosph<strong>at</strong>idylcholine<br />
dipole moments <strong>of</strong> <strong>the</strong> DPPC and <strong>NBD</strong>(C 12 )-<br />
PC molecules are probably all projected alike onto <strong>the</strong><br />
surface normal. Consequently, <strong>the</strong> contributions µ CH3 /ɛ CH3 ,<br />
µ CdO /ɛ CdO and µ PC /ɛ PC as well as <strong>the</strong> contribution <strong>of</strong> <strong>the</strong><br />
oriented w<strong>at</strong>er dipoles, µ H2O/ɛ H2O,to∆V <strong>of</strong> both monolayers<br />
are almost identical <strong>at</strong> a given temper<strong>at</strong>ure, pH, and area<br />
per molecule. 20 Then, <strong>the</strong> decrease in ∆V <strong>NBD</strong>(C12)-PC com-<br />
(45) Flament, C.; Graf, K.; Gallet, F.; Riegler, H. Thin Solid Films<br />
1994, 243, 411.
<strong>Monolayer</strong> <strong>Behavior</strong> <strong>of</strong> <strong>NBD</strong>-<strong>Labeled</strong> <strong>Phospholipids</strong> Langmuir, Vol. 18, No. 14, 2002 5545<br />
Figure 6. Schem<strong>at</strong>ic depiction <strong>of</strong> <strong>the</strong> structure <strong>of</strong> <strong>the</strong> <strong>NBD</strong> chromophore and its orient<strong>at</strong>ion <strong>at</strong> <strong>the</strong> air/w<strong>at</strong>er interface. (a) A<br />
permanent dipole moment, MB , in <strong>the</strong> <strong>NBD</strong> group. The drawing is made on <strong>the</strong> basis <strong>of</strong> previously reported d<strong>at</strong>a. 39,43,44 (b) A schem<strong>at</strong>ic<br />
diagram <strong>of</strong> <strong>the</strong> DPPE-<strong>NBD</strong> molecule orient<strong>at</strong>ion <strong>at</strong> <strong>the</strong> air/w<strong>at</strong>er interface. µ CH3 and µ CdO are <strong>the</strong> normal components <strong>of</strong> <strong>the</strong> dipole<br />
moments <strong>of</strong> aliph<strong>at</strong>ic chain termini and carbonyl groups <strong>of</strong> <strong>the</strong> molecule, respectively. By being directed into <strong>the</strong> monolayer, <strong>the</strong>y<br />
contribute positively to ∆V. 34 µ PE and µ <strong>NBD</strong> are <strong>the</strong> normal components <strong>of</strong> <strong>the</strong> phosph<strong>at</strong>idylethanolamine dipole and <strong>NBD</strong> dipole,<br />
respectively. By being antiparallel to µ CH3 and µ CdO, <strong>the</strong>y provide a neg<strong>at</strong>ive contribution to ∆V. 27,34 (c) <strong>NBD</strong> orient<strong>at</strong>ions corresponding<br />
to neg<strong>at</strong>ive projection µ <strong>NBD</strong>. (d) A schem<strong>at</strong>ic diagram <strong>of</strong> <strong>the</strong> <strong>NBD</strong>(C 12)-PC molecule orient<strong>at</strong>ion <strong>at</strong> <strong>the</strong> air/w<strong>at</strong>er interface. The normal<br />
components µ CH3 , µ CdO, and µ <strong>NBD</strong> are as in drawing b, while µ PC is <strong>the</strong> normal component <strong>of</strong> <strong>the</strong> P - -N + phosph<strong>at</strong>idylcholine dipole.<br />
The dotted drawing shows <strong>the</strong> orient<strong>at</strong>ion <strong>of</strong> <strong>the</strong> <strong>NBD</strong>-labeled chain which could result in a positive contribution <strong>of</strong> µ <strong>NBD</strong> to ∆V.<br />
A neg<strong>at</strong>ive contribution <strong>of</strong> µ <strong>NBD</strong> to ∆V <strong>NBD</strong>(C12)-PC suggests looping <strong>of</strong> <strong>the</strong> <strong>NBD</strong>-labeled acyl chain toward w<strong>at</strong>er. A detailed explan<strong>at</strong>ion<br />
is given in <strong>the</strong> text. Drawings b and d are made on <strong>the</strong> basis <strong>of</strong> previously reported models. 27,34<br />
pared to ∆V DPPC likely arises from <strong>the</strong> substitution <strong>of</strong> one<br />
chain terminal CH 3 group by <strong>the</strong> <strong>NBD</strong> moiety, given by<br />
∆V <strong>NBD</strong>(C12 )-PC - ∆V DPPC ) 1<br />
ɛ 0 A(<br />
µ <strong>NBD</strong><br />
Solving eq 4 for µ <strong>NBD</strong> /ɛ <strong>NBD</strong> , we may write<br />
ɛ <strong>NBD</strong><br />
-<br />
µ CH3<br />
ɛ CH3)<br />
(4)<br />
µ <strong>NBD</strong><br />
ɛ 0 A(∆V <strong>NBD</strong>(C12 )-PC - ∆V DPPC ) µ CH3<br />
)<br />
+ (5)<br />
ɛ <strong>NBD</strong> 3.335 × 10 -30 ɛ CH3<br />
The value <strong>of</strong> µ CH3 /ɛ CH3 for a chain terminal group has been<br />
determined previously from a compar<strong>at</strong>ive analysis <strong>of</strong> <strong>the</strong><br />
π-A and ∆V-A iso<strong>the</strong>rms <strong>of</strong> stearic acid and a 1:1 mixture<br />
<strong>of</strong> octadecane and octadecylmalonic acid. In this study,
5546 Langmuir, Vol. 18, No. 14, 2002 Tsukanova et al.<br />
Figure 7. Corrected absorption (A) and emission (B) spectra <strong>of</strong> <strong>the</strong> DPPE-<strong>NBD</strong> monolayer <strong>at</strong> <strong>the</strong> air/w<strong>at</strong>er interface recorded in<br />
different regions <strong>of</strong> <strong>the</strong> π-A iso<strong>the</strong>rm: (a) A ) 0.9 nm 2 /molecule, π ) 1.9 mN/m; (b) A ) 0.7 nm 2 /molecule, π ) 6.4 mN/m; (c) A<br />
) 0.6 nm 2 /molecule, π ) 7.8 mN/m; (d) A ) 0.5 nm 2 /molecule, π ) 9.2 mN/m; (e) A ) 0.4 nm 2 /molecule, π ) 15.8 mN/m. The emission<br />
spectra were obtained using an excit<strong>at</strong>ion wavelength <strong>of</strong> 465 nm. The inset shows <strong>the</strong> dependence <strong>of</strong> <strong>the</strong> absorption (emission)<br />
maximum, λ max, on <strong>the</strong> area per molecule.<br />
Vogel and Möbius derived µ CH3 /ɛ CH3 ≈ +0.35 D. 29 Applying<br />
this value, we calcul<strong>at</strong>e a value <strong>of</strong> -0.05 D for µ <strong>NBD</strong> /ɛ <strong>NBD</strong><br />
in <strong>the</strong> 0.55-0.4 nm 2 /molecule region. In fact, this value<br />
<strong>of</strong> -0.05 D is surprisingly small for <strong>the</strong> <strong>NBD</strong> chromophore<br />
possessing a permanent dipole moment <strong>of</strong> 11.8 D. Such<br />
a neg<strong>at</strong>ive contribution <strong>of</strong> <strong>the</strong> <strong>NBD</strong> dipole to <strong>the</strong> surface<br />
potential <strong>of</strong> <strong>the</strong> <strong>NBD</strong>(C 12 )-PC monolayer is somewh<strong>at</strong><br />
unexpected. Assuming an upright orient<strong>at</strong>ion <strong>of</strong> <strong>the</strong> <strong>NBD</strong>labeled<br />
chain, it would be reasonable to expect <strong>the</strong> <strong>NBD</strong><br />
chromophore to be oriented as shown by <strong>the</strong> dotted<br />
drawing in Figure 6d. However, if <strong>the</strong> <strong>NBD</strong> dipole were<br />
indeed oriented in this way, it would contribute positively<br />
to ∆V in analogy to <strong>the</strong> CH 3 and CdO dipoles discussed<br />
above. This does not agree with <strong>the</strong> value calcul<strong>at</strong>ed for<br />
µ <strong>NBD</strong> /ɛ <strong>NBD</strong> . In fact, <strong>the</strong> neg<strong>at</strong>ive µ <strong>NBD</strong> /ɛ <strong>NBD</strong> value implies<br />
th<strong>at</strong> <strong>the</strong> <strong>NBD</strong> chromophore orient<strong>at</strong>ion in <strong>the</strong> <strong>NBD</strong>(C 12 )-<br />
PC monolayer must be similar to th<strong>at</strong> in <strong>the</strong> DPPE-<strong>NBD</strong><br />
monolayer (Figure 6b,c). A plausible explan<strong>at</strong>ion exists if<br />
<strong>the</strong> chain bearing <strong>the</strong> <strong>NBD</strong> moiety loops toward w<strong>at</strong>er,<br />
leading to localiz<strong>at</strong>ion <strong>of</strong> <strong>the</strong> <strong>NBD</strong> group in <strong>the</strong> vicinity <strong>of</strong><br />
<strong>the</strong> phosph<strong>at</strong>idylcholine headgroup as drawn schem<strong>at</strong>ically<br />
in Figure 6d. The same conclusion was made<br />
previously for <strong>NBD</strong>(C 12 )-PC incorpor<strong>at</strong>ed into lipid bilayers<br />
and membranes. 1,3,6,10 Such “looping” <strong>of</strong> <strong>the</strong> <strong>NBD</strong>-labeled<br />
acyl chain in <strong>the</strong> <strong>NBD</strong>(C 12 )-PC monolayer proposed from<br />
<strong>the</strong> neg<strong>at</strong>ive µ <strong>NBD</strong> /ɛ <strong>NBD</strong> value is fur<strong>the</strong>r supported by <strong>the</strong><br />
absorption and fluorescence spectroscopy d<strong>at</strong>a.<br />
3.3. Absorption and Fluorescence Spectroscopy<br />
<strong>of</strong> <strong>NBD</strong>-Phospholipid <strong>Monolayer</strong>s. An important<br />
fe<strong>at</strong>ure <strong>of</strong> <strong>the</strong> <strong>NBD</strong> chromophore photophysical behavior<br />
is <strong>the</strong> charge transfer (CT) between <strong>the</strong> electron-don<strong>at</strong>ing<br />
amino group and <strong>the</strong> electron-accepting nitro group, which<br />
varies with <strong>the</strong> polarity <strong>of</strong> <strong>the</strong> environment surrounding<br />
<strong>the</strong> chromophore. 1,3,7,42,45-47 The CT band <strong>of</strong> <strong>NBD</strong> undergoes<br />
a significant red shift with increasing polarity and<br />
can be utilized to evalu<strong>at</strong>e <strong>the</strong> chromophore localiz<strong>at</strong>ion<br />
<strong>at</strong> <strong>the</strong> interface. 1,10 In particular, when <strong>the</strong> <strong>NBD</strong> group is<br />
placed in nonpolar hydrocarbon solvents, <strong>the</strong> absorption<br />
maximum occurs between 420 and 450 nm, while in a<br />
polar medium, such as protic solvents or w<strong>at</strong>er, maximum<br />
absorption wavelengths <strong>of</strong> <strong>the</strong> CT band cover a narrow<br />
range near 470 nm. 3,7,46,47 The n<strong>at</strong>ure <strong>of</strong> <strong>the</strong> environment<br />
has an even larger effect on <strong>the</strong> position <strong>of</strong> <strong>the</strong> <strong>NBD</strong><br />
(46) Fery-Forgues, S.; Fayet, J.-P.; Lopez, A. J. Photochem. Photobiol.,<br />
A 1993, 70, 229.<br />
(47) Mukherjee, S.; Ch<strong>at</strong>topadhyay, A.; Samanta, A.; Soujanya, T.<br />
J. Phys. Chem. 1994, 98, 2809.<br />
fluorescence maximum. Ch<strong>at</strong>topadhyay et al. 10 and Fery-<br />
Fergues et al. 10 found th<strong>at</strong>, as <strong>the</strong> dielectric constant<br />
increased, <strong>the</strong> <strong>NBD</strong> emission maximum shifted significantly<br />
from 491-519 nm in hydrocarbon solvents to 566-<br />
571 nm in w<strong>at</strong>er. Therefore, <strong>the</strong> position <strong>of</strong> <strong>the</strong> absorption<br />
and fluorescence maxima should provide a rough indic<strong>at</strong>ion<br />
<strong>of</strong> <strong>the</strong> polarity <strong>of</strong> <strong>the</strong> environment locally around <strong>the</strong><br />
<strong>NBD</strong> group.<br />
The DPPE-<strong>NBD</strong> monolayer absorption and fluorescence<br />
spectra recorded <strong>at</strong> different areas per molecule are<br />
presented in Figure 7. Absorption spectra in Figure 7A<br />
exhibit a maximum <strong>at</strong> approxim<strong>at</strong>ely 466 nm th<strong>at</strong><br />
undergoes a small blue shift with decreasing area per<br />
molecule as shown in <strong>the</strong> inset <strong>of</strong> this figure. The<br />
fluorescence emission maxima (Figure 7B) occur over<br />
wavelength ranges near 549 nm <strong>at</strong> large molecular areas.<br />
As seen in <strong>the</strong> inset <strong>of</strong> Figure 7B, a progressive red shift<br />
<strong>of</strong> <strong>the</strong> fluorescence maximum was observed <strong>at</strong> areas below<br />
<strong>the</strong> onset <strong>of</strong> <strong>the</strong> pl<strong>at</strong>eau in <strong>the</strong> π-A iso<strong>the</strong>rm. The<br />
fluorescence intensity decreased continuously upon compression,<br />
very consistent with <strong>the</strong> growth <strong>of</strong> <strong>the</strong> nonfluorescent<br />
domains in <strong>the</strong> DPPE-<strong>NBD</strong> monolayer displayed<br />
by <strong>the</strong> micrograph in Figure 3B. Thus, in comparison with<br />
<strong>the</strong> behavior <strong>of</strong> <strong>NBD</strong> in solutions <strong>of</strong> varying polarity<br />
discussed above, <strong>the</strong> positions <strong>of</strong> <strong>the</strong> absorption and<br />
fluorescence maxima <strong>at</strong> 466 and 549 nm, respectively,<br />
indic<strong>at</strong>e th<strong>at</strong> <strong>the</strong> <strong>NBD</strong> group <strong>of</strong> <strong>the</strong> DPPE-<strong>NBD</strong> molecule<br />
is loc<strong>at</strong>ed in <strong>the</strong> polar environment <strong>of</strong> <strong>the</strong> monolayer<br />
headgroup region.<br />
As seen in Figure 8, <strong>the</strong> absorption and fluorescence<br />
spectra <strong>of</strong> <strong>the</strong> <strong>NBD</strong>(C 12 )-PC monolayer appear <strong>at</strong> even<br />
longer wavelengths than those <strong>of</strong> <strong>the</strong> DPPE-<strong>NBD</strong> monolayer.<br />
Indeed, <strong>the</strong> absorption maximum <strong>of</strong> <strong>the</strong> <strong>NBD</strong><br />
chromophore in <strong>the</strong> liquid-expanded <strong>NBD</strong>(C 12 )-PC monolayer<br />
was detected <strong>at</strong> 478 nm (Figure 8A), while its<br />
fluorescence maximum was loc<strong>at</strong>ed <strong>at</strong> approxim<strong>at</strong>ely 558<br />
nm (Figure 8B). Upon fur<strong>the</strong>r compression, a very small<br />
red shift <strong>of</strong> <strong>the</strong> absorption band was observed. The<br />
emission maximum was also shifted to <strong>the</strong> red as shown<br />
in <strong>the</strong> Figure 8B inset, and <strong>the</strong> fluorescence intensity<br />
increased significantly <strong>at</strong> areas below 0.82 nm/molecule.<br />
The l<strong>at</strong>ter effect is probably associ<strong>at</strong>ed with form<strong>at</strong>ion <strong>of</strong><br />
highly fluorescent domains in <strong>the</strong> <strong>NBD</strong>(C 12 )-PC monolayer<br />
seen in Figure 4B. Since <strong>the</strong> positions <strong>of</strong> both absorption<br />
and fluorescence maxima in Figure 8 are very close to <strong>the</strong><br />
values <strong>of</strong> 482 and 566 nm reported by Fery-Fergues et
<strong>Monolayer</strong> <strong>Behavior</strong> <strong>of</strong> <strong>NBD</strong>-<strong>Labeled</strong> <strong>Phospholipids</strong> Langmuir, Vol. 18, No. 14, 2002 5547<br />
Figure 8. Corrected absorption (A) and emission (B) spectra <strong>of</strong> <strong>the</strong> <strong>NBD</strong>(C 12)-PC monolayer <strong>at</strong> <strong>the</strong> air/w<strong>at</strong>er interface recorded<br />
in different regions <strong>of</strong> <strong>the</strong> π-A iso<strong>the</strong>rm: (a) A ) 1.3 nm 2 /molecule, π ) 2.1 mN/m; (b) A ) 0.9 nm 2 /molecule, π ) 9.8 mN/m; (c)<br />
A ) 0.7 nm 2 /molecule, π ) 16.2 mN/m; (d) A ) 0.6 nm 2 /molecule, π ) 22.1 mN/m; (e) A ) 0.5 nm 2 /molecule, π ) 33 mN/m. The<br />
emission spectra were obtained using an excit<strong>at</strong>ion wavelength <strong>of</strong> 470 nm. The inset shows <strong>the</strong> dependence <strong>of</strong> <strong>the</strong> emission maximum,<br />
λ max, on <strong>the</strong> area per molecule.<br />
al. 46 for <strong>the</strong> absorption and fluorescence maxima <strong>of</strong> <strong>the</strong><br />
CT band <strong>of</strong> <strong>NBD</strong> in w<strong>at</strong>er, our absorption and fluorescence<br />
d<strong>at</strong>a clearly argue in favor <strong>of</strong> a strongly polar environment<br />
surrounding <strong>the</strong> <strong>NBD</strong> group in <strong>the</strong> <strong>NBD</strong>-DPPC monolayer.<br />
Additionally, <strong>the</strong> fluorescence emission maximum <strong>of</strong> <strong>the</strong><br />
<strong>NBD</strong> chromophore residing in nonpolar regions <strong>of</strong> an <strong>NBD</strong>cholesterol-containing<br />
membrane 10 and an <strong>NBD</strong>-ubiquinone<br />
vesicle 49 was reported to be <strong>at</strong> 522-527 nm, wavelengths<br />
shorter than <strong>the</strong> emission maximum in our<br />
experiments. We <strong>the</strong>n conclude th<strong>at</strong> <strong>the</strong> <strong>NBD</strong> group <strong>of</strong><br />
<strong>NBD</strong>(C 12 )-PC is likely expelled from <strong>the</strong> monolayer<br />
hydrocarbon chain region toward <strong>the</strong> w<strong>at</strong>er subphase and<br />
is exposed to <strong>the</strong> polar environment <strong>of</strong> <strong>the</strong> phosph<strong>at</strong>idylcholine<br />
headgroup region <strong>at</strong> <strong>the</strong> air/w<strong>at</strong>er interface. In<br />
summary, our spectroscopic d<strong>at</strong>a are in good agreement<br />
with <strong>the</strong> hypo<strong>the</strong>sis <strong>of</strong> <strong>the</strong> looping <strong>of</strong> <strong>the</strong> <strong>NBD</strong>-labeled<br />
acyl chain <strong>of</strong> <strong>NBD</strong>(C 12 )-PC toward w<strong>at</strong>er on <strong>the</strong> basis <strong>of</strong><br />
<strong>the</strong> ∆V d<strong>at</strong>a analysis. Moreover, this conclusion is fur<strong>the</strong>r<br />
supported by fluorescence quenching experiments performed<br />
with <strong>the</strong> aqueous quencher Cu 2+ described below.<br />
The paramagnetic cupric ion is known to be an efficient<br />
soluble quencher <strong>of</strong> fluorescence <strong>of</strong> <strong>NBD</strong> chromophores<br />
loc<strong>at</strong>ed near <strong>the</strong> aqueous phase. 1,49 Cu 2+ quenching is<br />
assumed to occur by a dynamic mechanism with an<br />
efficiency dependent on <strong>the</strong> quencher concentr<strong>at</strong>ion, <strong>the</strong><br />
degree <strong>of</strong> quencher binding to <strong>the</strong> phosph<strong>at</strong>idylcholine<br />
headgroup, and electrost<strong>at</strong>ic interactions between <strong>the</strong><br />
quencher and phospholipid headgroups. 7,48,49 Injection <strong>of</strong><br />
Cu 2+ under <strong>NBD</strong>(C 12 )-PC monolayers typically resulted<br />
in a quenching <strong>of</strong> 28-35% <strong>of</strong> <strong>the</strong> <strong>NBD</strong> fluorescence,<br />
suggesting th<strong>at</strong> some popul<strong>at</strong>ion <strong>of</strong> <strong>NBD</strong> chromophores<br />
<strong>at</strong>tached to <strong>the</strong> aliph<strong>at</strong>ic chain <strong>of</strong> <strong>NBD</strong>(C 12 )-PC is readily<br />
accessible to Cu 2+ quencher. This is in good accord with<br />
<strong>the</strong> previously reported d<strong>at</strong>a for <strong>NBD</strong>-phospholipidcontaining<br />
vesicles 10,49 where direct exposure <strong>of</strong> <strong>NBD</strong><br />
groups to aqueous quenchers Cu 2+ and Co 2+ caused a 20-<br />
50% decrease in <strong>the</strong> <strong>NBD</strong> fluorescence. As <strong>the</strong> positive<br />
∆V <strong>NBD</strong>(C12)-PC is <strong>the</strong> origin <strong>of</strong> an energy barrier against <strong>the</strong><br />
transport <strong>of</strong> positively charged species across <strong>the</strong> monolayer,<br />
36 <strong>the</strong> Cu 2+ quenching means th<strong>at</strong> <strong>at</strong> least a portion<br />
<strong>of</strong> <strong>the</strong> <strong>NBD</strong> groups are loc<strong>at</strong>ed in a monolayer region where<br />
<strong>the</strong>y are exposed directly to <strong>the</strong> aqueous phase. However,<br />
(48) Peterson, N. O. Can. J. Chem. 1985, 63, 77.<br />
(49) Rajar<strong>at</strong>hnam, K.; Hochman, J.; Schindler, M.; Ferguson-Miller,<br />
S. Biochemistry 1989, 28, 3168.<br />
a more precise interpret<strong>at</strong>ion <strong>of</strong> <strong>the</strong> Cu 2+ quenching results<br />
does not seem possible because <strong>the</strong> Cu 2+ quenching process<br />
may be affected by specific adsorption <strong>of</strong> Cu 2+ to <strong>the</strong><br />
phosph<strong>at</strong>idylcholine group, 4,5,10,49 causing a positive doublelayer<br />
potential <strong>of</strong> <strong>the</strong> monolayer. As a result, cupric ion<br />
concentr<strong>at</strong>ions near <strong>the</strong> <strong>NBD</strong> chromophore are reduced<br />
over th<strong>at</strong> in <strong>the</strong> bulk aqueous phase, and <strong>the</strong> quencherchromophore<br />
collisions likely occur mainly by l<strong>at</strong>eral<br />
diffusion <strong>of</strong> Cu 2+ bound to <strong>the</strong> phosph<strong>at</strong>idylcholine headgroup,<br />
leading to a lower quenching efficiency. 4 Never<strong>the</strong>less,<br />
observed Cu 2+ quenching indic<strong>at</strong>es th<strong>at</strong>, despite<br />
differences in <strong>the</strong> chemical structure <strong>of</strong> <strong>the</strong> studied <strong>NBD</strong>phospholipids,<br />
a substantial amount <strong>of</strong> <strong>NBD</strong> groups from<br />
<strong>NBD</strong>(C 12 )-PC are embedded in <strong>the</strong> monolayer polar region.<br />
3.4. Polarized Fluorescence and REES Studies on<br />
<strong>NBD</strong>-Phospholipid <strong>Monolayer</strong>s. Though <strong>the</strong> <strong>NBD</strong><br />
group <strong>of</strong> DPPE-<strong>NBD</strong> and th<strong>at</strong> <strong>of</strong> <strong>NBD</strong>(C 12 )-PC are<br />
proposed to be localized in similar monolayer regions, <strong>the</strong><br />
different contributions <strong>of</strong> µ <strong>NBD</strong> in ∆V DPPE-<strong>NBD</strong> and ∆V <strong>NBD</strong>(C12)-<br />
PC imply th<strong>at</strong> <strong>the</strong> orient<strong>at</strong>ion <strong>of</strong> <strong>the</strong> <strong>NBD</strong> chromophore<br />
and structural ordering <strong>of</strong> <strong>NBD</strong>-phospholipid molecules<br />
are r<strong>at</strong>her different in <strong>the</strong> DPPE-<strong>NBD</strong> and <strong>NBD</strong>(C 12 )-PC<br />
monolayers. More inform<strong>at</strong>ion relevant to <strong>the</strong> organiz<strong>at</strong>ion<br />
<strong>of</strong> <strong>NBD</strong>-phospholipids in a monolayer can be gained from<br />
polarized fluorescence measurements and REES study.<br />
As <strong>the</strong> emission from chromophores uniformly oriented<br />
with respect to <strong>the</strong> direction <strong>of</strong> <strong>the</strong> polarized excit<strong>at</strong>ion is<br />
polarized, measurement <strong>of</strong> fluorescence polariz<strong>at</strong>ion or<br />
anisotropy provides <strong>the</strong> average orient<strong>at</strong>ion <strong>of</strong> <strong>the</strong> emitting<br />
chromophore. In particular, <strong>the</strong> rel<strong>at</strong>ionship between <strong>the</strong><br />
fluorescence anisotropy r and <strong>the</strong> angle θ <strong>of</strong> <strong>the</strong> emission<br />
dipole away from <strong>the</strong> surface normal is given by 50<br />
r ) 3 cos2 θ - 1<br />
2<br />
The polariz<strong>at</strong>ion anisotropy is defined by<br />
where I pp and I ps are vertically polarized (p-polarized)<br />
excit<strong>at</strong>ion intensities <strong>of</strong> <strong>the</strong> fluorescence emission polar-<br />
(50) Lakowicz, J. R. Principles <strong>of</strong> Fluorescence Spectroscopy; Plenum<br />
Press: New York, 1986.<br />
(6)<br />
r ) I pp - GI ps<br />
I pp + 2GI ps<br />
(7)
5548 Langmuir, Vol. 18, No. 14, 2002 Tsukanova et al.<br />
Table 1. Fluorescence Anisotropy, r, a and REES Effect<br />
Values b for DPPE-<strong>NBD</strong> and <strong>NBD</strong>(C 12)-PC in <strong>Monolayer</strong>s<br />
<strong>at</strong> Different Molecular Areas<br />
area<br />
(nm 2 /<br />
molecule) r DPPE-<strong>NBD</strong> r <strong>NBD</strong>(C12)-PC<br />
REES DPPE-<strong>NBD</strong><br />
(nm)<br />
REES <strong>NBD</strong>(C12)-PC<br />
(nm)<br />
0.9 0.22 0.003<br />
0.7 0.25 0.003 4<br />
0.6 0.23 0.003 6 2<br />
0.5 0.26 0.003 9 6<br />
0.4 0.27 0.003 14<br />
a Polarized fluorescence was measured using excit<strong>at</strong>ion wavelengths<br />
<strong>of</strong> 465 and 470 nm for DPPE-<strong>NBD</strong> and <strong>NBD</strong>(C 12)-PC,<br />
respectively. b REES values given in <strong>the</strong> table correspond to <strong>the</strong><br />
shift <strong>of</strong> <strong>the</strong> emission maximum <strong>of</strong> DPPE-<strong>NBD</strong> (<strong>NBD</strong>(C 12)-PC) upon<br />
changing <strong>the</strong> excit<strong>at</strong>ion wavelength from 465 nm (470 nm) to 500<br />
nm.<br />
ized vertically and horizontally (s-polarized), respectively.<br />
G is <strong>the</strong> gr<strong>at</strong>ing correction factor, which is <strong>the</strong> r<strong>at</strong>io <strong>of</strong> <strong>the</strong><br />
sensitivities <strong>of</strong> <strong>the</strong> detection system for vertically and<br />
horizontally polarized light given by G ) I sp /I ss . 2,50 For<br />
completely polarized emission r ) 1. 50 However, a value<br />
<strong>of</strong> r equal to unity is never found for <strong>the</strong> chromophores<br />
ei<strong>the</strong>r in vitrified solution or <strong>at</strong> interfaces because <strong>of</strong> a<br />
distribution <strong>of</strong> chromophore orient<strong>at</strong>ions always present<br />
between θ and dθ. Regarding <strong>the</strong> θ distribution, a<br />
maximum value <strong>of</strong> 0.4 should be expected for r when <strong>the</strong><br />
absorption and emission dipoles are collinear, and when<br />
no processes result in depolariz<strong>at</strong>ion. 50<br />
To calcul<strong>at</strong>e fluorescence anisotropy, r, polarized fluorescence<br />
spectra from <strong>the</strong> DPPE-<strong>NBD</strong> monolayer were<br />
measured <strong>at</strong> different areas per molecule. The values <strong>of</strong><br />
r DPPE-<strong>NBD</strong> are presented in Table 1: anisotropy <strong>of</strong> <strong>the</strong> DPPE-<br />
<strong>NBD</strong> fluorescence remains essentially <strong>the</strong> same, varying<br />
between 0.22 and 0.27 with decreasing area per molecule.<br />
This suggests th<strong>at</strong> <strong>the</strong> <strong>NBD</strong> chromophore <strong>of</strong> DPPE-<strong>NBD</strong><br />
adopts a r<strong>at</strong>her narrow distribution <strong>of</strong> orient<strong>at</strong>ions <strong>at</strong> <strong>the</strong><br />
air/w<strong>at</strong>er interface characterized by <strong>the</strong> angle θ th<strong>at</strong><br />
remains almost unchanged during monolayer compression.<br />
As roughly estim<strong>at</strong>ed using eq 6, anisotropy values<br />
<strong>of</strong> 0.22-0.27 correspond to an angle θ <strong>of</strong> 44-46°. In<br />
contrast, almost no anisotropy was observed in <strong>the</strong><br />
fluorescence <strong>of</strong> <strong>the</strong> <strong>NBD</strong>(C 12 )-PC monolayer. Regardless<br />
<strong>of</strong> <strong>the</strong> combin<strong>at</strong>ion <strong>of</strong> excit<strong>at</strong>ion and emission polariz<strong>at</strong>ions,<br />
both I pp and I ps were roughly constant. As a result, eq 7<br />
yielded a value <strong>of</strong> 0.003 for r <strong>NBD</strong>(C12)-PC over <strong>the</strong> range <strong>of</strong><br />
areas per molecule listed in Table 1. The possible causes<br />
for <strong>the</strong> complete loss <strong>of</strong> anisotropy could be th<strong>at</strong> (1)<br />
chromophores are all oriented alike, making an angle <strong>of</strong><br />
54.7° away from <strong>the</strong> surface normal, or, on <strong>the</strong> contrary,<br />
(2) <strong>the</strong> <strong>NBD</strong> chromophore <strong>of</strong> <strong>NBD</strong>(C 12 )-PC does not have<br />
a unique orient<strong>at</strong>ion <strong>at</strong> <strong>the</strong> air/w<strong>at</strong>er interface and more<br />
than one popul<strong>at</strong>ion <strong>of</strong> <strong>NBD</strong> characterized by different<br />
angles θ 50 exists in <strong>the</strong> <strong>NBD</strong>(C 12 )-PC monolayer. It could<br />
also be th<strong>at</strong> depolariz<strong>at</strong>ion associ<strong>at</strong>ed with ei<strong>the</strong>r in-plane<br />
or out-<strong>of</strong>-plane chromophore rot<strong>at</strong>ional motion occurs<br />
during <strong>the</strong> course <strong>of</strong> excit<strong>at</strong>ion. 2,46,50 To identify whe<strong>the</strong>r<br />
any <strong>of</strong> <strong>the</strong> above explan<strong>at</strong>ions is correct, REES measurements<br />
were performed for both <strong>NBD</strong>-phospholipid monolayers.<br />
The fluorescence emission spectra <strong>of</strong> <strong>the</strong> DPPE-<strong>NBD</strong><br />
monolayer presented in Figure 7 were obtained using an<br />
excit<strong>at</strong>ion wavelength <strong>of</strong> 465 nm. With excit<strong>at</strong>ion <strong>at</strong> 465<br />
nm <strong>the</strong> emission maximum occurs within a range <strong>of</strong> 549-<br />
558 nm. Changing <strong>the</strong> excit<strong>at</strong>ion wavelength from 465 to<br />
490 and 500 nm caused a progressive red shift in <strong>the</strong><br />
emission maximum <strong>of</strong> DPPE-<strong>NBD</strong>. Such a dependence <strong>of</strong><br />
<strong>the</strong> emission spectra on <strong>the</strong> excit<strong>at</strong>ion wavelength is<br />
characteristic <strong>of</strong> <strong>the</strong> REES effect. Values <strong>of</strong> REES for <strong>the</strong><br />
DPPE-<strong>NBD</strong> monolayer <strong>at</strong> different areas per molecule<br />
are listed in Table 1: an REES <strong>of</strong> 4 nm was observed<br />
initially <strong>at</strong> an area <strong>of</strong> ∼0.7 nm 2 /molecule corresponding<br />
to <strong>the</strong> onset <strong>of</strong> <strong>the</strong> pl<strong>at</strong>eau <strong>of</strong> <strong>the</strong> DPPE-<strong>NBD</strong> iso<strong>the</strong>rm.<br />
Then, as compression proceeded, <strong>the</strong> REES value increased<br />
gradually and reached a maximum <strong>at</strong> an area <strong>of</strong><br />
0.4 nm 2 /molecule where a change in <strong>the</strong> excit<strong>at</strong>ion<br />
wavelength from 465 to 500 nm resulted in a shift <strong>of</strong> <strong>the</strong><br />
emission band from 558 to 572 nm, equivalent to an REES<br />
<strong>of</strong> 14 nm. This observ<strong>at</strong>ion indic<strong>at</strong>es th<strong>at</strong> <strong>the</strong> <strong>NBD</strong><br />
chromophore <strong>of</strong> DPPE-<strong>NBD</strong> is in a surrounding m<strong>at</strong>rix<br />
where its mobility as well as <strong>the</strong> reorient<strong>at</strong>ional motion<br />
<strong>of</strong> <strong>the</strong> w<strong>at</strong>er dipoles around <strong>the</strong> excited-st<strong>at</strong>e chromophore<br />
is considerably restricted. 2<br />
When compressed to an area <strong>of</strong> 0.6-0.5 nm 2 /molecule,<br />
<strong>the</strong> <strong>NBD</strong>(C 12 )-PC monolayer also exhibited an REES.<br />
However, <strong>the</strong> effect <strong>of</strong> excit<strong>at</strong>ion <strong>at</strong> <strong>the</strong> red edge <strong>of</strong> <strong>the</strong><br />
absorption spectrum on <strong>the</strong> position <strong>of</strong> <strong>the</strong> emission<br />
maximum was less pronounced. Indeed, upon changing<br />
<strong>the</strong> excit<strong>at</strong>ion wavelength from 470 nm, normally used to<br />
obtain <strong>the</strong> fluorescence spectra in Figure 8, to 500 nm, an<br />
REES <strong>of</strong> <strong>the</strong> emission band <strong>of</strong> 6 nm was observed only for<br />
<strong>the</strong> <strong>NBD</strong>(C 12 )-PC monolayer compressed to an area <strong>of</strong> 0.5<br />
nm 2 /molecule. The REES <strong>of</strong> 2-6 nm (Table 1) detected <strong>at</strong><br />
<strong>the</strong> end <strong>of</strong> <strong>the</strong> π-A iso<strong>the</strong>rm suggests th<strong>at</strong> for a large<br />
range <strong>of</strong> molecular areas <strong>the</strong> immedi<strong>at</strong>e environment <strong>of</strong><br />
<strong>the</strong> <strong>NBD</strong> chromophore <strong>of</strong> <strong>NBD</strong>(C 12 )-PC is <strong>the</strong> aqueous<br />
phase adjacent to <strong>the</strong> headgroup region where <strong>the</strong><br />
relax<strong>at</strong>ion <strong>of</strong> w<strong>at</strong>er molecules is extremely fast. 2 This<br />
explains why no REES effect was observed <strong>at</strong> areas above<br />
0.6 nm 2 /molecule. These findings are in good accord with<br />
<strong>the</strong> polarized fluorescence measurements and provide<br />
fur<strong>the</strong>r evidence th<strong>at</strong> looping <strong>of</strong> <strong>the</strong> <strong>NBD</strong>-labeled acyl chain<br />
projects <strong>the</strong> <strong>NBD</strong> group <strong>of</strong> <strong>NBD</strong>(C 12 )-PC deeper into <strong>the</strong><br />
w<strong>at</strong>er subphase where <strong>the</strong> rot<strong>at</strong>ion motions <strong>of</strong> <strong>the</strong> chromophore<br />
and surrounding w<strong>at</strong>er dipoles are not restricted<br />
to any significant extent by steric hindrance. In contrast,<br />
DPPE-<strong>NBD</strong> molecules are organized in condensed structures<br />
represented by <strong>the</strong> nonfluorescent rosette-shaped<br />
domains seen in Figure 3B in which <strong>the</strong> inherent photophysical<br />
properties <strong>of</strong> <strong>NBD</strong> are altered by interactions<br />
<strong>of</strong> chromophores with one ano<strong>the</strong>r and/or with phospholipid<br />
headgroups.<br />
3.5. Structural Ordering <strong>of</strong> <strong>the</strong> <strong>NBD</strong>-<strong>Phospholipids</strong><br />
in <strong>Monolayer</strong>s. As mentioned in section 3.2 above,<br />
an interesting fe<strong>at</strong>ure <strong>of</strong> <strong>the</strong> DPPE-<strong>NBD</strong> monolayer<br />
behavior is <strong>the</strong> double-layer ψ 0 potential whose dependence<br />
on <strong>the</strong> area per molecule devi<strong>at</strong>es significantly from<br />
th<strong>at</strong> predicted by <strong>the</strong> Gouy-Chapman <strong>the</strong>ory. Instead <strong>of</strong><br />
continuous growth <strong>of</strong> its neg<strong>at</strong>ive value with increasing<br />
surface density <strong>of</strong> neg<strong>at</strong>ively charged phospholipid molecules,<br />
18,51,52 <strong>the</strong> ψ 0 potential exhibits r<strong>at</strong>her unexpected<br />
vari<strong>at</strong>ions throughout monolayer compression. Figure 5B<br />
shows th<strong>at</strong> even though <strong>the</strong> ψ 0 potential does become more<br />
and more neg<strong>at</strong>ive in <strong>the</strong> expanded region as <strong>the</strong> surface<br />
density <strong>of</strong> PE - -<strong>NBD</strong> groups is increased (with decreasing<br />
area per molecule upon compression), <strong>the</strong> absolute value<br />
<strong>of</strong> ψ 0 starts to decrease upon onset <strong>of</strong> <strong>the</strong> π-A iso<strong>the</strong>rm<br />
pl<strong>at</strong>eau. This is clear evidence <strong>of</strong> a process which ei<strong>the</strong>r<br />
affects headgroup dissoci<strong>at</strong>ion or induces structural<br />
reorganiz<strong>at</strong>ion in <strong>the</strong> monolayer. As a result, <strong>the</strong> surface<br />
charge density <strong>at</strong> <strong>the</strong> air/w<strong>at</strong>er interface is altered so th<strong>at</strong><br />
<strong>the</strong> monolayer bears almost no charge in <strong>the</strong> condensed<br />
region (<strong>the</strong> ψ 0 potential in Figure 5B drops from ∼-350<br />
mV <strong>at</strong> an area <strong>of</strong> 0.8 nm 2 /molecule to approxim<strong>at</strong>ely -50<br />
(51) Taylor, D. M.; Oliveira, O. N., Jr.; Morgan, H. Chem. Phys. Lett.<br />
1989, 161, 147.<br />
(52) Aguilella, V. M.; Mafé, S.; Manzanares, J. A. Chem. Phys. Lipids<br />
2000, 105, 225.
<strong>Monolayer</strong> <strong>Behavior</strong> <strong>of</strong> <strong>NBD</strong>-<strong>Labeled</strong> <strong>Phospholipids</strong> Langmuir, Vol. 18, No. 14, 2002 5549<br />
Figure 9. Hydrogen-bond-controlled interactions and organiz<strong>at</strong>ion<br />
<strong>of</strong> DPPE-<strong>NBD</strong> molecules in nonfluorescent rosetteshaped<br />
domains. (a) A schem<strong>at</strong>ic represent<strong>at</strong>ion <strong>of</strong> <strong>the</strong> entire<br />
network <strong>of</strong> hydrogen bonds involving neighboring amino and<br />
phosph<strong>at</strong>idyl groups as well as w<strong>at</strong>er molecules <strong>of</strong> <strong>the</strong> PE - -<br />
<strong>NBD</strong> hydr<strong>at</strong>ion shell. Dotted lines illustr<strong>at</strong>e interactions<br />
including hydrogen bonding and redistribution <strong>of</strong> electron<br />
density in <strong>the</strong> benzenoid ring <strong>of</strong> <strong>NBD</strong>. (b) A top view <strong>of</strong> <strong>the</strong><br />
hexagonal packing <strong>of</strong> DPPE-<strong>NBD</strong> molecules in condensed-phase<br />
domains. Circles represent phosph<strong>at</strong>idylethanolamine headgroups,<br />
while filled blocks are <strong>NBD</strong> chromophores whose<br />
fluorescence is quenched as a result <strong>of</strong> disruption <strong>of</strong> <strong>the</strong><br />
π-conjug<strong>at</strong>ion p<strong>at</strong>hway in <strong>the</strong> benzenoid ring <strong>of</strong> <strong>NBD</strong>. (c) A top<br />
view <strong>of</strong> <strong>the</strong> packing structure in <strong>the</strong> rosette-shaped domains<br />
typically observed in <strong>the</strong> pl<strong>at</strong>eau region <strong>of</strong> <strong>the</strong> DPPE-<strong>NBD</strong><br />
iso<strong>the</strong>rm.<br />
mV <strong>at</strong> <strong>the</strong> end <strong>of</strong> <strong>the</strong> iso<strong>the</strong>rm). A plausible explan<strong>at</strong>ion<br />
considers <strong>the</strong> increasing interactions between neighboring<br />
PE - -<strong>NBD</strong> groups occurring through networks <strong>of</strong> <strong>the</strong><br />
hydrogen bonds as shown schem<strong>at</strong>ically in Figure 9a. Due<br />
to <strong>the</strong> intermolecular H‚‚‚O bridges, a large displacement<br />
<strong>of</strong> electron density may occur, leading to an extended<br />
delocaliz<strong>at</strong>ion <strong>of</strong> <strong>the</strong> neg<strong>at</strong>ive charge <strong>of</strong> <strong>the</strong> phosph<strong>at</strong>idyl<br />
group over <strong>the</strong> <strong>NBD</strong> benz<strong>of</strong>urazan ring system. 1,10 Eventually,<br />
<strong>the</strong> nitrogen <strong>at</strong>om <strong>of</strong> <strong>the</strong> <strong>NBD</strong> nitro group acquires<br />
a partial positive charge, while a neg<strong>at</strong>ive charge is shared<br />
between <strong>the</strong> oxygen <strong>at</strong>oms. Thus, such intermolecular<br />
charge interactions through <strong>the</strong> hydrogen bonding involving<br />
neighboring amino and phosph<strong>at</strong>idyl groups as well<br />
as w<strong>at</strong>er molecules <strong>of</strong> <strong>the</strong> PE - -<strong>NBD</strong> hydr<strong>at</strong>ion shell are<br />
likely a reason for <strong>the</strong> decreasing neg<strong>at</strong>ive charge <strong>of</strong> <strong>the</strong><br />
DPPE-<strong>NBD</strong> monolayer. Moreover, <strong>the</strong>se interactions can<br />
also be responsible for <strong>the</strong> observed monolayer structuring<br />
and appearance <strong>of</strong> <strong>the</strong> nonfluorescent condensed-phase<br />
domains in <strong>the</strong> pl<strong>at</strong>eau <strong>of</strong> <strong>the</strong> π-A iso<strong>the</strong>rm as those in<br />
Figure 3B. Figure 9a shows th<strong>at</strong> <strong>the</strong> <strong>NBD</strong>-w<strong>at</strong>er interactions<br />
cause a disruption <strong>of</strong> <strong>the</strong> π-conjug<strong>at</strong>ion p<strong>at</strong>hway<br />
for CT between <strong>the</strong> amino group and <strong>the</strong> nitro group in<br />
<strong>the</strong> benzenoid ring <strong>of</strong> <strong>NBD</strong> and, hence, may facilit<strong>at</strong>e rapid<br />
S 1 f S 0 internal conversion. Consequently, a blue shift <strong>of</strong><br />
<strong>the</strong> absorption maximum accompanied by a red shift <strong>of</strong><br />
<strong>the</strong> emission maximum and significant quenching <strong>of</strong> <strong>the</strong><br />
<strong>NBD</strong> fluorescence are expected. 46 The fact th<strong>at</strong> both <strong>the</strong>se<br />
shifts and quenching were indeed observed for <strong>the</strong> DPPE-<br />
<strong>NBD</strong> monolayer <strong>at</strong> areas below 0.8 nm 2 /molecule strongly<br />
supports our model <strong>of</strong> <strong>the</strong> organiz<strong>at</strong>ion <strong>of</strong> <strong>the</strong> DPPE-<strong>NBD</strong><br />
molecules <strong>at</strong> <strong>the</strong> air/w<strong>at</strong>er interface. Additionally, this<br />
model is also in good agreement with <strong>the</strong> polarized<br />
fluorescence and REES d<strong>at</strong>a. The drawing in Figure 9a<br />
demonstr<strong>at</strong>es th<strong>at</strong> <strong>the</strong> entire network <strong>of</strong> intermolecular<br />
hydrogen bonds provides a regular alignment <strong>of</strong> uniformly<br />
oriented chromophores strongly interacting with each<br />
o<strong>the</strong>r and w<strong>at</strong>er molecules. This fe<strong>at</strong>ure <strong>of</strong> <strong>the</strong> structural<br />
ordering in <strong>the</strong> DPPE-<strong>NBD</strong> monolayer requires a narrow<br />
distribution <strong>of</strong> <strong>the</strong> angle θ like th<strong>at</strong> revealed by <strong>the</strong> DPPE-<br />
<strong>NBD</strong> fluorescence anisotropy (Table 1). It also slows <strong>the</strong><br />
r<strong>at</strong>e <strong>of</strong> reorient<strong>at</strong>ion <strong>of</strong> <strong>the</strong> w<strong>at</strong>er dipoles surrounding <strong>the</strong><br />
<strong>NBD</strong> chromophore, giving rise to REES effects such as<br />
those discussed above (Table 1). Fur<strong>the</strong>rmore, <strong>the</strong> complex<br />
PE - -<strong>NBD</strong>-w<strong>at</strong>er interactions are <strong>of</strong> primary importance<br />
in determining <strong>the</strong> packing structure in <strong>the</strong> DPPE-<strong>NBD</strong><br />
domains. Given th<strong>at</strong> <strong>the</strong> phospholipids pack <strong>the</strong>mselves<br />
in face-centered structures, 34,39 a packing configur<strong>at</strong>ion<br />
stabilizing <strong>the</strong> monolayer by <strong>the</strong> form<strong>at</strong>ion <strong>of</strong> ferroelectric<br />
domains may be depicted as <strong>the</strong> array in Figure 9b. It is<br />
clearly seen th<strong>at</strong> <strong>the</strong> bond orient<strong>at</strong>ional order <strong>of</strong> PE - -<br />
<strong>NBD</strong> groups in Figure 9b leads to a 6-fold symmetry 34<br />
and, consequently, should favor form<strong>at</strong>ion <strong>of</strong> a hex<strong>at</strong>ic<br />
solidlike phase in <strong>the</strong> DPPE-<strong>NBD</strong> monolayer. The hex<strong>at</strong>ics<br />
are known to form domains <strong>of</strong> different shapes depending<br />
on <strong>the</strong> LE-LC boundary conditions. 53 In particular, large<br />
boundary defect line energies may initi<strong>at</strong>e <strong>the</strong> growth <strong>of</strong><br />
six petals <strong>of</strong> <strong>the</strong> rosette-like domains observed in Figure<br />
3B whose perimeter resembles a segment <strong>of</strong> a circle 53 as<br />
illustr<strong>at</strong>ed in Figure 9c. Thus, our model <strong>of</strong> <strong>the</strong> hydrogenbond-controlled<br />
alignment <strong>of</strong> PE - -<strong>NBD</strong> groups is in good<br />
agreement with <strong>the</strong> observ<strong>at</strong>ion <strong>of</strong> nonfluorescent rosetteshaped<br />
domains typical <strong>of</strong> micrographs <strong>of</strong> a DPPE-<strong>NBD</strong><br />
monolayer in <strong>the</strong> pl<strong>at</strong>eau <strong>of</strong> <strong>the</strong> π-A iso<strong>the</strong>rm.<br />
Unfortun<strong>at</strong>ely, no absolute conclusions can be made on<br />
structural ordering <strong>of</strong> <strong>the</strong> <strong>NBD</strong>(C 12 )-PC molecules <strong>at</strong> <strong>the</strong><br />
air/w<strong>at</strong>er interface because <strong>of</strong> a number <strong>of</strong> uncertainties<br />
associ<strong>at</strong>ed with <strong>the</strong> interpret<strong>at</strong>ion <strong>of</strong> <strong>the</strong> experimental<br />
d<strong>at</strong>a on <strong>the</strong> <strong>NBD</strong>(C 12 )-PC monolayer. The looping <strong>of</strong> <strong>the</strong><br />
<strong>NBD</strong>-labeled acyl chain toward w<strong>at</strong>er likely disrupts<br />
conventional processes for forming condensed phosph<strong>at</strong>idilcholine<br />
domains as <strong>the</strong> aliph<strong>at</strong>ic chains embedded in<br />
<strong>the</strong> polar region <strong>of</strong> <strong>the</strong> <strong>NBD</strong>(C 12 )-PC monolayer hinder<br />
<strong>the</strong> interactions between <strong>the</strong> phosph<strong>at</strong>idylcholine zwit-<br />
(53) Fischer, T. M.; Bruinsma, R. F.; Knobler, C. M. Phys. Rev. E<br />
1994, 50, 413.
5550 Langmuir, Vol. 18, No. 14, 2002 Tsukanova et al.<br />
terions. An immedi<strong>at</strong>e consequence is th<strong>at</strong>, instead <strong>of</strong> <strong>the</strong><br />
uniform kidney-shaped domains typical <strong>of</strong> DPPC monolayers,<br />
12 <strong>the</strong> micrograph in Figure 4B exhibits irregularly<br />
distributed domains, varying in both shape and size. The<br />
complex morphology <strong>of</strong> <strong>the</strong> <strong>NBD</strong>(C 12 )-PC monolayer<br />
suggests th<strong>at</strong> <strong>the</strong> long C 12 chain bearing <strong>the</strong> <strong>NBD</strong><br />
chromophore provides more flexibility, thus allowing <strong>the</strong><br />
<strong>NBD</strong> chromophore to adopt distinct local orient<strong>at</strong>ions.<br />
Presumably, more than one popul<strong>at</strong>ion <strong>of</strong> <strong>NBD</strong> chromophores<br />
exists, not characterized merely by different<br />
orient<strong>at</strong>ions <strong>at</strong> <strong>the</strong> air/w<strong>at</strong>er interface, but also experiencing<br />
different interactions with phosph<strong>at</strong>idylcholine<br />
headgroups and hydr<strong>at</strong>ion w<strong>at</strong>er. As seen in Figure 4B,<br />
two kinds <strong>of</strong> condensed structures started to grow<br />
simultaneously when <strong>the</strong> monolayer was compressed to<br />
an area <strong>of</strong> 0.82 nm 2 /molecule. On <strong>the</strong> basis <strong>of</strong> <strong>the</strong> discussion<br />
above, one could postul<strong>at</strong>e th<strong>at</strong> hydrogen-bond-controlled<br />
interactions similar to those occurring in <strong>the</strong> DPPE-<strong>NBD</strong><br />
monolayer cause <strong>the</strong> appearance <strong>of</strong> <strong>the</strong> tiny nonfluorescent<br />
circular domains while <strong>the</strong> highly fluorescent domains<br />
could result from charge-quadrupole <strong>at</strong>tractions between<br />
<strong>the</strong> positive choline group and π-electrons <strong>of</strong> <strong>NBD</strong>. 54<br />
According to Huster et al., 6 c<strong>at</strong>ion-π interactions determine<br />
<strong>the</strong> localiz<strong>at</strong>ion <strong>of</strong> <strong>the</strong> <strong>NBD</strong> group in <strong>the</strong> vicinity <strong>of</strong><br />
<strong>the</strong> phospholipid headgroups. This hypo<strong>the</strong>sis seems to<br />
be consistent with our spectroscopy d<strong>at</strong>a. Indeed, <strong>the</strong><br />
intermolecular c<strong>at</strong>ion-π interactions along <strong>the</strong> 6-fold axis<br />
<strong>of</strong> <strong>the</strong> <strong>NBD</strong> benzenoid ring are expected to reinforce <strong>the</strong><br />
electronic <strong>at</strong>traction <strong>of</strong> <strong>the</strong> nitro group and, consequently,<br />
lead to an increase in resonance 46 which agrees well with<br />
<strong>the</strong> increase in <strong>the</strong> fluorescence intensity and <strong>the</strong> b<strong>at</strong>hochromic<br />
shift <strong>of</strong> both absorption and emission maxima<br />
observed <strong>at</strong> areas below 0.82 nm 2 /molecule (see Figure 7).<br />
At <strong>the</strong> same time, though responsible for <strong>the</strong> aggreg<strong>at</strong>ion<br />
<strong>of</strong> <strong>the</strong> <strong>NBD</strong>(C 12 )-PC molecule in <strong>the</strong> fluorescent domains,<br />
<strong>the</strong> c<strong>at</strong>ion-π interactions do not cre<strong>at</strong>e an entire network<br />
<strong>of</strong> rigid bonds, and hence, <strong>the</strong>y allow some in-plane rot<strong>at</strong>ion<br />
<strong>of</strong> <strong>the</strong> <strong>NBD</strong> chromophore <strong>of</strong> <strong>NBD</strong>(C 12 )-PC and fast<br />
relax<strong>at</strong>ion <strong>of</strong> surrounding w<strong>at</strong>er dipoles. This explains<br />
<strong>the</strong> lack <strong>of</strong> anisotropy in <strong>the</strong> fluorescence <strong>of</strong> <strong>NBD</strong>(C 12 )-PC<br />
and rel<strong>at</strong>ively minor REES effects.<br />
Conclusions<br />
The monolayer behavior <strong>of</strong> <strong>NBD</strong>-labeled analogues <strong>of</strong><br />
DPPE and DPPC was studied <strong>at</strong> <strong>the</strong> air/w<strong>at</strong>er interface<br />
by a variety <strong>of</strong> methods. Typically, a main concern about<br />
using <strong>NBD</strong>-phospholipid analogues as membrane probes<br />
is to wh<strong>at</strong> extent <strong>the</strong> labeling with <strong>the</strong> <strong>NBD</strong> chromophore<br />
alters <strong>the</strong> properties <strong>of</strong> n<strong>at</strong>ive phospholipids and <strong>the</strong>ir<br />
interactions. Our study showed th<strong>at</strong>, in contrast to <strong>the</strong><br />
condensed-type DPPE iso<strong>the</strong>rm, a liquid-expanded/liquidcondensed<br />
phase transition pl<strong>at</strong>eau appears in <strong>the</strong> <strong>NBD</strong>-<br />
DPPE iso<strong>the</strong>rm while <strong>the</strong> <strong>NBD</strong>(C 12 )-PC monolayer is<br />
completely liquid-expanded, exhibiting a lack <strong>of</strong> <strong>the</strong><br />
pl<strong>at</strong>eau observed in <strong>the</strong> DPPC iso<strong>the</strong>rm. However, <strong>the</strong><br />
expanded-type <strong>NBD</strong>(C 12 )-PC monolayer showed a r<strong>at</strong>her<br />
complex morphology where two kinds <strong>of</strong> condensed<br />
structures were clearly distinguished in <strong>the</strong> homogeneous<br />
(54) Dougherty, D. A. Science 1996, 271, 163.<br />
background by fluorescence microscopy. Analysis <strong>of</strong><br />
surface potential d<strong>at</strong>a revealed th<strong>at</strong>, despite differences<br />
in <strong>the</strong> chemical structures <strong>of</strong> <strong>the</strong> two <strong>NBD</strong>-labeled<br />
phospholipids, <strong>the</strong> <strong>NBD</strong> group <strong>of</strong> both DPPE-<strong>NBD</strong> and<br />
<strong>NBD</strong>(C 12 )-PC is embedded in <strong>the</strong> headgroup region <strong>of</strong> <strong>the</strong><br />
monolayer. In <strong>the</strong> case <strong>of</strong> acyl-chain-labeled <strong>NBD</strong>(C 12 )-<br />
PC, this suggests a looping <strong>of</strong> <strong>the</strong> <strong>NBD</strong>-labeled chain<br />
toward w<strong>at</strong>er. Spectroscopic evidence also indic<strong>at</strong>es a<br />
localiz<strong>at</strong>ion <strong>of</strong> <strong>the</strong> <strong>NBD</strong> chromophore for both phospholipid<br />
compounds within <strong>the</strong> monolayer headgroup region: <strong>the</strong><br />
positions <strong>of</strong> <strong>the</strong> absorption fluorescence maxima for <strong>NBD</strong><br />
in <strong>the</strong>se monolayers were very close to <strong>the</strong> values <strong>of</strong><br />
absorption and fluorescence maxima <strong>of</strong> <strong>NBD</strong> in w<strong>at</strong>er.<br />
Moreover, Cu 2+ quenching experiments proved th<strong>at</strong> <strong>NBD</strong><br />
groups <strong>of</strong> <strong>NBD</strong>(C 12 )-PC were exposed directly to <strong>the</strong><br />
aqueous phase. However, though localized in similar<br />
monolayer regions, <strong>the</strong> <strong>NBD</strong> chromophore <strong>of</strong> DPPE-<strong>NBD</strong><br />
and th<strong>at</strong> <strong>of</strong> <strong>NBD</strong>(C 12 )-PC were found to adopt distinct<br />
orient<strong>at</strong>ions <strong>at</strong> <strong>the</strong> air/w<strong>at</strong>er interface, and experience<br />
different interactions with phospholipid headgroups and<br />
surrounding w<strong>at</strong>er dipoles. Polarized fluorescence and<br />
REES studies supported a structural model showing<br />
regular alignment <strong>of</strong> uniformly oriented <strong>NBD</strong> chromophores<br />
in <strong>the</strong> DPPE-<strong>NBD</strong> monolayer. These oriented<br />
chromophores strongly interact with each o<strong>the</strong>r, phosph<strong>at</strong>idylethanolamine<br />
headgroups, and w<strong>at</strong>er molecules<br />
through networks <strong>of</strong> intermolecular hydrogen bonds where<br />
chromophore mobility as well as reorient<strong>at</strong>ional motion<br />
<strong>of</strong> w<strong>at</strong>er dipoles around excited-st<strong>at</strong>e chromophores is<br />
considerably restricted. The <strong>NBD</strong> groups <strong>of</strong> <strong>NBD</strong>(C 12 )-PC<br />
are also organized in condensed structures, proposed to<br />
result from intermolecular interactions provided by<br />
c<strong>at</strong>ion-π electrost<strong>at</strong>ic forces between <strong>the</strong> positive choline<br />
group and π-electrons <strong>of</strong> <strong>NBD</strong>. Never<strong>the</strong>less, <strong>the</strong> <strong>NBD</strong><br />
group in <strong>the</strong>se monolayers experiences a less-structured<br />
environment th<strong>at</strong> permits in-plane rot<strong>at</strong>ion <strong>of</strong> <strong>the</strong> <strong>NBD</strong><br />
chromophore on <strong>NBD</strong>(C 12 )-PC and fast relax<strong>at</strong>ion <strong>of</strong><br />
surrounding w<strong>at</strong>er dipoles.<br />
Altoge<strong>the</strong>r, <strong>the</strong> results <strong>of</strong> <strong>the</strong> present study underscore<br />
th<strong>at</strong> <strong>the</strong> monolayer behavior <strong>of</strong> <strong>the</strong> <strong>NBD</strong>-labeled phospholipids<br />
differs significantly from th<strong>at</strong> <strong>of</strong> <strong>the</strong> parent<br />
phospholipids, and consequently, <strong>the</strong>y should be used as<br />
analogues <strong>of</strong> n<strong>at</strong>ural phospholipids with caution when<br />
acyl chain conform<strong>at</strong>ion or motility <strong>of</strong> <strong>NBD</strong> is important.<br />
At <strong>the</strong> same time, <strong>the</strong> unique sensitivity <strong>of</strong> <strong>NBD</strong> photophysical<br />
properties to changes in local polarity and<br />
structural ordering <strong>of</strong> <strong>the</strong> environment surrounding <strong>the</strong><br />
chromophore makes <strong>NBD</strong>-labeled analogues advantageous<br />
for <strong>the</strong> study <strong>of</strong> phospholipid organiz<strong>at</strong>ion <strong>at</strong><br />
interfaces.<br />
Acknowledgment. We thank <strong>the</strong> N<strong>at</strong>ural Sciences<br />
and Engineering Research Council <strong>of</strong> Canada for <strong>the</strong><br />
financial support <strong>of</strong> this study. C.S. is a chercheur boursier<br />
senior <strong>of</strong> <strong>the</strong> Fonds de recherche en santé du Québec. An<br />
invit<strong>at</strong>ion fellowship <strong>of</strong> <strong>the</strong> Centre de Recherche en<br />
Sciences et Ingénierie des Macromolécules (Quebec,<br />
Canada) to V.T. is also gr<strong>at</strong>efully acknowledged.<br />
LA0256174