economic analysis of small-scale tilapia aquaculture in mozambique
economic analysis of small-scale tilapia aquaculture in mozambique
economic analysis of small-scale tilapia aquaculture in mozambique

Create successful ePaper yourself
Turn your PDF publications into a flip-book with our unique Google optimized e-Paper software.
Salia<br />
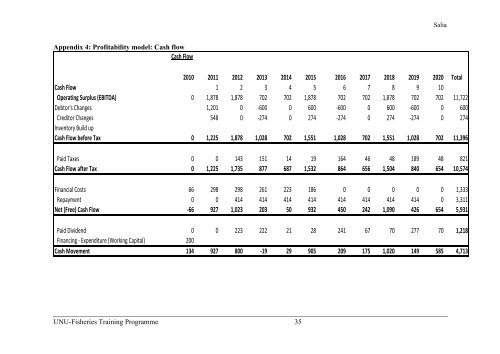
Appendix 4: Pr<strong>of</strong>itability model: Cash flow<br />
Cash Flow<br />
2010 2011 2012 2013 2014 2015 2016 2017 2018 2019 2020 Total<br />
Cash Flow 1 2 3 4 5 6 7 8 9 10<br />
Operat<strong>in</strong>g Surplus (EBITDA) 0 1,878 1,878 702 702 1,878 702 702 1,878 702 702 11,722<br />
Debtor's Changes 1,201 0 -600 0 600 -600 0 600 -600 0 600<br />
Creditor Changes 548 0 -274 0 274 -274 0 274 -274 0 274<br />
Inventory Build up<br />
Cash Flow before Tax 0 1,225 1,878 1,028 702 1,551 1,028 702 1,551 1,028 702 11,396<br />
Paid Taxes 0 0 143 151 14 19 164 46 48 189 48 821<br />
Cash Flow after Tax 0 1,225 1,735 877 687 1,532 864 656 1,504 840 654 10,574<br />
F<strong>in</strong>ancial Costs 66 298 298 261 223 186 0 0 0 0 0 1,333<br />
Repayment 0 0 414 414 414 414 414 414 414 414 0 3,311<br />
Net (Free) Cash Flow -66 927 1,023 203 50 932 450 242 1,090 426 654 5,931<br />
Paid Dividend 0 0 223 222 21 28 241 67 70 277 70 1,218<br />
F<strong>in</strong>anc<strong>in</strong>g - Expenditure (Work<strong>in</strong>g Capital) 200<br />
Cash Movement 134 927 800 -19 29 905 209 175 1,020 149 585 4,713<br />
UNU-Fisheries Tra<strong>in</strong><strong>in</strong>g Programme 35