risk management - monitor ii
risk management - monitor ii
risk management - monitor ii

You also want an ePaper? Increase the reach of your titles
YUMPU automatically turns print PDFs into web optimized ePapers that Google loves.
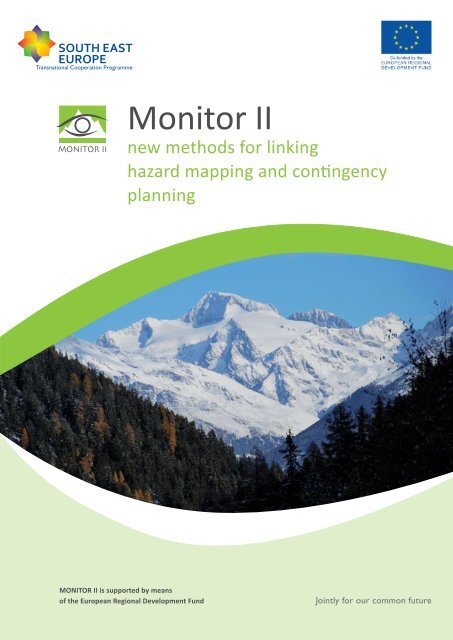
Monitor II<br />
new methods for linking<br />
hazard mapping and contingency<br />
planning<br />
MONITOR II is supported by means<br />
of the European Regional Development Fund<br />
Jointly for our common future
2 Monitor II Impressum<br />
Monitor II Preface 3<br />
Preface<br />
The views expressed in this brochure are<br />
the views of the authors and do not<br />
necessarily reflect the views of the institutions<br />
they represent.<br />
All rights reserved.<br />
Reproduction and dissemination of material<br />
from this publication for educational or other<br />
non-commercial purposes are authorised<br />
without any prior written permission from the<br />
copyright holders provided the source if fully<br />
acknowledged.<br />
Reproduction of material from this publication<br />
for resale or other commercial purposes is<br />
prohibited without written permission of the<br />
copyright holders.<br />
Editor:<br />
Hubert Siegel, Austrian Federal Ministry of<br />
Agriculture, Forestry, Environment and Water<br />
Management, Subdivision for Landscape<br />
Planning and Risk Prevention<br />
Authors:<br />
Stefan Kollarits, Diethart Leber, Alessandro<br />
Corsini, Joze Papez, Tanja Preseren, Ingo<br />
Schnetzer, Albert Schwingshandl, Stefan<br />
Kreutzer, Kathrin Plunger, Martina Stefani<br />
With valuable inputs from<br />
Daniel Kozelj, Franci Steinman, Nina<br />
Dobrinkowa, Christian Rachoy, Petriso Vica,<br />
Francesco Ronchetti, Thomas Plattner<br />
Layout:<br />
Barbara Veit, Veitdesign<br />
ISBN:<br />
Copyright © 2010<br />
While severe natural hazards are increasing<br />
also in SEES, the South Eastern European<br />
Space hazard and contingency planning are<br />
lagging behind.<br />
In the scope of MONITOR II, gaps in existing<br />
hazard and contingency plans are reduced.<br />
Where existing, their usability is improved by<br />
implementing regular update procedures for<br />
emergency preparation and by integrating realtime<br />
situation maps in case of disaster.<br />
Within the broad range of hazards, MONITOR<br />
II specifically deals with floods and landslides,<br />
as prominent examples of natural hazards. But<br />
the concepts and solutions of MONITOR II are<br />
being developed in a more general way, which<br />
allows for application and adaptation to other<br />
types of hazards as well.<br />
For this end, MONITOR II aims to support<br />
disaster <strong>management</strong> by improving availability,<br />
reliability and communicability of hazard maps<br />
and contingency plans. Some major problems<br />
have been identified as obstacles to these aims,<br />
and they are common to all partner territories:<br />
Lack of available hazard maps and<br />
contingency plans<br />
• The effort of preparing hazard maps and<br />
contingency plans is high because no<br />
commonly accepted methodology in plan<br />
development is available. Standardised<br />
terminology and a common best-practice<br />
knowledge base are needed.<br />
Lack of usability of hazard maps and<br />
contingency plans<br />
• Most of existing contingency plans are<br />
well suited for providing experts and task<br />
forces with a clear course of actions in case<br />
of a disaster. But when it comes to usability<br />
and effectiveness, great potential for<br />
improvements can be found.<br />
Lack of communication support<br />
between stakeholders<br />
• Experts, practitioners, decision makers<br />
and the public have differing problem views<br />
and specific requirements on the<br />
presentation of information.<br />
Lack of transnational approach<br />
• Natural hazards do not end at national<br />
borders. Still, transnational standards in<br />
hazard mapping and contingency planning<br />
are fragmentary.<br />
The solutions provided by MONITOR II aim at<br />
these objectives:<br />
The main objective of MONITOR II is to<br />
improve information provision for disaster<br />
<strong>management</strong>.<br />
This strengthens communication between<br />
hazard experts, decision makers and civil<br />
Protection services with improved flow of<br />
information. By means of this improved<br />
situation the following goals are supported:<br />
Legal and organisational aspects: to minimize<br />
identified disparities in the SEES region<br />
regarding the degree of coverage with hazard<br />
plans and contingency plans according to<br />
assessed priorities.<br />
Technological aspects: to develop tools and<br />
procedures to integrate different sources of information,<br />
from (real-time) <strong>monitor</strong>ing systems,<br />
records of past events, hazard analysis and<br />
expert knowledge on hazard processes:<br />
• To improve the availability and effectiveness<br />
of contingency plans and hazard maps with<br />
respect to natural hazards;<br />
• To improve reliability of information by<br />
dynamisation: dynamisation of contingency<br />
plans (culminating in real-time information)<br />
and automation of<br />
The results of MONITOR II are made available<br />
to a broad audience by a series of dedicated<br />
documents, which build on each other.<br />
This special brochure deals with the state of<br />
the art of hazard mapping and contingency<br />
planning and provides a general framework for<br />
adaptations and improvements.<br />
This brochure is intended to provide<br />
information to<br />
• experts of hazard mapping<br />
and natural hazards<br />
• authorities competent for disaster<br />
<strong>management</strong>, esp. contingency<br />
planning.<br />
The goal of the brochure is to provide these<br />
groups with a better understanding of the<br />
tasks and needs of each other. The long<br />
term goal is to improve communication<br />
between these domain expert groups.<br />
As a state-of-the-art analysis, this brochure<br />
also provides a discussion of the problems<br />
and issues arisen out of partners testbeds<br />
and factsheets. This will show the way<br />
towards solutions steps necessary – to be<br />
carried out within the project and beyond<br />
the project proper.
4 Monitor II Risk <strong>management</strong> introduction<br />
Monitor II Risk <strong>management</strong> introduction 5<br />
Picture 1: Situation outside dambreak (Evros river, Greece)<br />
The context:<br />
<strong>risk</strong> <strong>management</strong><br />
Natural hazards and disasters<br />
Physical world – what happens<br />
Starting point for terminology development<br />
is the basic interrelation between the<br />
environment and events changing the<br />
environment: the physical world describes the<br />
“objective” world of objects, events and the<br />
impacts of events on objects.<br />
Natural hazards account for a substantial<br />
and growing proportion of disasters in Europe.<br />
Between 1998 and 2002 alone, Europe<br />
suffered over 100 major damaging floods,<br />
including the catastrophic floods along the<br />
Danube and Elbe rivers in 2002. Since 1998,<br />
floods have caused some 700 fatalities, the<br />
displacement of about half a million people<br />
and at least € 25 billion in insured economic<br />
losses (http://ec.europa.eu/environment/<br />
water/flood_<strong>risk</strong>/impacts.htm). In reaction to<br />
the floods of 2002 the European Union has<br />
started an initiave in order to mitigate the<br />
effects of these hazards – the Floods Directive<br />
(Directive 2007/60/EC of the European<br />
Parliament and of the Council of 23 October<br />
2007 on the assessment andf <strong>management</strong> of<br />
flood <strong>risk</strong>s). For hazards related to floods this<br />
directive defines several obligatory measures of<br />
<strong>risk</strong> <strong>management</strong>.<br />
Risk <strong>management</strong> aims at preventing or<br />
r educing damages resulting from hazardous<br />
events. As any other domain of expertise it<br />
uses a wide range of terms, which are quite<br />
often used in an ambiguous way. Ambiguity<br />
is a direct result of the broad range of actors<br />
involved in disaster <strong>management</strong>, the splitting<br />
of competences and the heterogeneity of<br />
experts and fields of expertise involved. In<br />
addition, actors, competences and fields of<br />
expertise usually change between the phases<br />
of <strong>risk</strong> <strong>management</strong> – leading to disruptures of<br />
communication, knowledge <strong>management</strong> and<br />
activities.<br />
As a result practical experience shows that<br />
some of the definitions are not fully clear to<br />
the actors and are often used somehow<br />
contradictionary. Therefore a short introduction<br />
with a clear and concise definition is<br />
given below for those terms used within the<br />
MONITOR II approach.<br />
Figure 1: Risk <strong>management</strong> terms: real world (S. KOLLARITS et al. 2007)<br />
If objects of the environment participate in<br />
events (which actually means a spatio-temporal<br />
co-location) we talk about exposure, they are<br />
exposed to these events. Events happen within<br />
this environment and cause impacts.<br />
An impact “changes” (qualities of) the<br />
environment. A change of quality in this<br />
context may include substantial changes like<br />
generation and destruction of objects.<br />
The main terms associated with the physical<br />
world are objects (of the environment), events<br />
and impacts. These are related to each other by<br />
exposure, causation and effect.<br />
Social world – how is the physical<br />
world interpreted<br />
People perceive and evaluate events and<br />
their impacts on the environment in heterogeneous<br />
ways. There is not a single unified<br />
view of how these impacts are to be evaluated.<br />
Social concepts classify elements of the real<br />
world in order to make them communicable<br />
and knowledge interchangeable. Without
6 Monitor II Risk <strong>management</strong> introduction<br />
Monitor II Risk <strong>management</strong> introduction 7<br />
Risk <strong>management</strong><br />
Figure 2: Basic social <strong>risk</strong> terms (S. KOLLARITS et al. 2007)<br />
social concepts no communication about<br />
objects and events is possible, because they<br />
provide the basis for mutual understanding.<br />
But this classification is always depending on<br />
context as much as on the social collective,<br />
which finds agreement on a specific social<br />
concept. Social concepts can thus not be seen<br />
as constants, but rather as changing views of<br />
the world, depending on a common<br />
agreement of some social collective.<br />
The starting point for any discussion of disaster<br />
<strong>management</strong> is the term damage.<br />
on terms<br />
Damage<br />
A damage (is the social concept<br />
which) classifies an impact of<br />
some event to have negative<br />
consequences.<br />
Loss<br />
A loss is damage quantified by<br />
values.<br />
Value<br />
A value (is the social concept<br />
which) classifies an object according<br />
to a specified value scale.<br />
This scale reflects the social<br />
principles, goals, or standards held<br />
or accepted by an individual, class,<br />
society or other social object.<br />
Based on this general view of a<br />
value system the value in a<br />
narrower sense can be defined in<br />
money or goods (market price).<br />
on terms<br />
Based on the concept of damage<br />
the term hazard can be defined:<br />
Hazard<br />
Hazard is an event, which causes<br />
damage. This includes both the<br />
actual event and the potential event.<br />
The term hazard thus depends on<br />
the definition of damage.<br />
Vulnerability<br />
Vulnerability is the quality of<br />
(objects of) the environment, which<br />
determines damage, given a<br />
defined (hazardous) event.<br />
Vulnerability is thus the quality<br />
of an object, which describes its<br />
probability of getting harmed in an<br />
event. Vulnerability can be seen as<br />
inversely related to the capacities<br />
of objects to anticipate, to cope<br />
with, to resist and to recover from<br />
an extreme event.<br />
Risk<br />
Here <strong>risk</strong> is seen as a quality (the<br />
probability) of an impact, which is<br />
classified as damage. In more casual<br />
language this would mean that <strong>risk</strong><br />
is the probability that something<br />
(anything) negative will happen.<br />
Elements at <strong>risk</strong><br />
Objects of the environment,<br />
which are (spatially, temporally)<br />
exposed to hazards.<br />
A scenario is a description of<br />
a course of future events, based<br />
on a consistent and plausible<br />
set of assumptions about future<br />
conditions.<br />
Risk <strong>management</strong> deals with hazards and is<br />
the continuous, process-like <strong>management</strong><br />
which aims at reducing <strong>risk</strong> to an acceptable<br />
level (acceptable <strong>risk</strong>). The corresponding goal<br />
situation is security.<br />
For <strong>risk</strong> <strong>management</strong> the society – explicitly<br />
or implicitly – first defines the acceptable level<br />
of <strong>risk</strong> (normatively). Risk <strong>management</strong> assesses<br />
<strong>risk</strong> and defines and implements the measures<br />
necessary to reach this acceptable level of <strong>risk</strong>.<br />
The <strong>risk</strong> remaining is the residual <strong>risk</strong>.<br />
If all measures defined have been implemented<br />
then the residual <strong>risk</strong> is the <strong>risk</strong> resulting<br />
from hazardous events, which have not been<br />
accounted for in terms of intensity of the event.<br />
Risk <strong>management</strong> is concerned with extreme<br />
events, which are not accounted for in the<br />
everyday routines of dealing with <strong>risk</strong> and can<br />
thus lead to severe negative consequences.<br />
Scenario<br />
In order to be able to treat <strong>risk</strong>, i.e. to<br />
implement measures for <strong>risk</strong> reduction,<br />
assumptions about possible events and their<br />
impacts must be defined. These assumptions<br />
are called scenarios and serve as a starting<br />
point of all <strong>risk</strong> <strong>management</strong> activities.<br />
These conditions usually describe parameters<br />
of events (e.g. rainfall intensity above a certain<br />
threshold) and capacities of objects (e.g.<br />
function or failure of protective structures).<br />
All disaster related <strong>management</strong> strategies<br />
are related to a scenario of a defined extent<br />
(characterized by the intensity of the the event<br />
and the vulnerability of the elements at <strong>risk</strong>).<br />
Thus any <strong>risk</strong> <strong>management</strong> strategy depends<br />
on pre-defined scenarios.<br />
Risk treatment strategies provide different<br />
principles (methods) for the definition of <strong>risk</strong><br />
treatment measures.<br />
Seen from the perspective of a disaster event,<br />
<strong>risk</strong> <strong>management</strong> is a cycle of recurrent<br />
activities. This cycle has been named “<strong>risk</strong><br />
<strong>management</strong> cycle”. For MONITOR II the<br />
current definitions of PLANALP where taken<br />
as a starting point (figure 4).
8 Monitor II Risk <strong>management</strong> introduction<br />
Monitor II Risk <strong>management</strong> introduction 9<br />
The basic phases of disaster <strong>management</strong><br />
are defined by their temporal relation to the<br />
occurance of hazard events:<br />
Establish the<br />
Context<br />
Figure 3: Strategies of <strong>risk</strong> treatment (S. KOLLARITS et al. 2007)<br />
Preparedness<br />
Preparedness is the phase of planning activities<br />
with a long-term view on <strong>risk</strong> <strong>management</strong>.<br />
Activities within this phase aim at the reduction<br />
of vulnerability (to negative consequences from<br />
hazardous events) and at the reduction<br />
of hazard potential and exposure to hazards.<br />
WISNER et al. (2003²) have defined vulnerability<br />
as being dependent (inversely) on<br />
• the capacity to anticipate<br />
• the capacity to cope with<br />
• the capacity to resist and<br />
• the capacity to recover from<br />
an extreme event.<br />
Response<br />
Response is the phase of reaction to an<br />
ongoing or impeding (potentially) disaster<br />
event with a short-term view on <strong>risk</strong><br />
<strong>management</strong>. Activities within this phase relate<br />
to the emergency operation during the impact<br />
of a disaster and the short-term aftermath.<br />
The main emphasis is on the saving of human<br />
life but it also encompasses the protection of<br />
assets, the supply of vital goods and services,<br />
and protection of environment.<br />
Hazard<br />
Identification &<br />
Characterisation<br />
Risk (components)<br />
analysis<br />
Risk evaluation<br />
Risk treatment<br />
Figure 5: Risk <strong>management</strong><br />
overview (adapted from<br />
Australian/New Zealand<br />
Standard on Risk Management).<br />
Situations<br />
and Measures<br />
The identification and assessment of situations<br />
is a primary prerequisiste in <strong>risk</strong> <strong>management</strong>.<br />
In all phases of <strong>risk</strong> <strong>management</strong> situations<br />
have to be assessed with a maximum of<br />
reliability in order to identify the appropriate<br />
measures for <strong>risk</strong> <strong>management</strong>.<br />
Situations are social objects, which are the<br />
setting for at least one event. Situations<br />
provide the link for both social regulations<br />
(norms) as well as for actions (measures).<br />
Social norms aim at regulating situations, while<br />
measures are directly linked to situations.<br />
Measures can be permanent even if the goal<br />
has been achieved. Measures have a goal as<br />
part and define roles and tasks necessary to<br />
reach the goal.<br />
A scenario can be seen as a pre-defined course<br />
of situations, so measures can be attached<br />
to scenarios as well. The main scenarios and<br />
measure alternatives within <strong>risk</strong> <strong>management</strong><br />
are described in figure 6 below.<br />
Within <strong>risk</strong> <strong>management</strong> situations can<br />
be categorized broadly into general <strong>risk</strong> related<br />
situations and those situations, where<br />
predefined measures can be attached (action<br />
related situations).<br />
Figure 4: Risk <strong>management</strong> cycle (adapted from PLANALP)<br />
Recovery<br />
Recovery is the phase of restoring the affected<br />
area to its previous state, in terms of conditions<br />
of life, infrastructure, communication and<br />
social organisation. Activities related to recovery<br />
phase primarily involve rebuilding destroyed<br />
property, re-employment, and the repair of<br />
other essential infrastructure.<br />
Within each phase of <strong>risk</strong> <strong>management</strong> –<br />
and actually within almost each activity of <strong>risk</strong><br />
<strong>management</strong> – a process from <strong>risk</strong> screening<br />
to <strong>risk</strong> <strong>risk</strong> treatment is being carried out.<br />
Figure 6: Linking <strong>risk</strong> and emergency terms (A. CORSINI)<br />
on terms<br />
A situation describes the<br />
perceived part of reality which is<br />
the basis for action.<br />
Measure is the final (eventlike)<br />
plan, which is oriented<br />
specifically at providing solutions<br />
for one known problem situation.
10 Monitor II Floods and landslides<br />
Monitor II Floods and landslides 11<br />
Hazards – floods<br />
and landslides<br />
Hazard processes<br />
RISK related situations<br />
Security is a situation, which is the setting for <strong>risk</strong><br />
classified as acceptable.<br />
Danger is a situation which is the setting for an event<br />
which is classified as hazard.<br />
Threat is a situation, which is the setting for elements<br />
of the environment exposed to hazardous event.<br />
Risk situation is a situation of threat where <strong>risk</strong><br />
has been analysed and classified (quantified or at least<br />
qualified threat).<br />
Knowledge about hazardous processes,<br />
especially about their existence/identification<br />
and their mechanisms, is the starting point of<br />
any <strong>risk</strong> <strong>management</strong> consideration. The terms<br />
processes and events in that context are often<br />
used in a very heterogenous way.<br />
Hazard processes are part of events and<br />
define the mechanisms of how events develop.<br />
More specifically, they define HOW (type<br />
of transportation or transformation) WHAT is<br />
changed (in terms of location or some other<br />
quality). When talking about natural hazards<br />
the HOW usually defines the transport-mode<br />
and the WHAT defines what kind of material<br />
(“amount-of-matter”) is being transported.<br />
Process parts of an event can be related to<br />
each other causally in a multitude of ways,<br />
leading to different scenarios.<br />
An event has an intensity (also called:<br />
magnitude) and a spatial location, where its<br />
processes take place. The temporal location of<br />
an event is usually defined as frequency<br />
(of reoccurrence) and describes the<br />
probability of the event taking place within<br />
a certain period of time.<br />
Events are often causally dependend on other<br />
events, which are called triggers (or triggering<br />
events). Floods for example are usually caused<br />
by heavy rainfalls as extreme weather event.<br />
Figure 7: Definin hazard potential (S. KOLLARITS et al. 2007)<br />
According to the EU Floods directive a flood is<br />
defined as a temporary covering by water of<br />
land not normally covered by water.<br />
on terms<br />
Hazard potential is the quality of a<br />
hazardous event, which is<br />
generically-dependent-on the<br />
probability and the magnitude of<br />
the event.<br />
Thus if both the probability and the<br />
magnitude of the (hazardous) event<br />
can be defined the hazard potential<br />
can also be defined.<br />
Type of flooding Cause of flooding Effect of flooding Relevant parameters<br />
River flooding in • Intensive rainfall • Stagnant of flowing • Extent (according<br />
flood plains and/or snowmelt water outside of to probability)<br />
• Ice jam, clogging channel • Water depth<br />
• Collapse of dikes or<br />
• Water velocity<br />
other protective<br />
• Propagation<br />
structures<br />
of flood<br />
ACTION related situations<br />
Nominal situation, where no hazardous events<br />
are ongoing or impeding.<br />
Alert situation is a situation of higher awareness<br />
of possible hazardous development.<br />
Pre-alarm situation is a situation where dedicated<br />
observation on site becomes necessary.<br />
Alarm situation is a situation where emergency forces<br />
are called into readiness for action.<br />
Emergency is a situation, which is the setting for high<br />
immediate <strong>risk</strong>, so that urgent measures need to be<br />
taken in order to avoid damage. Emergency forces<br />
begin operation.<br />
Damage situation is a situation, which is setting for an<br />
impact, which is classified as damage.<br />
Disaster is a situation, where the degree of damages<br />
is above an acceptable level.<br />
Within the broad range of hazards, MONITOR<br />
II specifically deals with floods and landslides.<br />
Hazards – floods<br />
The number of major flood events has<br />
increased within the European Union over the<br />
last decade. By the implementation of the EU<br />
water framework directive and the EU flood<br />
directive there is the intention to improve<br />
the <strong>management</strong> of water resources and the<br />
security against floods and other hydrological<br />
threats by the implementation of river basin<br />
and flood <strong>risk</strong> <strong>management</strong> plans.<br />
Figure 8:<br />
Different types of floods<br />
according to “Handbook on<br />
good practices for flood mapping<br />
in Europe” (EXIMAP, 2007).<br />
Sea water flooding • Storm surge • Stagnant or flowing • Same as above<br />
• Tsunami<br />
water behind the<br />
• High tide<br />
shore line<br />
• Salinisation of<br />
agricultural land<br />
Mountain torrent • Cloud burst • Water and sediments • Same as above,<br />
activity or rapid • Lake outburst outside the channel • Sediment depostion<br />
run-off from hills • Slope instability on alluvial fan;<br />
in watershed<br />
erosion along<br />
• Debrits flow<br />
channel<br />
Flash floods in • Cloud burst • Water and sediments • Same as above<br />
Mediterranean<br />
outside the channel<br />
ephemeral water<br />
on alluvial fan<br />
courses<br />
• Erosion along channel<br />
Groundwater • High water level in • Stagnant water in • Extend (according<br />
flooding adjacent water bodies flood plain (long to probability)<br />
period of flooding) • Wate depth<br />
Lake flooding • Water level rise • Stagnant water • Same as above<br />
trough inflow or wind behind the<br />
induced set up shore line
12 Monitor II Floods and landslides<br />
Monitor II Floods and landslides 13<br />
Figure 9: The process structure of flooding events (I. SCHNETZER)<br />
This shall include floods from rivers, mountain<br />
torrents, Mediterranean ephemeral water<br />
courses, and floods from the sea in costal areas.<br />
Although floods can happen in different<br />
environments (large catchments in river plains,<br />
small watersheds in mountaineous terrain) the<br />
consequence of the process is the same. Large<br />
areas are covered by water and sediments.<br />
An inevitable prerequisite for an effective<br />
flood <strong>risk</strong> <strong>management</strong> is a sound analysis<br />
of the hazards and <strong>risk</strong>s in the river basin or<br />
smaller watershed under investigation.<br />
The prevailing type of flood must be defined,<br />
the probability of a particular flood event and<br />
the flood magnitude represended by flood<br />
extent, water depth or flow velocity, and finally<br />
the most likely magnitude of damage.<br />
According to the “Handbook on good<br />
practices for flood mapping in Europe”<br />
(EXIMAP, 2007), different types of floods can<br />
be distinguished based on their general<br />
characteristics, the causes of flooding, the<br />
effect of flooding and on the flood-relevant<br />
parameters.<br />
According to the European Flood Directive<br />
flood <strong>risk</strong> is defined as the combination of the<br />
probability of a flood event and of the<br />
potential adverse consequences for human<br />
health, the environment, cultural heritage and<br />
economic activity associated with a flood event<br />
(DIRECTIVE 2007/60/).<br />
Flood hazard maps must contain information<br />
on flooding processes, at least for three given<br />
different scenarios of a low, medium and<br />
high probability of occurrence of the flooding.<br />
For each scenario the flood extent, the<br />
water depths or water levels, and where<br />
appropriate the flow velocities have to be<br />
presented in the maps.<br />
Due to the fact that flooding processes can<br />
develop in a complex and often unpredictable<br />
way leading to different impact and damage<br />
scenarios which therefore must be considered<br />
within contingency planning procedure, a<br />
thourogh analysis and evaluation of the hazard<br />
process itself, and of the influence of structures<br />
or protective measures must be peformed.<br />
From the point of view of the process structure<br />
of flooding in larger river basins, but also in<br />
smaller, alpine catchment areas, and their<br />
consequences for contingency planning, the<br />
following major elements can be defined (see<br />
figure 9 below). Torrential rainfall or steady<br />
rainfall events in the upper catchment leads<br />
to surface flow and river inflow depending<br />
the retention capacity of vegetation canopee,<br />
soil properties and material properties of<br />
bedrock and sedimentary cover. At certain<br />
locations, which can be modelled based on<br />
high-resolution topographic data (combination<br />
of Airborne Laserscanner Data with data from<br />
Echo sounding), the riverbed is too small to<br />
contain the water masses, or the river passage<br />
is blocked by objects or logs and a riverbed<br />
break out or overflow is happening, leading<br />
to a dynamic flooding of the flood plain itself.<br />
Surface erosion and static flooding<br />
(inundation) is caused leading to damage<br />
scenarios. Depending on the magnitude of<br />
the flooding process, after quite some time,<br />
the initial state is reached by evaporation of<br />
the water column, groundwater backflow<br />
and riverbed backflow. Prevention measures<br />
installed in the catchment area, but also failure<br />
scenarios of these protective structures can<br />
have an influence on the time and magnitude<br />
dimension of flooding events.<br />
Picture 2: Landslide of Valloria, Emilia-Romagna<br />
Hazards – landslides<br />
The term landslide, as defined by Cruden<br />
(1991) for the Working Party on World<br />
landslides, denotes “the movement of a mass<br />
of rock, debris or earth down a slope”. More<br />
generally defined a landslide encompasses<br />
a wide variety of processes that result in the<br />
downward and outward movement of<br />
slope-forming materials including rock, soil,<br />
artificial fill, or a combination of these.<br />
The materials may move by falling, toppling,<br />
sliding, spreading, or flowing. Landslides can<br />
be initiated by rainfall, earthquakes, volcanic<br />
activity, changes in groundwater, disturbance<br />
and change of a slope by man-made<br />
construc tion activities, or any combination<br />
of these factors. Extreme weather conditions<br />
prevailing in the European mountain<br />
chains can lead to combined processes like<br />
rapidly evolving flooding events and rainfall<br />
triggered landslides of different types (sides,<br />
debris flows...) inflicting severe damage in the<br />
downstream areas.<br />
on terms<br />
A landslide is the movement<br />
of a mass of rock, debris or earth<br />
down a slope.<br />
Failure of a slope occurs when the force that is<br />
pulling the slope downward (gravity) exceeds<br />
the strength of the earth materials that compose<br />
the slope. They can move slowly (creeping)<br />
or can move quickly and disastrously, as<br />
is the case with debris-flows. Debris-flows can<br />
travel down a hillside with speeds up to 200<br />
miles per hour (more commonly, 30 - 50 miles<br />
per hour), depending on the slope angle, water<br />
content, and type of earth and debris in the<br />
flow. These flows are initiated by heavy, usually<br />
sustained, periods of rainfall, but sometimes<br />
can happen as a result of short bursts of<br />
concentrated rainfall in susceptible areas.<br />
The very frequent presence of different<br />
types of creeping processes or landslide<br />
remnants in mountainous or even hilly areas in<br />
itself does not form a threat to human activity.<br />
Only when landslides occur unexpectedly and<br />
very rapid or when old landslides are reactivated<br />
they develop their “hazard characteristics”.<br />
The prediction of new active landslide<br />
or of the reactivation of older landslides is a<br />
difficult task to tackle and requires a sound<br />
analysis of past events and the application of<br />
modern investigation methods (e.g. engineering<br />
geophysics; terrestrial or airborne Laser<br />
measurements; Synthetic Aperture Radar).
14 Monitor II Floods and landslides<br />
Monitor II Floods and landslides 15<br />
Type of MovEMENT<br />
Bedrock<br />
Generally speaking a lot of different mass<br />
movements are termed “landslide”, but they<br />
can be differentiated based on the type of<br />
movement, the type of material, morphology<br />
and the rate of movement.<br />
Detailed classifications were elaborated<br />
by Varnes (1978) or within the EU funded<br />
EPOCH project (EPOCH, 1993) and by the<br />
US Geological Survey.<br />
Type of Material<br />
Engineering Soils<br />
Predominantly Coarse<br />
Falls Rock fall Debris fall Earth fall<br />
Topples Rock topple Debris slide Earth slide<br />
Slides Rotational Rock slide Debris slide Earth slide<br />
Translational<br />
Predominantly Fine<br />
Landslide – sliding (rotational slide<br />
and translational slide)<br />
More restrictively used the term landslide or<br />
slide should be used only for mass movements<br />
along a recognizable shear surface (zone of<br />
weakness separating the sliding material from<br />
the more stable underlying material). Two major<br />
types of slides can be distinguished<br />
– rotational slides and translational slides.<br />
Rotational slide<br />
Translational slide<br />
Landslide – fall and topple<br />
Falls are abrupt movements of masses of<br />
geologic materials, such as rocks and boulders,<br />
which become detached from steep slopes or<br />
cliffs USGS, Dickau et al. 1996). Separation<br />
occurs along discontinuities such as fractures,<br />
joints, and bedding planes and movement<br />
occurs by free-fall, bouncing, and rolling. Falls<br />
are strongly influenced by gravity, mechanical<br />
weathering, and the presence of interstitial<br />
water.<br />
Toppling failures are distinguished by the<br />
forward rotation of a unit or units about some<br />
pivotal point, below or low in the unit, under<br />
the actions of gravity and forces exerted by<br />
adjacent units or by fluids in cracks.<br />
Landslide – flows<br />
Lateral Spreads Rock spread Debris spread Earth spread<br />
Flows Rock flow Debris flow Earth flow<br />
Complex<br />
(deep creep)<br />
(soil creep)<br />
Combination oft two or more principal types of movement<br />
Figure 10: Generalisation of slope movement types according to VARNES (1978).<br />
Transverse cracks<br />
Transverse ridge<br />
Minor scarp<br />
Crown<br />
Crown cracks<br />
A rotational slide is a slide in which the<br />
surface of the rupture is curved concavely<br />
upward and the slide movement is roughly<br />
rotational about an axis that is parallel to the<br />
ground surface and transverse across the slide<br />
(circular or spoon-shaped shear surface).<br />
In the case of a translational slide the landslide<br />
mass moves along a roughly planar surface<br />
with little rotation or backward tilting. A block<br />
slide is a special type of a translational slide<br />
where a single rock unit or a few closely<br />
related rock units move down slope as a<br />
relatively coherent mass.<br />
Block slide<br />
Surface rupture<br />
Figure 11: Different types of sliding processes (courtesy USGS).<br />
There are different basic categories of<br />
flows that differ from one to another. A debris<br />
flow is a form of rapid mass movement in<br />
which a combination of loose soil, rock,<br />
organic matter, air, and water mobilize as slurry<br />
that flow down slope usually in surges induced<br />
by gravity and the sudden collapse of bank<br />
material. Debris flows include variable amounts<br />
of water and less than 50% fines. Debris<br />
flows are commonly caused by intense surfacewater<br />
flow, due to heavy precipitation or<br />
rapid snowmelt, which erodes and mobilizes<br />
loose soil or rock on steep slopes. Debris flows<br />
Radial cracks<br />
Main scarp<br />
Head<br />
Fall<br />
Topple<br />
Toe<br />
Foot<br />
Surface of rupture<br />
Main body<br />
Toe of surface of rupture<br />
Surface of separation<br />
Figure: An idealized slump-earth flow showing commonly used nomenclature for labelling<br />
the parts of a landslide (courtesy USGS).<br />
Figure 12: Landslides – fall and topple (courtesy USGS).
16 Monitor II Floods and landslides<br />
Monitor II Hazard maps 17<br />
Debris flow<br />
Source area<br />
Main track<br />
Depostional area<br />
Figure 13: Landslides – flows (courtesy USGS).<br />
Creep<br />
Earth flow<br />
Debris avalanche<br />
Lateral spread<br />
also commonly mobilize from other types of<br />
landslides that occur on steep slopes, are nearly<br />
saturated, and consist of a large proportion<br />
of silt- and sand-sized material. Debris-flow<br />
source areas are often associated with steep<br />
gullies, and debris-flow deposits are usually<br />
indicated by the presence of debris fans at<br />
the mouths of gullies. A debris avalanche is a<br />
variety of very rapid to extremely rapid debris<br />
flow. Earthflows have a characteristic<br />
”hourglass” shape. The slope material liquefies<br />
and runs out, forming a bowl or depression<br />
at the head. The flow itself is elongate and<br />
usually occurs in fine-grained materials or<br />
clay-bearing rocks on moderate slopes and<br />
under saturated conditions. A mudflow is an<br />
earthflow consisting of material that is wet<br />
enough to flow rapidly and that contains at<br />
least 50 percent sand-, silt-, and clay-sized<br />
particles.<br />
Landslide – creep, lateral spread<br />
Creep is the imperceptibly slow, steady, downward<br />
movement of slope-forming soil or rock.<br />
Movement is caused by shear stress sufficient<br />
to produce permanent deformation, but too<br />
small to produce shear failure. Creep<br />
is indicated by curved tree trunks, bent fences<br />
or retaining walls, tilted poles or fences, and<br />
small soil ripples or ridges. Lateral spreads are<br />
distinctive because they usually occur on very<br />
gentle slopes or flat terrain. The dominant<br />
mode of movement is lateral extension<br />
accompanied by shear or tensile fractures.<br />
The failure is caused by liquefaction, the<br />
process whereby saturated, loose, cohesion less<br />
sediments (usually sands and silts) are<br />
transformed from a solid into a liquefied state.<br />
The tools: state-of-the-art<br />
A major goal of the MONITOR II project is to contribute to the definition of a harmonised<br />
methodology for hazard mapping and contingency planning within the EU-member states, based<br />
on the experiences of the organisations participating in MONITOR II. Based on the state-of-the-art<br />
analysis and evaluation of hazard mapping and contingency planning practices prevailing in the<br />
participating countries and organisations, recommendations for improvement, harmonisation and<br />
adaptation of existing hazard maps and contingency plans were worked out.<br />
Be informed – hazard maps<br />
The process of hazard assessment<br />
Starting point of hazard assessment is a<br />
situation of threat, for which hazard assessment<br />
is a recommended (or in some cases:<br />
a legally prescribed) measure. The goal of<br />
hazard assessment is to define hazard potential<br />
(qualitative as well as quantitative).<br />
Activities in hazard assessment execution<br />
are carried out according to methods (rules,<br />
guidelines, practice…). These methods can be<br />
seen as a knowledge source for successfully<br />
reaching the goal defined for a plan. Subplans<br />
of hazard assessment are hazard inventory,<br />
hazard analysis and hazard evaluation with<br />
each having a related goal.<br />
Hazard maps can generally be described as<br />
a major output of hazard assessment and<br />
constitute a decisive element in <strong>risk</strong> <strong>management</strong>.<br />
They assist the identification, evaluation<br />
and reduction of <strong>risk</strong> by using an optimal<br />
combination of measures. In a general<br />
definition the term hazard map encompasses<br />
both the map proper and all the expertise.<br />
Hazard assessment thus covers hazard<br />
inventory AND hazard analysis AND hazard<br />
evaluation.<br />
Hazard inventory: Is the identification and<br />
description of existing and potential hazards<br />
and the general conditions (physical –<br />
meteorological - ....) that determine them.<br />
Tilted pole<br />
Soil ripples<br />
Bedrock<br />
Firm clay<br />
Hazard analysis: Is the (qualitative, semiqualitative<br />
or quantitative) description of<br />
the probability of the event and its spatiotemporal<br />
location and magnitude (intensity).<br />
This involves measurement of parameters and<br />
estimation (by modeling approaches) and interpretation<br />
of data.<br />
Curved tree trunks<br />
Fence out of alignment<br />
Figure 14: Landslides – creep and lateral spread (courtesy USGS).<br />
Soft clay with water-bearing<br />
silt and sand layers<br />
Figure 15: Hazard assessment and related goals (S. KOLLARITS et al. 2007)<br />
Within hazard analysis one (or more) likely<br />
scenarios of hazard process development are<br />
being considered. They serve as the central<br />
input to hazard evaluation.
18 Monitor II Hazard maps<br />
Monitor II Hazard maps 19<br />
Figure 16: Hazard assessment procedure (S. KOLLARITS et al. 2007)<br />
Hazard evaluation: Hazard evaluation is the<br />
ranking and description of hazards in the area<br />
of interest, based on the findings of inventory<br />
and analysis phases. It is based on pre-defined<br />
criteria, which classify parameters of the (most)<br />
likely scenarios of process development. This<br />
is usually done on the basis of classifying both<br />
dimensions of hazard potential, the frequency<br />
and the intensity.<br />
In the course of hazard evaluation the consequences<br />
of defined scenarios are evaluated,<br />
considering their (potentially) damaging impact.<br />
Finally one ore more scenarios are choosen as<br />
reference scenarios, which together provide the<br />
basis of evaluation (esp. hazard zonation) and<br />
thus for further action to be taken.<br />
Hazard zonation: Is the delineation of areas<br />
which are possibly inflicted by hazard processes.<br />
The zonation is usually the (minimum)<br />
output of hazard evaluation. The zonation<br />
takes into account the possible damages,<br />
which are dependent on the intensity of the<br />
possible processes and standard assumptions<br />
on vulnerability of the elements at <strong>risk</strong>.<br />
Concerning the methods of hazard assessment<br />
available technical codes (which in some<br />
cases have normative caracter) have to be<br />
distinguished from the scientific state-of- theart.<br />
Quite often detailed normative codes are<br />
not available but the “legitimated” experts are<br />
required to assess hazards based on the<br />
state-of-the-art.<br />
The outputs of hazard assessment (description<br />
of the conditions, scenarios and parameters,<br />
hazard zones) can be directly used in follow-up<br />
planning processes.<br />
It is used both for prevention related planning<br />
(land-use planning, protection measures) and<br />
for preparation related planning (contingency<br />
planning), but with different requirements on<br />
level of detail of information. Land-use planning<br />
usually pays regard only to hazard zonation<br />
whereas contingency planning needs more<br />
detailed (scenario based) information, in order<br />
to define sufficient countermeasures. Even<br />
more detailed information about the scenarios<br />
and their included process assumptions<br />
(dimensions of the process: time – intensity<br />
– frequency) is needed for the planning and<br />
design of technical protective measures.<br />
Issues of Hazard and Risk mapping<br />
Hazard and <strong>risk</strong> maps have the goal to<br />
represent a criteria-based evaluation of the<br />
data, information and results obtained form<br />
inventory and analysis phases. They are,<br />
generally, “pseudo-static” documents updated<br />
with an interval of 1 – 10 years (or even longer).<br />
In the public sector they are produced for<br />
land-use planning purposes and are not intended<br />
for contingency planning. They are thus<br />
intended as <strong>risk</strong> reduction tools, reducing future<br />
exposure to <strong>risk</strong> of buildings and populations<br />
and also supporting planning and prioritization<br />
of technical and non technical measures.<br />
Land-use planning requires maps to be used<br />
and interpreted by non experts and that can<br />
incorporate a dose of political-decisional<br />
subjectivity. For this reason a classes-based<br />
approach is fully justified, resulting in zonation<br />
maps which are more qualititative (pseudoquantitative)<br />
than quantitative. These maps are<br />
thus not able to represent the full information<br />
details of the hazard assessment procedure.<br />
The full detail is usually available only as<br />
“ official expertise”, but this needs expert<br />
knowledge for interpretation.<br />
In the private sector, for instance real estate<br />
insurance, the scope of hazard and <strong>risk</strong> maps<br />
is completely different, as they are tools to<br />
calculate probabilities of economic loss for<br />
the company. For this reason <strong>risk</strong> maps for<br />
the insurance sector need a truly quantitative<br />
scaling, in order to allow this calculation.<br />
Project Partners of MONITOR II are public<br />
institutions and the hazard maps they have<br />
developed are aimed at land-use planning<br />
and – as above mentioned – they have to be<br />
considered pseudo-quantitative. The analysis of<br />
practice among project partners has highlighted<br />
a number of common points between these<br />
maps and the methods used to combine <strong>risk</strong><br />
variables:<br />
• Frequency of hazard processes is<br />
defined in classes by using return periods<br />
that are assessed on a statistical or<br />
expert-opinion basis.<br />
• Intensity of hazard processes is defined<br />
in classes that are determined on the basis<br />
of ranges of values of measurable physical<br />
variables.<br />
• Hazard potential of hazard processes is<br />
derived by a heuristic matrix-based combination<br />
of frequency and intensity classes.<br />
• Vulnerability of elements at <strong>risk</strong> is<br />
usually only defined on the basis of the<br />
function of structures, mainly buildings<br />
(with some regard to their sociopolitic-strategic<br />
importance). There is no<br />
“true” information on actual vulnerability<br />
of single structures concerning hazardous<br />
events. This means that the capacity of<br />
structures to resist the impact of an event<br />
is not taken into account.<br />
But vulnerability should not be restricted<br />
to the “resistance capacity” point of view,<br />
but must include the dimensions of<br />
“ anticipation capacity”, “coping capacity”<br />
and recovery capacity as well.<br />
These matters are not even touched by<br />
now in <strong>risk</strong> assessment procedures.<br />
• Value of exposed elements is usually not<br />
defined seperatly, as it is already somehow<br />
incorporated in the utilised notion of<br />
vulnerability (“function of structures”).<br />
The practice of vulnerability definition<br />
thus shows clear shortcomings and should<br />
be replaced by a transparent procedure for<br />
defining damage potentiall, which is<br />
calculated on the basis of vulnerability and<br />
value of elements at <strong>risk</strong>.<br />
The general similarities described above<br />
contrast with great differences in details of<br />
approaches, which are summarised below.<br />
Return period and frequency<br />
on terms<br />
A return period is a statistically<br />
defined recurrence interval<br />
between hazard events of the same<br />
type and intensity.
20 Monitor II Hazard maps<br />
Monitor II Hazard maps 21<br />
The theoretical return period is the inverse<br />
of the probability that a defined intensity of<br />
an event will be exceeded in any one year.<br />
For example, a 100-year flood has a 1%<br />
(1/100=0.01) chance of being exceeded in any<br />
one year and will on average occur once every<br />
100 years.<br />
As regards flood return period, it should<br />
be noticed that there are significant differences<br />
in the adopted boundaries. They reflect<br />
differences in national-regional legislations,<br />
spatial planning and design codes of protective<br />
structures.<br />
Hazard potential<br />
Hazard potential is derived by a heuristic<br />
matrix-based combination of return-period and<br />
intensity classes. This non-analytical approach<br />
results in non-unified hazard classifications<br />
among countries. For example in hazard assessment<br />
for floods Austria distinguishes only high<br />
and low hazard while Italy knows four hazard<br />
classes. It should also be noticed that there are<br />
discrepancies among countries regarding the<br />
colour assigned to a specific hazard class when<br />
used in hazard maps.<br />
FREQUENCY CLASS AUSTRIA SLOVENIA AUSTRIA ITALY ITALY<br />
Intensity<br />
Slovenia (PP4) Italy (PP5) Austria (PP1)<br />
Vulnerability<br />
Figure 17: Examples of frequency classes for floods based on the return period<br />
Figure 19: Examples of intensity classes for floods<br />
(PP1) (PP4) (Hora maps) (PP5) (PP7)<br />
High 1.5 m >1,5 m2/s >= 1,5 m >= 0,5 m >2 m<br />
Medium 0.5 - 1.5m 0.5 - 1,5 m2/s < 1,5 m < 0,25 m 0.5-2 m<br />
Low 11) &<br />
(=
22 Monitor II Hazard maps<br />
Monitor II Contingency plans 23<br />
Risk<br />
Risk assessment of hazard processes is derived,<br />
by a heuristic matrix-based combination of<br />
hazard potential and vulnerability classes.<br />
Again, a differentiation exists between matrices<br />
used by different countries. This means that in<br />
all steps of <strong>risk</strong> assessment different countries<br />
use different approaches, different ranges of<br />
classes and after all also different colours to<br />
highlight the respective classes.<br />
Since the hazardous processes do not pay<br />
regard to national or other administrative<br />
borders a better international communication<br />
and understanding regarding hazard and <strong>risk</strong><br />
assessment would be most welcome. In order<br />
to harmonise <strong>risk</strong> classification a common<br />
european standard (guideline) would thus be<br />
desirable.<br />
ITaly (PP 5)<br />
Hazard Potential Class<br />
Risk<br />
Class<br />
Very High Medium Low Residual<br />
VERY HIGH<br />
Vulnerability Class<br />
LOW MEDIUM HIGH<br />
Very High<br />
<strong>risk</strong><br />
Very High<br />
<strong>risk</strong><br />
High<br />
<strong>risk</strong><br />
Medium<br />
<strong>risk</strong><br />
Very High<br />
<strong>risk</strong><br />
High<br />
<strong>risk</strong><br />
Medium<br />
<strong>risk</strong><br />
Moderate<br />
<strong>risk</strong><br />
Medium<br />
<strong>risk</strong><br />
Medium<br />
<strong>risk</strong><br />
Moderate<br />
<strong>risk</strong><br />
Moderate<br />
<strong>risk</strong><br />
Slovenia (PP 4)<br />
Hazard Potential Class<br />
Risk<br />
Class<br />
High Medium Low Residual<br />
Vulnerability Class<br />
LOW MEDIUM HIGH<br />
VERY LOW<br />
High<br />
<strong>risk</strong><br />
High<br />
<strong>risk</strong><br />
High<br />
<strong>risk</strong><br />
Medium<br />
<strong>risk</strong><br />
High<br />
<strong>risk</strong><br />
High<br />
<strong>risk</strong><br />
Medium<br />
<strong>risk</strong><br />
Low<br />
<strong>risk</strong><br />
Medium<br />
<strong>risk</strong><br />
Medium<br />
<strong>risk</strong><br />
Low<br />
<strong>risk</strong><br />
Low<br />
<strong>risk</strong><br />
Figure 23: Examples of <strong>risk</strong> assessment classifications<br />
Low<br />
<strong>risk</strong><br />
Low<br />
<strong>risk</strong><br />
Low<br />
<strong>risk</strong><br />
Low<br />
<strong>risk</strong><br />
As stated above vulnerability classes in this<br />
context should rather be defined as classes<br />
of damage potential (which includes both<br />
vulnerability and value).<br />
Hazard mapping isssues<br />
There is a number of open issues regarding<br />
hazard and <strong>risk</strong> maps that are worthwhile<br />
being pinpointed with respect to two different<br />
perspectives, the harmonization of documents<br />
at a European level and the usability of Hazard<br />
and Risk maps for contingency planning and<br />
<strong>management</strong>.<br />
• Being Hazard generally defined by a<br />
combination of Return Period and<br />
Intensity parameters, should these<br />
parameters be ranked in descriptive<br />
“qualitative” or “pseudo-quantitative”<br />
classes (as in landuse planning practice<br />
among PP), or should they rather be ranked<br />
on a continous “quantitative” 0 to 1 basis<br />
(as in insurance practice)<br />
• Is it preferable to define Hazard levels<br />
combining Intensity and Return Period<br />
classes or values by using an heuristic<br />
“matrix-based” approach – so to include<br />
some “political” decisions – or by using<br />
an objective “math-based“ combination<br />
approach<br />
• If descriptive “qualitative” or “pseudoquantitative”<br />
classes for Intensity and<br />
Return Period ranking are to be used,<br />
is standardization of classes possible<br />
and desirable<br />
• Should Vulnerability of elements at <strong>risk</strong><br />
be ranked in descriptive “qualitative” or<br />
“pseudo-quantitative” classes based on its<br />
“strategic” or “social” worth (as in landuse<br />
planning practice among PP), or should it<br />
rather be ranked on a continous “<br />
quantitative” 0 to 1 basis considering it’s<br />
constructional characteristics with respect<br />
to the occurring hazard (as in insurance<br />
practice)<br />
• If descriptive “qualitative” or “pseudoquantitative”<br />
classes for ranking Vulnerability<br />
are to be used, is standardization of<br />
classes possible and desirable<br />
• Is it preferable to define the “Risk level”<br />
of an area by combination of Hazard and<br />
Vulnerability classes or values using a<br />
heuristic “matrix-based” - so to include<br />
some “political” decisions - or to define<br />
it on the basis of an objective “mathbased“<br />
combination of these parameters<br />
• Could a “standard” of codes and<br />
colours for type of hazard process and<br />
Hazard-Risk levels favour<br />
Be prepared –<br />
contingency plans<br />
Contingency plans are important instruments<br />
within <strong>risk</strong> <strong>management</strong>. The aim of<br />
contingency plans is to reduce the number of<br />
disasters and to reduce the number of casualties<br />
and other negative consequences of<br />
such disasters.<br />
Contingency plans usually have to be defined<br />
if threats have been identified at a certain<br />
administrative level. Contingency plans include<br />
specific strategies and measures (and related<br />
tasks) to deal with specific defined situations.<br />
They also include definition of <strong>monitor</strong>ing<br />
processes and “triggers” for initiating these<br />
planned tasks.<br />
The major goal of contingency planning is to<br />
provide decision makers in intervention with<br />
a clearly structured guideline of actions to be<br />
taken in case of extreme events (i.e. those<br />
events which are not covered by routine protective<br />
procedures). Contingency planning thus<br />
covers the phase of action after the begin of<br />
an extreme event until the standard operation<br />
procedures (SOPs) of emergency can take over.<br />
As part of contingency planning SOPs can be<br />
an essential supporting element by improving<br />
the quality and speed of decision making in<br />
disaster <strong>management</strong>.<br />
Contingency plans are prepared in the<br />
preparedness phase of <strong>risk</strong> <strong>management</strong> and<br />
can be categorised as planning activities.<br />
on terms<br />
A contingency plan is a plan to<br />
secure protection, rescue and relief<br />
in case of disasters or disaster<br />
forecast situations.<br />
Standard operating procedures<br />
are a formalised structure to handle<br />
specific operational activities of<br />
emergency.
24 Monitor II Contingency plans<br />
Monitor II Contingency plans 25<br />
Contingency plans define necessary activities<br />
within disaster preparation phase.<br />
• Warning includes notifying and warning<br />
the population in the event of disasters.<br />
• Human resource <strong>management</strong> includes<br />
organising, equipping and training<br />
protection, rescue and relief forces as well<br />
as training the population for personal and<br />
collective protection.<br />
• Provision of materials resources<br />
includes provision of stocks of protective<br />
and rescue equipment as well as<br />
humanitarian aid equipment.<br />
Contingency plans for use in intervention<br />
phase define protection, rescue and relief<br />
measures in case of a particular disaster event.<br />
They are elaborated on the basis of the previous<br />
hazard assessment and <strong>risk</strong> assessment. They<br />
define the competent authorities and tasks to<br />
assure protection, rescue and relief.<br />
• Protection includes organisational,<br />
technical and other measures as well as<br />
the use of technical and other means for<br />
immediate personal and collective<br />
protection of people, animals, property,<br />
cultural heritage and environment against<br />
consequences of natural and other<br />
disasters.<br />
• Rescue includes measures and procedures<br />
for rescuing people the life or health of<br />
which is at <strong>risk</strong>, rescuing animals, property<br />
and cultural heritage from consequences of<br />
natural and other disasters.<br />
• Relief includes measures and services of<br />
specialists, rescue units and services, use of<br />
protection and rescue equipment and<br />
means of relief.<br />
They are enforced in response phase, starting<br />
with warning stage and including intervention<br />
measures. Their power ceases when standard<br />
operational procedures (SOP) of the intervention<br />
forces can take place and activities of<br />
recovery phase start.<br />
The development of contingency plans has to<br />
be based on clearly defined event scenarios,<br />
which are the outcome of hazard assessment.<br />
The effectivity of measures defined in contingency<br />
plans strongly depends on the quality<br />
of the scenarios considered (i.e. on the level of<br />
detail of scenario definition and how realistic<br />
they are defined).<br />
For contingency planning the scenarios<br />
considered are transformed into a series of<br />
action relevant situations. These situation<br />
definitions both include a description of the<br />
likely event (and: the parameters how it can<br />
be identified) and the intervention resources<br />
available, but also the social (legal) conditions<br />
of action.<br />
The measures defined in contingency plans<br />
relate to the situations of warning (prealert,<br />
alert and alarm) and disaster. For these<br />
situations contingency plans define<br />
• what are the characteristics of these<br />
situations (parameters like water gauge<br />
levels, number of available staff ressources)<br />
• how can these situations be identified,<br />
e.g. by means of <strong>monitor</strong>ing systems<br />
• how and to whom shall these situations<br />
be communicated<br />
• which measures shall be taken to counter<br />
the situation<br />
The contents of contingency plans<br />
usually include<br />
• general scope of the plan<br />
• description of the administrative structure<br />
and responsibilities<br />
• ressources and roles<br />
• hazards within the area concerned<br />
• elements at <strong>risk</strong> and vulnerability<br />
• scenario-specific situations and measures<br />
(usually repeated for each relevant scenario):<br />
· <strong>monitor</strong>ing<br />
· communication<br />
· protection, rescue and relief<br />
· evaluation and documentation<br />
Despite this high level of importance within<br />
disaster <strong>management</strong>, contingency planning<br />
still shows a surprisingly high heterogeneity<br />
when comparing different European countries.<br />
This heterogeneity can be shown by comparing<br />
the legal basis and the specific issue of<br />
<strong>monitor</strong>ing and warning.<br />
The legal and administrative<br />
framework<br />
The European Commission is responsible<br />
for supporting and supplementing efforts at<br />
national, regional and local level with regard<br />
to disaster prevention, the preparedness of<br />
those responsible for civil protection and the<br />
intervention in the event of disaster.<br />
The legislative framework for European<br />
civil protection enabled the Commission to<br />
establish a framework for effective and rapid<br />
co-operation between national civil protection<br />
services when mutual assistance is needed:<br />
• Civil protection financial instrument<br />
(adopted on 5 March 2007<br />
(2007/162/EC, Euratom)<br />
• Community civil protection mechanism<br />
(adopted on 8 November 2007<br />
(2007/779/EC, Euratom)<br />
The Community Civil Protection Mechanism<br />
and the Civil Protection Financial Instrument<br />
together cover three of the main aspects of<br />
the disaster <strong>management</strong> cycle – prevention,<br />
preparedness and response. The Mechanism<br />
itself covers response and some preparedness<br />
actions, whereas the Financial Instrument<br />
enables actions in all three fields. The two<br />
pieces of legislation are moreover complementary<br />
as the Financial Instrument finances the<br />
Mechanism.<br />
This European framework is integrated into<br />
national and regional legislation. The resulting<br />
competences are located at different<br />
administrative. This can be shown with the<br />
Austrian example.<br />
The implementation of the objectives of civil<br />
protection in Austria is effected mainly on the<br />
following two levels:<br />
Since May 2003 the Austrian Federal<br />
Ministry of the Interior (MOI) is responsible<br />
for the coordination in matters of disaster<br />
<strong>management</strong> on state level (SKKM), including<br />
international disasters and disasters involving<br />
more than one federal state. As a central<br />
contact point, the federal warning and alarm<br />
center (BWZ) and the emergency coordination<br />
center (EKC) were established at the Federal<br />
Ministry of the Interior (MOI). In case of<br />
prolonged and complex crisis and disaster<br />
situations the task of SKKM (National Crisis<br />
and Disaster Management) is to ensure the<br />
rapid coordination of the federal authorities<br />
and the coordination and cooperation with<br />
those countries.<br />
Disaster relief of the 9 Federal Provinces is<br />
responsible for measures to avert, remove<br />
or alleviate the effects of imminent or past<br />
disasters (disaster relief, action planning) on a<br />
regional level. The legal basis is provided by the<br />
catastrophe aid acts of the Federal Provinces,<br />
which are not harmonised and do show<br />
marked differences. They define particularly<br />
the establishment of the disaster and the<br />
operational responsibility by the authority on<br />
community, district and provincial level.<br />
Depending on the extent of a disaster the<br />
implementation of intervention measures rests<br />
with the authority level, as described in the<br />
figure below.<br />
Multi and bilateral treaty<br />
National Crisis and Emergency<br />
Management (SKKM)<br />
Civil Defense and Disaster<br />
Protection Management of the<br />
Federal States<br />
Disaster Protection<br />
Management of the Districts<br />
Disaster Protection Management<br />
of the Municipalities<br />
National<br />
Provinicial<br />
Regional<br />
Local<br />
Figure 24: Competence levels of disaster <strong>management</strong><br />
organisation in Austria<br />
Federal Ministry<br />
of the Interior<br />
Provincial<br />
Government<br />
District<br />
Administration<br />
Municipal<br />
administration
26 Monitor II Contingency plans<br />
Monitor II Contingency plans 27<br />
Contingency planning issues<br />
Monitoring and warning<br />
Hazard type<br />
Concerning contingency planning, all partner<br />
countries of MONITOR II have legally defined<br />
responsibilities, but usually no guidelines are<br />
available. Contingency planning is generally<br />
done on a case by case basis, thus resulting<br />
contingency plans – if available at all – are not<br />
comparable and not standardised.<br />
Specific progress has been made in South Tyrol,<br />
where guidelines for contingency planning are<br />
already available and communities have started<br />
implementation on this basis.<br />
In Slovenia a guideline (Rules on the<br />
Elaboration of Threat Assessments for Natural<br />
and Other Disasters), which should become<br />
obligatory by law, is currently in preparation.<br />
Protection and rescue measures to be deployed<br />
in the event of a natural or other disaster are<br />
laid down in the protection and rescue plans<br />
(contingency plans). They must be defined for<br />
each individual type of hazard by state bodies,<br />
local communities, public institutions (e.g.<br />
schools, institutions caring for special groups<br />
of people, medical institutions), commercial<br />
companies whose activities in case of accidents<br />
present a threat to nearby residents and to<br />
the environment, and a number of other<br />
organisations.<br />
Level of planning<br />
Company Local Regional National<br />
Accident on sea ■ ■ ■<br />
Earthquake ■ ■ ■<br />
Flood ■ ■ ■<br />
Heavy snow ■ ■<br />
Forest fire ■ ■ ■<br />
Nuclear accident ■ ■ ■ ■<br />
Terrorist attack ■ ■<br />
Accidents involving hazardous substances ■ ■ ■<br />
Air crashes ■ ■ ■ ■<br />
Railway accidents ■ ■ ■ ■<br />
Accidents in a tunnel ■ ■<br />
Landslides or Avalanches ■ ■<br />
Contingency planning is confronted with quite<br />
a large number of issues, some of which are<br />
related to the non-existence of trans-national<br />
standards. For this reason<br />
• Contingency plans are often not available<br />
in a harmonised form (if available at all).<br />
• Contingency plans are usually not available<br />
in a structured digital form, thus links to<br />
GIS or hazard maps are not possible.<br />
• Contingency plans are being prepared on<br />
different levels of competences, different<br />
hazard types, different organisations – and<br />
all this is not harmonised, and more often<br />
than not, not integrated into common<br />
work-flows.<br />
• Contingency plans need update in the<br />
event of any change relating to hazards<br />
or the availability of protection, rescue and<br />
relief forces but also taking into account<br />
new findings and experience gained in<br />
disaster <strong>management</strong>. Standardised<br />
procedures for this important task (which<br />
determines the quality and thus usability of<br />
contingency plans) are not available.<br />
• How can residual <strong>risk</strong> be dealt with in<br />
contingency plans<br />
• How can the public be integrated in a <strong>risk</strong><br />
dialogue, particularly in terms of how to<br />
treat residual <strong>risk</strong>s – this should assure that<br />
all opportunities to manage and minimize<br />
residual <strong>risk</strong>s are taken (e.g. property<br />
protection measures, emergency planning<br />
and insurance ...).<br />
• How to avoid or at least minimise <strong>risk</strong><br />
aversion Examples have shown that<br />
people tend to ignore (avert) <strong>risk</strong>,<br />
especially if “it has never happened before”<br />
(which means: in my remembrance), but<br />
even in case of previous disaster events the<br />
rate of ignorance is high.<br />
Situation<br />
Nominal situation<br />
Alert situation<br />
Pre-alarm situation<br />
Alarm situation<br />
Emergency situation<br />
Slovenia<br />
H1 (Q1) –<br />
elevated water stage<br />
H2 (Q2) – continuous<br />
<strong>monitor</strong>ing of ongoing situation<br />
H3 (Q3) –<br />
state of readiness for action<br />
information<br />
detailed information<br />
notifying<br />
regular <strong>monitor</strong>ing<br />
on hazard area only<br />
preparedness<br />
H4 (Q4) – taking action alerting on-site intervention begins<br />
H5 (Q5) –<br />
catastrophic flooding<br />
Austria Lower Austria<br />
Warning level<br />
Critical water level<br />
Alarm level<br />
Italy (Provice South Tyrol)<br />
alarming<br />
(e.g. 50 cm beneath<br />
the alarm level)<br />
(e.g. 30 cm beneath<br />
the alarm level)<br />
(water level at<br />
first flooding)<br />
relief, rescue, protection<br />
notifying<br />
alerting<br />
alarming<br />
zero level information regular <strong>monitor</strong>ing<br />
alfa notifying on hazard area only<br />
bravo alerting, public awareness preparedness (centrale die piena)<br />
charly alerting on-site intervention begins<br />
procedura di allertamento per<br />
eventi meteo estremi<br />
Description<br />
Use of standard <strong>monitor</strong>ing systems (e.g. gauging station, weather forecasts).<br />
Higher awareness of possible hazardous development.<br />
Intensify use of standard <strong>monitor</strong>ing systems.<br />
Start dedicated observation on site. Stand-by for emergency duties (24 x 7).<br />
Emergency services are called into readiness for action.<br />
Start action and measure implementation.<br />
Can be subdivided into different phases of escalation.<br />
Figure 26: Typical situations during warning and related escalation procedures<br />
alarming<br />
relief, rescue, protection<br />
Warning is based on <strong>monitor</strong>ing information<br />
and on the complementary use of forecast<br />
for projecting <strong>monitor</strong>ed information into the<br />
(near) future. Both <strong>monitor</strong>ing and forecasting<br />
are important for all types of hazards<br />
and are directly used in the implementation<br />
of contingency plans. This mutual influence<br />
between <strong>monitor</strong>ing and action can be shown<br />
in figures 26 and 27.<br />
For the purpose of <strong>monitor</strong>ing and early<br />
warning many countries have set up national<br />
warning centres, with regional subsidiaries.<br />
In Italy the national system of the “Centri<br />
Funzionali”, which has been promoted by the<br />
National Civil Protection department and by<br />
the regions, provides a network of <strong>monitor</strong>ing<br />
and warning centers for the national “Altering<br />
system”, distributed within the territory. The<br />
operational centre should preview, <strong>monitor</strong> and<br />
control in real-time events and their effects on<br />
the territory. It also provides decision support<br />
to the authorities for the different emergency<br />
<strong>management</strong> phases. The directive of the<br />
president of the Council of Ministries of 27th<br />
February 2004 regulates tasks and operational<br />
functions of these centres.<br />
Standards concerning the reaction to<br />
<strong>monitor</strong>ing information show significant<br />
differences between countries (warning levels<br />
and related action).<br />
on terms<br />
Monitoring is the process-like<br />
method of checking, observing and<br />
tracking processes in a defined area,<br />
with the purpose of evaluating<br />
system threshold values.<br />
Foreceast denotes methods to<br />
estimate or calculate in advance,<br />
especially to predict future conditions<br />
by analysis of available data.<br />
Figure 25: Types of hazard and the related level of planning (Slovenia)<br />
Figure 27: Comparison of different definitions of warning phases and related parameters
28 Monitor II Scenarios<br />
Monitor II Scenarios 29<br />
In Austria, the federal states and the<br />
municipalities are responsible for flood warning.<br />
Measurements are performed by the<br />
hydrographic service, which are associated<br />
with the Provincial Warning and Alarm Centers<br />
(LWZ). For each <strong>monitor</strong>ing station three gauge<br />
levels are defined. In case of an imminent<br />
flood event the Provincial Warning and Alarm<br />
Centre (LWZ) is informed auto matically by<br />
the <strong>monitor</strong>ing systems. After checking the<br />
correctness of the values, the LWZ initiates the<br />
necessary steps and informs the population<br />
through the warning and alarm system.<br />
Connecting<br />
the tools:<br />
scenarios<br />
The missing link:<br />
scenarios<br />
Basis questions about hazard Processes<br />
WHAT CAN HAPPEN<br />
WHERE CAN IT HAPPEN<br />
HOW OFTEN CAN IT HAPPEN<br />
HOW FAST WILL IT HAPPEN<br />
HOW SUDDENLY WILL IT HAPPEN<br />
ARE PROTECTION MEASURES INSTALLED<br />
AND ARE KEY THEY FUNCTIONALITY<br />
Information required<br />
Standardized process description including<br />
simplified scenario models.<br />
Standardized description of source, transport<br />
and impact area of the process.<br />
Description of the expected frequency<br />
(recurrence interval) of an event<br />
Standardized description of process<br />
development in time scale<br />
Standardized description of process initiation<br />
in time scale<br />
Standardized description of protection measures<br />
and functionality including information on<br />
protection, failure conditions and residual <strong>risk</strong>.<br />
In Slovenia the <strong>monitor</strong>ing and flood forecasting<br />
is provided by the Environmental<br />
Agency of the Republic of Slovenia (ACRSPDR).<br />
The forecasting system was established for<br />
main rivers of Slovenia, with the thresholds for<br />
one day forecast. On the basis of the r ealtime<br />
<strong>monitor</strong>ing results (discharges, levels)<br />
and forecast the ACRSPDR activates the civil<br />
protection forces on the designated areas.<br />
Information on water levels, river flow and<br />
water temperature is sent to the notification<br />
centre every 30 minutes. Plan contains intervention<br />
values with five levels of flood hazard<br />
for cross-sections of watercourses.<br />
Hazard maps indicate for defined return<br />
periods of the considered design events<br />
(e.g. 100-years flooding event), the spatial<br />
distribution of areas which are possibly inflicted<br />
by natural hazard processes of a certain<br />
intensity. Based on the assessment of possible<br />
damages and given standard assumptions<br />
on the vulnerability of elements at <strong>risk</strong>, a <strong>risk</strong><br />
zonation is done. During hazard assessment<br />
a very detailed standard procedure based on<br />
technical codes and regulations is followed up<br />
by the hazard mapping experts, leading to the<br />
definition of probable scenarios for the design<br />
events and to the delineation of related hazard<br />
zones. Although high quality information is<br />
available during hazard assessment procedure<br />
itself, this information on hazard processes,<br />
process development and possible event<br />
scenarios is generally summarized in reports<br />
hardly readable by contingency planners and<br />
“condensed” in more or less simple hazard<br />
maps. During this process of this somehow<br />
necessary “simplification” of complex processes<br />
and process interactions, key information,<br />
required by contingency planners might end up<br />
being hidden or lost.<br />
EXPECTED IMPACT OF HAZARD EVENT<br />
AND AREA AFFECTED<br />
IS IT POSSIBLE TO FORECAST EVENT’S INITIATION<br />
AND EVOLUTION<br />
IS IT POSSIBLE TO OBSERVE OR MONITOR<br />
EVENT’S INITIATION AND EVOLUTION<br />
IS IT POSSIBLE TO OBSERVE/ MONITOR KEY<br />
PROTECTION STRUCTURES AND OBSTACLES<br />
POSSIBLE<br />
IS IT POSSIBLE TO UNDERTAKE ANY<br />
INTERVENTION BEFORE AND/OR DURING FULL<br />
PROCESS DEVELOPMENT<br />
Description of key impact parameters like flow<br />
velocity or impact energy, and of area affected.<br />
Standardized description of possible triggers and<br />
process activation. Definition of warning stages.<br />
Definition of observation points and<br />
of standard operation procedure.<br />
Description of key protection structures,<br />
their function and of failure conditions.<br />
Description of obstacles. Standard operation<br />
procedures for observation.<br />
Definition of intervention points and<br />
appropriate measures to be defined in standard<br />
operation procedures.<br />
Figure 28: Basic information about hazard processes required by contingency planners<br />
A more “process oriented approach” of<br />
contingency planning requires as input from<br />
advanced hazard mapping, answers to very<br />
basic questions about the development of<br />
hazard processes and about required actions<br />
and measures to be taken (see Tab. 1).<br />
In order to fulfill these requirements, reference<br />
scenarios must be defined and included in<br />
the hazard maps and in tools like a “hazard<br />
manager” in Continuous Situation Awareness<br />
(CSA) systems to act as a link between hazard<br />
mapping and contingency planning procedure.<br />
Reference scenarios should be structured<br />
according to simplified scenario models<br />
i.e. as a standardized description of a course<br />
of future hazard events and of their impacts,<br />
based on a consistent and plausible set of<br />
assumptions about future conditions. Within<br />
contingency planning, scenario models can be<br />
used to describe reference scenarios both in<br />
preparedness phase and response phase.<br />
Reference Event Scenarios refer exclusively<br />
to the evolution in space and time of the<br />
hazardous process. Reference Risk Scenarios<br />
(divided into Damage Scenarios and Loss Scenarios)<br />
refer to the evolution in space and time<br />
of the reference event and of its effects, also<br />
considering eventual mitigation or response<br />
actions.<br />
Figure 29: Simplified scenario models as a link between hazard<br />
mapping and contingency planning (I. SCHNETZER).
30 Monitor II Scenarios<br />
Monitor II Scenarios 31<br />
PREPAREDNESS<br />
Reference<br />
scenario(s)<br />
HAZARD MAPPING<br />
identify hazards<br />
Threat<br />
assess hazards<br />
Hazard<br />
potential<br />
Critical<br />
Points<br />
defines location<br />
of measures<br />
defines (parameters<br />
for <strong>monitor</strong>ing)<br />
Critical point<br />
and typeof action<br />
(intervention,<br />
observation<br />
generalised-as<br />
generalised-as<br />
Nominal<br />
parameters<br />
Alert<br />
parameters<br />
Pre-alarm<br />
parameters<br />
Alarm<br />
parameters<br />
Alarm<br />
parameters<br />
COMMUNICATION<br />
GENERAL OVERVIEW, SCOPE, ADMINISTRATION AND RESPONSIBILITIES<br />
Threatened<br />
areas<br />
GENERAL INFORMATION (OF TERRITORY), RESSOURCES AND ROLES<br />
RISK: HAZARDS, ELEMENTS AT RISK AND RISK ASSESSMENT<br />
Hazard<br />
(zone) maps<br />
+ basic<br />
parameters<br />
SCENARIO-SPECIFIC SITUATIONS AND MEASURES<br />
depends-on<br />
depends-on<br />
depends-on<br />
Nominal<br />
situation<br />
Alert<br />
Pre-alarm<br />
ANNEXES: TERMS, MATERIALS, TOOLS, CHECKLISTS<br />
Figure 30: Interfacing hazard mapping and contingency planning (S. KOLLARITS)<br />
CONTINGENCY PLANNING<br />
Damage<br />
potential<br />
evaluation<br />
Measures<br />
Measures<br />
Measures<br />
depends-on Alarm Measures<br />
depends-on Disaster Measures<br />
start contingency planning<br />
assess vulnerability/<strong>risk</strong><br />
Risk<br />
define (hazard-specific)<br />
contingency plans<br />
<strong>monitor</strong>, observe<br />
notify intensify<br />
observation<br />
escalate notifications<br />
prepare for alarm<br />
rescue and relief<br />
Damage<br />
documentation and<br />
evaluation<br />
In Prevention, several predicted reference<br />
scenarios (considering hazard or <strong>risk</strong>) can be<br />
defined, each characterized by a different<br />
temporal probability of occurrence. In Warning,<br />
one or few more expected scenarios can<br />
be identified for a short- to mid-term time<br />
window in the future, on the basis of the<br />
ongoing or forecasted evolution of triggering<br />
causes and of the hazardous phenomenon.<br />
In intervention, one ongoing scenario is<br />
appraised, and it might change rapidly<br />
following changing boundary conditions.<br />
Synthesis of information flow between hazard<br />
mapping and contingency planning in<br />
preparedness phase:<br />
Due to the fact that classical hazard/<strong>risk</strong><br />
zonation is based on very rough standard<br />
assumptions of the vulnerability of elements<br />
at <strong>risk</strong> and possible damages, not evaluating<br />
all parameters for every object (exposure,<br />
resistance, and vulnerability and regeneration<br />
capacity) or critical infrastructure directly,<br />
contingency planners must be involved in<br />
the evaluation of damage and loss scenarios.<br />
They also have to consider damage and<br />
loss scenarios of critical infrastructures that<br />
play a crucial role during the intervention in<br />
a response phase (e.g bridges, firefighters<br />
buildings, hospitals etc.).<br />
Simplified scenarios models (used for<br />
“event” or “damage”/”loss” scenarios) should<br />
comprise the following key elements:<br />
• Definition/Description of possible –<br />
eventually multiple – “reference” scenarios<br />
(mainly process oriented).<br />
• Evaluation of the efficiency of existing<br />
countermeasures (“protected” or “failure”<br />
scenario”).<br />
• Definition of forecasting, observation, alert<br />
and intervention options.<br />
• Indication of the main elements and key<br />
situations regarding processes and<br />
countermeasures/interventions (using<br />
“critical”, “observation”, and “intervention”<br />
points - see below).<br />
• Comparison of the expected effects of<br />
these situations for endangered objects<br />
(i.e. damage and loss scenarios)<br />
(i.e. “basic”, “protected“ and – as worst<br />
case - a “total failure-of-countermeasures”<br />
scenarios)<br />
Hazards are not equal<br />
Considering the required communication<br />
and interaction between hazard experts and<br />
contingency planners it is useful to distinguish<br />
between two types of hazards. In contingency<br />
planning most emergency scenarios are<br />
generally categorized as those resulting from<br />
“sudden-onset” or “stepwise-onset” hazards.<br />
Any process that is developing in a time span<br />
shorter than the intervention time required<br />
must be considered to be “sudden” from the<br />
point of view of contingency planning or crisis<br />
<strong>management</strong>.<br />
• STEPWISE ONSET HAZARDS:<br />
Stepwise-onset hazards are those whose<br />
effects take a long time to produce<br />
emergency conditions (for instance, natural<br />
hazards, such as big river flooding or<br />
long-term drought, that over a long time<br />
may contribute to severe food scarcity<br />
conditions, malnutrition and eventually<br />
famine conditions).<br />
• SUDDEN-ONSET HAZARDS:<br />
Sudden-onset hazards include both natural<br />
hazards (e.g. earthquakes, hurricanes, flash<br />
floods in smaller catchments) and<br />
man-made or “complex” hazards (e.g.<br />
sudden conflict situations arising from<br />
varied political factors).<br />
Bringing this concept to the “process<br />
domain” of natural hazards the following<br />
characterization of the two hazard types<br />
can be given:<br />
Slowly and regularly evolving<br />
regular events (slow stepwise-onset<br />
hazards)<br />
This natural hazard type is characterized by<br />
the fact that on the one hand historic information<br />
and “forecasting” information (gauges,<br />
meteorological network, established threshold<br />
values) is available leading to longer forewarning<br />
times and to well established warning<br />
and alert stages in the hazard <strong>management</strong><br />
cycle. On the other hand the evolution of the<br />
scenario/event is following a regular sequence<br />
of process development stages which are<br />
quite well known on the basis of the historic<br />
knowledge on similar events, and that can be<br />
foreseen and predicted based on validated<br />
models and real time <strong>monitor</strong>ing data.<br />
WARNING<br />
Attention, alert > Pre-alarm > Alarm > Impact<br />
Process development longer than reaction time required<br />
by crisis <strong>management</strong> = SLOW<br />
Figure 31: Warning and impact in the case<br />
of a slowly evolving regular event (slow-onset hazards)<br />
From a more general point of view these<br />
regular events like e.g. flooding scenarios in<br />
larger catchment areas are characterized by<br />
a more “frozen” situation with only a few<br />
changing variables.<br />
Rapidly and irregularly evolving<br />
events (sudden-onset hazards)<br />
This hazard type is characterized by a dynamic/<br />
composite evolution of event scenario and<br />
by a limited reaction time. Especially smaller<br />
catchment areas in the Alps very frequently are<br />
inflicted by rapidly evolving irregular events.<br />
Extreme meteorological conditions causing<br />
torrential rains within a very short time span<br />
in a local watershed can trigger different<br />
processes like landslides, rockslides, rock fall,<br />
debris flows and flash-flooding leading to<br />
complex multihazard scenario combinations.<br />
Additionally existing technical prevention<br />
measures like e.g. retention dams have to be<br />
considered with respect to their operational<br />
and failure conditions (mitigation/prevention<br />
failed). Even in the case of existing fore warning<br />
systems installed in these small catchment<br />
areas, the warning time is very short. After<br />
attention/alert a pre-alarm or a very short alarm<br />
phase is following directly before the impact.<br />
WARNING<br />
Attention, alert ><br />
Pre-alarm or<br />
very short alarm<br />
Process development longer than reaction time required<br />
by crisis <strong>management</strong> = SLOW<br />
Figure 32: Warning and impact in the case<br />
of a fast evolving irregular event (sudden-onset hazards)<br />
> Impact
32 Monitor II Scenarios<br />
Monitor II Scenarios 33<br />
ROCK (fall, topple, spread, slide) – STEPWISE ONSET AND SUDDEN ONSET<br />
Cause and triggers Weathering Erosion Induction by shock<br />
(e.g. earthquakes)<br />
Definition of hot spots in the<br />
process and intervention domain<br />
SCENARIO DESCRIPTION<br />
FLOW -– FLOODING (Stepwise onset) e.g. river flooding in flood plains<br />
Cause and triggers Intensive rainfall and/or<br />
snowmelt<br />
Ice jam or clogging, lake<br />
outbursts<br />
Collapse of dykes<br />
or other protective<br />
structures<br />
Process type Clear water discharge Suspended load/ bed load transport<br />
Relevant parameters Water depth Water velocity Extent of<br />
flooded area<br />
Forecasting/<br />
<strong>monitor</strong>ing options<br />
Expected time<br />
to impact<br />
“Hot spots” in the<br />
process domain<br />
Weather forecast<br />
With forecasting<br />
Critical points<br />
(e.g. natural dam)<br />
Without<br />
forecasting<br />
Rain fall, water depth<br />
at gauging stations<br />
Considering<br />
existing protection<br />
measures<br />
Observation points<br />
(e.g. gauging stations)<br />
FLOW – FLOODING (sudden onset) e.g. mountain torrents<br />
Cause and triggers Cloud burst Ice jam or clogging, lake<br />
outbursts, landslides<br />
Process type Clear water discharge Suspended load/ bed<br />
load transport<br />
Flood<br />
propagation<br />
Linkage of defined<br />
threshold values with<br />
expected flood extend<br />
Considering<br />
the failure of<br />
protection<br />
measures<br />
Intervention points<br />
(e.g. weirs to be opened<br />
to use natural retention<br />
capacity in flood plains)<br />
Collapse of natural<br />
dams (e.g. landslide<br />
dams) or protective<br />
structures<br />
Debris flow<br />
Relevant parameters Volume Depth Velocity Sediment load<br />
Forecasting/<br />
<strong>monitor</strong>ing options<br />
Expected time<br />
to impact<br />
“Hot spots” in the<br />
process domain<br />
Weather forecast<br />
With forecasting<br />
Critical points<br />
(e.g. reactivated<br />
landslide)<br />
Without<br />
forecasting<br />
Rain fall and duration,<br />
water depth at gauging<br />
stations<br />
Observation points<br />
(e.g. water level<br />
at bridges)<br />
Considering<br />
existing protection<br />
measures<br />
Water depth, bed,<br />
bank and slope erosion<br />
at defined observation<br />
stations.<br />
Considering<br />
the failure of<br />
protection<br />
measures<br />
Intervention points<br />
(e.g. clogged gorge<br />
or bridge)<br />
Figure 33: Scenario description and necessary parameters for flow/flooding events (stepwise and sudden onset).<br />
Due to the more complex nature of this<br />
hazard type more information on the scenario,<br />
relevant for contingency planning, must<br />
directly be indicated in the hazard maps.<br />
Scenario description<br />
To make hazard maps more useful for<br />
contingency planners during preparedness<br />
and response phase additionally to the<br />
delineation of zones indicated in hazard maps,<br />
the course of events and event scenarios must<br />
be described in short texts in a condensed,<br />
standardized and formalized manner using<br />
pre-defined ontology rules and syntax. When<br />
using hazard maps in analogue form this<br />
required process information can be printed<br />
directly on the hazard maps. If a map is thereby<br />
“ overloaded”, the text information can be<br />
included is a separate manual. In the case of<br />
the availability of hazard maps in a digital form<br />
or of a Continuous Situation Awareness (CSA)<br />
tool, the required process information can be<br />
made available to the contingency planners by<br />
clicking on simple map symbols opening “popup<br />
windows” (e.g. “hot spots” like infor mation<br />
points, critical points, and observation and<br />
intervention points – see below) . Additionally<br />
to the description of the course of events and<br />
of event scenarios, situations and identification<br />
parameters (e.g. threshold values etc.)<br />
must be indicated in the scenario description.<br />
Thereby contingency planners must be enabled<br />
to decide which scenario/situation is actually<br />
evolving and links to alternative scenarios (or<br />
sub-scenarios) can be activated interactively.<br />
Besides the information indicated in hazard<br />
maps and the event scenario information<br />
given in a separate manual, additionally short<br />
guidelines, using a clear ontology must be<br />
worked out and provided to contingency<br />
planners. In these guidelines simple and short<br />
descriptions of basic process parameters have<br />
to be given also referring to process model<br />
examples. E.g. What is a debris flow How<br />
can a landslide be triggered What is clogging<br />
(“Verklausung”)<br />
Depending on the process type (e.g. flow/<br />
flooding; rock fall; landslide) and event development<br />
different information must be included<br />
in the scenario description.<br />
Process type Fall Topple Spread Slide<br />
Relevant parameters Block size Volume Bounce height Impact force<br />
Forecasting/<br />
<strong>monitor</strong>ing options<br />
Expected time<br />
to impact<br />
“Hot spots” in the<br />
process domain<br />
Extensometers measuring<br />
opening of fissures<br />
With forecasting<br />
Critical points<br />
(source area)<br />
Without<br />
forecasting<br />
Remote sensing methods<br />
measuring displacement<br />
Considering<br />
existing protection<br />
measures<br />
Observation points<br />
(measurement/ <strong>monitor</strong>ing<br />
of displacement)<br />
LANDSLIDE (sliding, creeping, flowing) – STEPWISE ONSET AND SUDDEN ONSET<br />
Cause and triggers<br />
Process type<br />
Sediment<br />
composition<br />
Translational<br />
sliding<br />
Existing<br />
sliding plane<br />
Hydrostatic pressure<br />
and moisture<br />
Manual measurements of<br />
displacement<br />
Figure 34: Scenario description and necessary parameters for rock movement and landslide events<br />
(stepwise and sudden onset).<br />
Considering<br />
failure of protection<br />
measures<br />
Intervention points<br />
(removal of unstable<br />
parts; permanent and<br />
mobile protection<br />
measures)<br />
Slope<br />
Rotational sliding Flowing Creeping<br />
Relevant parameters Activation Volume Depth Speed Run out<br />
length<br />
Forecasting/<br />
<strong>monitor</strong>ing options<br />
Expected time<br />
to impact<br />
“Hot spots” in the<br />
process domain<br />
Weather<br />
forecast and<br />
measurement of<br />
precipitation<br />
Below<br />
reaction time<br />
(=FAST)<br />
Above<br />
reaction time<br />
(=SLOW)<br />
Critical points<br />
(source area)<br />
Sensors<br />
measuring<br />
displacement<br />
and moisture<br />
With<br />
forecasting<br />
Without<br />
forecasting<br />
Remote Sensing<br />
methods to<br />
measure<br />
displacement<br />
Observation points<br />
(measurement/<strong>monitor</strong>ing<br />
of displacement)<br />
Considering<br />
existing<br />
protection<br />
measures<br />
Impact<br />
force<br />
Manual<br />
measurements<br />
of displacement<br />
Considering<br />
failure of<br />
protection<br />
measures<br />
Intervention points<br />
(drainage of sliding mass;<br />
lowering of groundwater<br />
table by pumping wells,<br />
auger piles, anchor walls<br />
etc.)<br />
Within the co-operation of hazard experts<br />
and contingency planners “hot spots” can be<br />
defined in the process (p), damage/loss (d) and<br />
intervention (i) domains. These “hot spots” are<br />
indicators for information linking the hazard/<br />
process- and the contingency/intervention<br />
fields by providing key process information or<br />
indications of required measures. These “hot<br />
spots” comprise of information points, critical<br />
points, observation points and intervention<br />
points.<br />
THE PROCESS ORIENTED DOMAIN:<br />
Process oriented information point<br />
(p-INFO): Using prcess-oriented information<br />
points general information on the hazard<br />
process/ event scenario is given. Depending on<br />
the event scenarios the main information<br />
is provided in a condensed form based on a<br />
clear ontology (see above).<br />
Process oriented critical point (p-CP):<br />
A process oriented critical point is defined by<br />
the hazard mapping expert based on historic<br />
information and a sound hazard assessment<br />
procedure and is related to the process<br />
development itself. This point can indicate<br />
the area where a process is starting (e.g. the<br />
detachment zone of a landslide or rock fall),<br />
where a process is transformed (e.g. sediment<br />
input from the river flanks leading to debris<br />
flow), or diverted (e.g. clogged bride) in<br />
different directions – possibly leading to subscenarios.<br />
Process oriented observation point<br />
(p-OP): At a process-oriented observation<br />
point indicates a location where the process<br />
can best/most significantly be observed or<br />
<strong>monitor</strong>ed. An observation point can e.g.<br />
indicate the location of a sensor installed in the<br />
preparedness phase to <strong>monitor</strong> a process. In<br />
the warning phase additional technical devices<br />
may be installed or “observers” may be sent<br />
to the defined locations to observe the process<br />
development according to a pre-defined<br />
Standard Operation Procedure (SOP).<br />
Process oriented intervention point (p-IP):<br />
Process oriented intervention points used<br />
during the preparedness phase indicate all<br />
technical and non-technical prevention measures<br />
installed. During the warning phase, at a<br />
process oriented intervention point an action<br />
may be taken, directly influencing the process<br />
or event development itself. In the case
34 Monitor II Scenarios<br />
Monitor II Scenarios 35<br />
of a flooding in a lager river (slow-onset),<br />
typical intervention points are e.g. retention<br />
basins with manual or automatic steering of the<br />
weir, structures to divert the flood into natural<br />
retention areas, or locations where river blockage<br />
may occur and must be averted (clogging,<br />
blockage by side erosion or landslides). In<br />
mountain torrents (fast-onset) these process<br />
oriented intervention measures are mainly<br />
depending on the given warning time. Possible<br />
measures at intervention points are e.g. the removal<br />
of clogging, the opening or widening of<br />
discharge channels after riverbed blockage by<br />
sliding and bank erosion or the rapid construction<br />
of reflection or retention dams.<br />
Reactivated Landslide – Block Model<br />
According to the definition of “hot spots”<br />
in the process domain, they can also be<br />
defined in the “damage/loss” and “intervention”<br />
domain by contingency planners. E.g. a<br />
“damage-oriented” critical point is defining<br />
a location where the damage is likely to take<br />
place.. An “intervention oriented” critical point<br />
is indicating a location where something must<br />
be done to reduce <strong>risk</strong>.<br />
PROCESS<br />
ORIENTED<br />
DOMAIN<br />
DAMAGE/<br />
LOSS<br />
ORIENTED<br />
DOMAIN<br />
INTER-<br />
VENTION<br />
ORIENTED<br />
DOMAIN<br />
information point p_INFO d_INFO i_INFO<br />
critical point p_CP d_CP i_CP<br />
observation point p_OP d_OP i_OP<br />
intervention point p_IP d_IP i_IP<br />
1 week 3 days 1 day<br />
1 week 3 days 1 day<br />
Deposition Transport Source<br />
Reactivated Landslide – Scenario Model<br />
Scenario<br />
model<br />
Ontology<br />
IP<br />
Obstruction<br />
OP, IN<br />
Source<br />
CP, OP<br />
Diversion<br />
CP,OP, IN<br />
Impact IN<br />
Impact IN<br />
Scenario A:<br />
Detachment of small volume<br />
(< 30.000 m³)<br />
Scenario B:<br />
Detachment of large volume<br />
(> 30.000 m³)<br />
Scenario B1:<br />
Large volume and splitting<br />
of sliding path<br />
Scenario B2:<br />
Damming of river by deposition<br />
Combined Scenario B1/B2:<br />
Large volume and splitting<br />
of sliding path. Damming<br />
of river by deposition.<br />
”Hot spots”<br />
IP Information point<br />
CP Critical point<br />
OP Observation point<br />
INIntervention point<br />
Advantages of scenario use<br />
The invention of simplified scenario models<br />
and “hot spot information” included in hazard<br />
maps (in addition to the zonation information)<br />
sustains the contingency planner in preparedness<br />
and intervention phase to gain a fast<br />
overview about principle process information in<br />
a standardized form and thus helps to improve<br />
process understanding.<br />
In addition to the static information as defined<br />
in standard hazard maps consulting hot spots<br />
he is informed about <strong>monitor</strong>ing process<br />
activitation and principle process development<br />
in the process area.<br />
Figure 35: The concept of scenario models and “hot spots” shown for a flooding event (I. SCHNETZER)<br />
Figure 36: The concept of scenario models and “hot spots” shown for<br />
a sliding event (D. LEBER, A. CORSINI).<br />
Scenario maps<br />
Based on the classical approach of hazard<br />
assessment and mapping and the concept of<br />
hazard scenarios, scenario maps can be worked<br />
out. These maps show different zones and are<br />
giving additional details on hazard processes<br />
and possible mitigation or inter vention<br />
strategies using the “hot spot” concept lined<br />
out above. Information points are used to<br />
provide general event details; critical points<br />
indicate important process-related information;<br />
observation points and intervention points are<br />
included to provide information on possible<br />
actions to be taken by contingency planning or<br />
crisis <strong>management</strong>.<br />
Classical hazard map delineating areas<br />
possible inflicted by natural hazards<br />
Advanced hazard map delineating<br />
areas possible inflicted by natural<br />
hazards with scenario<br />
C<br />
Scenario 1: Clogging<br />
Scenario 2: Flooding<br />
No senario<br />
information<br />
indicated<br />
A<br />
Scenario information<br />
indicated using<br />
”hot spots” concept.<br />
Information points<br />
Critical points<br />
Observation points<br />
Intervention points<br />
Finally delinated ”red zone” may be<br />
the result of different event scenarios<br />
Existing scenario<br />
information ”hidden”<br />
Scenario information for contingency<br />
planning porposes included<br />
Figure 37: Example for the improvement of the quality of hazard mapping information for contingency<br />
planning by the invention of simplified scenario-models in hazard maps (modified after I. SCHNETZER)<br />
D<br />
Scenario 1: Clogging<br />
B<br />
Area affected:<br />
K1 – water + sediment<br />
K2 – water<br />
Consulting critical points he is informed about<br />
important parameters in the source (initiation)<br />
area of the hazard processes or about changes<br />
of the process.<br />
By consulting observation points already in the<br />
phase of early warning he is enabled to take<br />
action at an early stage of process development,<br />
thus improving his anticipation capacity<br />
(= early warning capacities) and increasing the<br />
time between first action (intervention) and<br />
disaster.<br />
In classical disaster <strong>management</strong> intervention<br />
actions can start after damage happened.<br />
With the knowledge about process oriented<br />
intervention points, the process development<br />
can (at least in some cases) directly be<br />
influenced by process related intervention<br />
action, thus increasing the coping capacity and<br />
sometimes even preventing the hazard at all.
36 Monitor II Practical example<br />
Monitor II Practical example 37<br />
A synoptical example: flood at river Morava<br />
Basic geographical data<br />
The Morava river is a left-sided tributary of<br />
Danube river and is the border river between<br />
Austrian and Slovak Republic over a length<br />
of about 70 km. The catchment area exceeds<br />
25.000 km². Flooding at the Morava river<br />
typically occurs between March and May as<br />
a result of the snow melt in the mountainous<br />
part of the catchment area in Czech Republic.<br />
However, flood events with shorter duration<br />
also occur during summer and winter periods.<br />
An extensive system of flood protection<br />
dykes was constructed almost along the whole<br />
Slovak-Austrian river reach.<br />
Morava flood event 2006<br />
The extreme discharge situation in spring 2006<br />
was mainly caused by above-average snow<br />
packs being stored in the catchment area<br />
(150-200mm water equivalent). The water level<br />
of Morava river raised abruptly from March<br />
27th .and the water level reached a maximum<br />
from April 2nd to 4th with an occurrence<br />
probability of hundred years.<br />
On April 3rd, the flood protection dyke<br />
close to Jedenspeigen was over-topped and<br />
subsequently erased up to a length of 100 meters<br />
within a few hours. The fire brigades had to<br />
evacuate 400 inhabitants in Dürnkrut. Another<br />
dyke failure occurred few kilometers downstream,<br />
close to Mannersdorf on April 4th.<br />
All in all, about 890 individuals had to leave<br />
their homes and about 600 households<br />
were affected by the flood disaster. Private<br />
households and the Austrian railway track to<br />
Czech Republic heavily damaged between<br />
Angern and Dürnkrut, incurred the bigger part<br />
of the losses.<br />
The experiences of the flood event 2006<br />
showed major shortcomings with previously<br />
existing contingency plans, especially the lack<br />
of sufficient knowledge<br />
• on potential hazards deriving from<br />
dyke failure,<br />
• on the temporal aspects of the hazard<br />
scenarios and<br />
• on the details of feasible relief measures.<br />
As a reaction Lower Austria developed<br />
comprehensive and homogenous basis<br />
for flood emergency measures for the<br />
municipalities (co-financed by ERDF within<br />
project MONITOR), focussing on:<br />
• Definition of different hazard scenarios,<br />
including residual <strong>risk</strong> scenarios.<br />
• Identification of potentially affected areas,<br />
based on numeric modelling of dyke break<br />
and overtopping scenarios.<br />
• Classification of the potentially endangered<br />
buildings based on their use and degree<br />
of exposure; designing of evacuation zones.<br />
Collection of all relevant spatial data within<br />
the evacuation zones.<br />
• Actual situation classification of the dyke<br />
(geotechnical, design-elevation, logistic).<br />
• Development of possible defense measures<br />
at the flood protection system and of<br />
emergency measures in residential areas.<br />
1 Hazard<br />
assessment<br />
Evaluation of the<br />
hazard documentation<br />
and of geotechnical<br />
survey of the dykes<br />
Identification and<br />
definition of hazard<br />
scenarios.<br />
Definition of model<br />
parameters for dyke<br />
breaks (width of<br />
breach, temporal<br />
development).<br />
Modelling of 6 dyke<br />
break scenarios<br />
(HQ30 and HQ100)<br />
and 1 overload event<br />
(HQ300).<br />
Identification of<br />
critical scenarios.<br />
Summary as<br />
hazard maps.<br />
2 Risk assessment 3 Contingency<br />
Planning<br />
Comprehensive<br />
overview and classification<br />
of damage<br />
potential: persons,<br />
cultural and economic<br />
values.<br />
Definition of<br />
vulnerability (based on<br />
mobility of people,<br />
handling time, logistic<br />
framework conditions,<br />
situation on supply<br />
and disposal).<br />
Assessment of indirect<br />
damage potential<br />
by environmentally<br />
endangering<br />
substances.<br />
Information, communication<br />
Summary of hazard<br />
assessment, determination<br />
of<br />
warning and alert values<br />
for parameters, display<br />
the chain of information,<br />
register of contact data.<br />
Tasks and responsibilities<br />
of the authorities on<br />
regional, district and comunal<br />
level, of operators<br />
of protection systems<br />
and of the relief units<br />
Catalogue of<br />
measures: List of all<br />
emergency <strong>management</strong><br />
measures,<br />
temporally ordened into<br />
phases WARNING-ALERT-<br />
DISASTER-<br />
“ALL-CLEAR“.<br />
Description of<br />
measures, which are<br />
listed in the catalogue.<br />
Supporting plans:<br />
survey map, plan of measures,<br />
evacuation plans,<br />
data sheets<br />
and tables<br />
4 Implementation<br />
Contingency plan<br />
comes into force.<br />
Introduction of<br />
contingency plan to<br />
emergency forces<br />
(fire brigades) and<br />
training courses.<br />
Training with technical<br />
experts of authorities.<br />
Joint disaster control<br />
exercise.<br />
Periodic activities<br />
for the update and<br />
maintenance of data.<br />
Figure 38: Workflow of hazard / <strong>risk</strong> mapping and in contingency planning in case of Morava river (A.<br />
SCHWINGSHANDEL)<br />
Best practice work-flow for flood<br />
related contingency planning<br />
The work-flow used for the comprehensive<br />
hazard assessment – including definition of<br />
critical scenarios, and the subsequent <strong>risk</strong><br />
assessment and contingency plan development<br />
can be regarded as a best practice example<br />
for flooding<br />
According to feasibility of measures and to the<br />
computed water depths in the flooded areas,<br />
different kinds of barriers for flood defense in<br />
residential areas were designed. Most crucial<br />
criteria for the application of measures is the<br />
fact that the fire brigades and other emergency<br />
<strong>management</strong> forces have to be able to build<br />
up these barriers within a short period. Stability<br />
and the safety of the construction in conjunction<br />
with the dimensions of the barriers were<br />
relevant planning criteria. The same is essential<br />
for defense measures at the flood protection<br />
dykes. Limited access to the dykes because<br />
of lack of drivable roads makes it difficult to<br />
defend them over the whole length<br />
The flood contingency plan was developed in<br />
close cooperation with the municipalities, the<br />
local and district fire brigades, the authorized<br />
person for civil protection of the district, the<br />
Austrian waterway company and the regional<br />
government of Lower Austria.
38 Monitor II Information needs<br />
Monitor II Information needs 39<br />
Information Needs<br />
Risk<br />
<strong>management</strong><br />
needs<br />
information<br />
Information needs<br />
and information<br />
generation<br />
Information collection is essential in all <strong>risk</strong><br />
<strong>management</strong> phases (Preparedness – Response<br />
– Recovery). Information collection produces<br />
supporting datasets that are used to meet<br />
Preparedness<br />
P) Prevention<br />
Planning–Technical<br />
measures<br />
(non-real-time<br />
information)<br />
InfoNeeds: to<br />
Assess – Define<br />
H) Hazard P.H.1) Hazard processes<br />
spatial distibution<br />
and extent<br />
P.H.2) Hazard processes<br />
long-term evolutiondynamic<br />
P.H.3) Triggering<br />
Conditions<br />
P.H.4) Predicted<br />
Event Scenarios<br />
P.H.5) Hazard<br />
Mitigation Alternatives<br />
V) Vulnerability P.V.1) Exposure<br />
P.V.2) Vulnerability<br />
P.V.3) Value or Worth<br />
P.V.4) Vulnerability<br />
and/or Cost-worth<br />
Reduction Alternatives<br />
R) Risk P.R.1) Predicted<br />
Damage Scenarios<br />
P.R.2) Predicted Loss<br />
Scenarios<br />
Main information<br />
flow direction<br />
During an Emergency<br />
Event<br />
Main information<br />
flow direction<br />
After an Emergency<br />
Event<br />
Update<br />
Figure 39: Information needs by disaster <strong>management</strong> phase (A. CORSINI)<br />
Response<br />
F) Warning<br />
Alert – Pre-Alaram<br />
– Alarm<br />
(real-time information)<br />
InfoNeeds: to<br />
Forecast – Identify<br />
F.H.1) Hazard processes<br />
on going evolutiondynamic<br />
F.H.2) Hazard processes<br />
expected evolutiondynamic<br />
F.H.3) Triggering<br />
causes situation<br />
F.H.4) Triggering<br />
causes expected trends<br />
F.H.5) Expected<br />
Event scenarios<br />
F.H.6) Urgent –<br />
Contingent hazard<br />
mitigation measures<br />
F.V.1) Urgent-<br />
Contingent<br />
Vulnerability and/or<br />
cost reduction<br />
measures<br />
F.R.1) Expected<br />
Damage Scenarios<br />
F.R.2) Expected Loss<br />
Scenarios<br />
Update<br />
R) Intervention<br />
Rescue –<br />
Damage miti gation<br />
(real-time information)<br />
InfoNeeds: to<br />
Appraise – Control<br />
R.H.1) Hazard processes<br />
on going evolutiondynamic<br />
R.H.2) Status-efficacy<br />
of ongoing hazard<br />
mitigation measures<br />
R.H.3) Ongoing<br />
Event scenarios<br />
R.V.1) Status-Efficacy<br />
of ongoing vulnerability<br />
and/or cost reduction<br />
measures<br />
R.R.1) Ongoing<br />
Damage Scenarios<br />
R.R.2) Ongoing<br />
Loss Scenarios<br />
Update<br />
information needs. Different information needs<br />
arise in different <strong>risk</strong> <strong>management</strong> tasks, such<br />
as, for instance, Prevention, Warning and<br />
Intervention.<br />
Definitions needed:<br />
ASSESS-DEFINE-FORECAST-IDENTIFY-<br />
APPRAISE-CONTROL<br />
Supporting datasets are the result of the<br />
combined application of different data<br />
collection methods. Observation methods<br />
generate basic supporting geographical data,<br />
archives of past events, outputs of hazrd<br />
processes surveys and mapping, results of<br />
<strong>monitor</strong>ing of hazard processes (non-real time /<br />
real time) and causes (non-real time / realtime);<br />
outputs of mapping elements at <strong>risk</strong>, databases<br />
of past damages; description and assessment<br />
of structural characteristics of elements at <strong>risk</strong>;<br />
damage potential curves, economic (value)<br />
assessments, strategic (worth/importance)<br />
assessments; output of heuristic expert-based<br />
models (to simulate hazard processes and their<br />
evolution/dynamics with respect to triggering<br />
conditions and –eventually- mitigation measures).<br />
Statistical or deterministic methods<br />
generate outputs of numerical models to<br />
simulate hazard processes and their evolution/<br />
dynamics with respect to triggering conditions<br />
and – eventually-mitigation measures,<br />
outputs of statistical models used to link<br />
hazard processes and their evolution/dynamics<br />
to triggering causes and to assess triggering<br />
conditions/thresholds.<br />
Figure 40: Risk and emergency basics with relevant data input (A. CORSINI)<br />
When one or more of the above mentioned<br />
methods are used to derive a dataset, representing<br />
expert knowledge, they can be called composite<br />
datasets. Typical examples of composite<br />
datasets are hazard and scenario maps.<br />
One key distinguishing characteristic of<br />
datasets is their update/availability timing.<br />
During prevention tasks, datasets update is<br />
needed only after a change in the territory<br />
has modified the conditions described by the<br />
dataset. Availability is mostly set to non-realtime,<br />
so that static (pseudo-static) data and<br />
informations are used. During warning tasks<br />
datasets update must take place in the shorter<br />
time possible, and data availability must be<br />
between near-real-time to real-time, so that<br />
dynamic informations can be derived.<br />
Onother key characteristic is the spatial dimension:<br />
datasets can be spatial (e.g. maps)<br />
or non-spatial (e.g. raw <strong>monitor</strong>ing data).<br />
Spatial data can be classified in different categories<br />
according to the INSPIRE directive of the<br />
European Union. However, such standards have<br />
no reference to the functional usage of data<br />
in <strong>risk</strong> <strong>management</strong>. To ensure that the spatial<br />
data infrastructures of the Member States are<br />
compatible and usable in a Community and<br />
transboundary context, the Directive requires<br />
that common implementing rules are adopted<br />
in a number of specific areas (meta data, data<br />
The INSPIRE directive of the EC<br />
requires the public authorities of<br />
member states to build and document<br />
GIS data according to specified<br />
implementation rules.<br />
INSPIRE conformity of GIS data<br />
assures the comparability of data<br />
on structural and semantical level.<br />
It thus allows to build GIS-based<br />
models and applications once, but<br />
re-use them in the other countries<br />
and regions of Euopean Union.<br />
specifications, network services, data and<br />
service sharing and <strong>monitor</strong>ing and reporting).<br />
These implementing rules are adopted<br />
as Commission Decisions or Regulations, and<br />
are binding in their entirety. The Commission<br />
is assisted in the process of adopting such<br />
rules by a regulatory committee composed<br />
of representatives of the Member States and<br />
chaired by a representative of the Commission<br />
(this is known as the Comitology procedure).<br />
An INSPIRE metadata editor has been made<br />
available through the INSPIRE Community<br />
Geoportal. The INSPIRE Metadata editor<br />
makes it possible to create INSPIRE compliant<br />
meta data and to download it as an xml file.<br />
The main metadata categories are: metadata<br />
on metadata; identification; classification;<br />
keywords; geographic; temporal; quality and<br />
validity; conformity; constraints; organization.<br />
Information flows<br />
Information flows are defined by the way<br />
in which datasets are used in a harmonised<br />
integrated manner in order to meet information<br />
needs. Information flows vary depending<br />
on the <strong>risk</strong> <strong>management</strong> task.<br />
The general framework linking <strong>risk</strong>-related<br />
terms (hazard-vulnerability-value-<strong>risk</strong>) to<br />
emergency-related terms (event-damage-loss<br />
scenarios) has been presented above). Based<br />
on these general schemes flowcharts for the<br />
information flows during prevention, warning<br />
and intervention phases can be defined. These<br />
flowcharts hold direct reference to the main<br />
information needs defined and are built upon<br />
the review of practices among MONITOR II<br />
project partners.
40 Monitor II Information needs<br />
Monitor II Information needs 41<br />
Figure 41: Information flows during prevention phase (A. CORSINI)<br />
ALTER/ALARM<br />
THRESHOLDS<br />
(TRIGGERING CAUSES)<br />
(FH4)<br />
MODELS FOR<br />
TRIGGERING<br />
REAL-TIME FORCAST<br />
CAUSES<br />
REACHED YES<br />
ALERT<br />
ALARM<br />
(CAUSES)<br />
EXPECTEC<br />
TRENDS<br />
REAL-TIME<br />
MONITORING<br />
CAUSES<br />
(FH3)<br />
TRIGGERING<br />
define<br />
CAUSES<br />
SITUATION<br />
SURVEY<br />
(FIELD & R.S.)<br />
(FH1) HAZARD<br />
REAL-TIME<br />
PROCESSES<br />
WHERE<br />
MONITORING<br />
ONGOING<br />
”present”<br />
HAZARD PROCESSES EVOLUTION/<br />
(zones)<br />
DYNAMICS<br />
(FH2) HAZARD<br />
PROCESSES<br />
WHERE<br />
NUMERICAL<br />
EXPECTED<br />
“potentialy”<br />
MODELS<br />
EVOLUTION/<br />
(zones)<br />
DYNAMICS<br />
HEURISTIC<br />
ALERT<br />
EXPERT-BASED<br />
REACHED YES<br />
ALARM<br />
MODELS<br />
ALTER/ALARM<br />
THRESHOLDS<br />
(HAZARD PROCESSES INTENSITY)<br />
(FH6)<br />
URGENT<br />
HAZARD<br />
MITIGATION<br />
MEASURES<br />
(FR6)<br />
EXPECTED<br />
(mitigated)<br />
EVENT Scenarios<br />
(FR1)<br />
EXPECTED<br />
(mitigated)<br />
DAMAGE Scenarios<br />
WHEN<br />
(now)<br />
MAP<br />
MAP<br />
HOW<br />
(Intensity)<br />
combine<br />
BASIC SUPPORTING<br />
GEOGRAPHICAL DATA<br />
Forcast-Identify<br />
HAZARD<br />
WHEN<br />
WHEN<br />
(24 h)<br />
(xx h)<br />
MAP<br />
MAP<br />
HOW<br />
HOW<br />
(Intensity)<br />
(Intensity)<br />
combine<br />
combine<br />
DE O DE DE O DE DE O DE<br />
MAP<br />
MAP<br />
MAP<br />
CROSS<br />
CROSS<br />
CROSS<br />
DE O DE DE O DE DE O DE<br />
MAP<br />
MAP<br />
MAP<br />
(PV4)<br />
COST/WORTH<br />
REDUCTION ALTERNATIVES<br />
ELEMENTS<br />
AT RISK<br />
(PV2)<br />
MAP<br />
VUlNERABILiTY<br />
CHANGE<br />
(FV1)<br />
URGENT VULNERABILITY<br />
REDUCTION MEASURES<br />
MAP<br />
PAST<br />
DAMAGES<br />
DAMAGE<br />
POTENTIAL<br />
CURVES<br />
STRUCTURAL<br />
CHARACTER<br />
CHANGE<br />
ECONOMIC<br />
CROSS<br />
EXPOSURE<br />
During prevention task, hazard-related data<br />
and models (among which <strong>monitor</strong>ing data)<br />
are aimed at defining – in non-real time and<br />
with reference to long term conditions relevant<br />
chareacteristics of hazard processes; triggering<br />
conditions and thresholds (either related to<br />
causes or intensity of the hazard processes);<br />
possible hazard mitigation alternatives.<br />
On such basis, hazards at different probability<br />
of occurrence (i.e. return periods) can<br />
be outlined in terms of areas involved and<br />
expected intensity. By using this information in<br />
conjunction with mitigation alternatives that<br />
have been eventually undertaken, predicted<br />
event scenarios can be outlined.<br />
Vulnerability related data and models must<br />
be used to define vulnerability characteristics<br />
of elements at <strong>risk</strong>, and identify<br />
possible vulnerability mitigation alternatives.<br />
By combining this information with event<br />
scenarios, the predicted damage scenarios are<br />
obtained with reference to different probability<br />
of occurrence. Value and/or strategic<br />
worth relevant data allows assesing the<br />
different predicted loss scenarios, that must<br />
be com puted by identifying and eventually<br />
implementing value-worth reduction-mitigation<br />
alternatives.<br />
Models are used to forecast the future shortmid<br />
term trend of triggering causes and also<br />
the possible evolution of the expected hazard<br />
processes. On such basis, nowcasting of hazard<br />
and forecasting of hazard in the short-mid<br />
term can be obtained.<br />
Information regarding hazard mitigation<br />
measures undertaken on prevention, or the<br />
mitigation measures that can be undertaken<br />
urgently to control the hazard processes, are<br />
used in conjunction with hazard information in<br />
order to depict the predicted event scenario in<br />
the short and mid-term.<br />
All the information and data about vulnerability<br />
that where acquired, processed and<br />
synthesised in prevention phase, become useful<br />
since they allow nowcasting and forecasting<br />
expected damage scenarios, that must be draw<br />
out by accounting for possible implementation<br />
of urgent vulnerability reduction measures.<br />
Subsequently, all the information and data<br />
about value and worth must be used and updated<br />
accordingly to possible urgent cost-worth<br />
reduction measures (e.g. eva cuation measures),<br />
so to outline expected loss scenarios.<br />
During response, a timely update on the<br />
ongoing situation is essential. Response is carried<br />
out while forecasting is still ongoing, so to have<br />
a clear picture of what is actually going on and<br />
of what can happen next in the short term.<br />
Evaluation of the ongoing hazard processes<br />
and of the performance/efficacy of hazard<br />
mitigation measures implemented in prevention<br />
and forecast is essential to assess hazard and<br />
ongoing event scenario. In this phase, the feedback<br />
of data (observations-measurements etc.)<br />
from the field is essential and can be carried out<br />
via different means.<br />
CROSS<br />
CROSS<br />
CROSS<br />
RISK<br />
DE O DE DE O DE DE O DE<br />
(FR2)<br />
EXPECTED<br />
MAP<br />
MAP<br />
MAP<br />
LOSS Scenarios<br />
Figure 42: Information flows during preparedness phase (A. CORSINI)<br />
(PV3)<br />
MAP<br />
VALUE/WORTH<br />
CHANGE<br />
(FV1)<br />
URGENT COST/WORTH<br />
REDUCTION MEASURES<br />
STRATEGIC<br />
During warning phase, hazard-related<br />
<strong>monitor</strong>ing data are primarily aimed at<br />
verifying, in real time and with reference to<br />
short-mid term conditions, if the thresholds<br />
defined during prevention (regarding causes<br />
and hazard processes) are likely to be reached<br />
or have been already reached.<br />
Figure 43: Information flows during response phase (A. CORSINI)<br />
At the same time, the direct observationmeasurement<br />
of the efficacy of vulnearability<br />
and/or cost-worth reduction measures that<br />
have been set up during prevention and<br />
forecast, is fundamental in order to define and<br />
continously update ongoing damage and loss<br />
scenarios.
42 Monitor II MONITOR II CSA<br />
Monitor II MONITOR II CSA 43<br />
How to keep<br />
(information)<br />
control: CSA<br />
Goals<br />
CSA technology<br />
The primary goal of the MONITOR II CSA<br />
(Continuous Situation Awareness) is to improve<br />
situation awareness and knowledge about<br />
those situations, which are relevant for disaster<br />
<strong>management</strong>. This goal has to be achieved for<br />
different stakeholders in different phases of the<br />
disaster <strong>management</strong> cycle.<br />
The main operational goal is thus to identify<br />
and assess situations, according to pre-defined<br />
types of situations and rules.<br />
Situation awareness depends on the integration<br />
of a (large) number of information from<br />
different sources and to evaluate these in<br />
different levels of detail. This process is usually<br />
called information fusion. Information fusion is<br />
at the heart of the CSA.<br />
on terms<br />
Situation awareness is “knowing<br />
what is going on around oneself.”<br />
CSA vision<br />
The CSA supports disaster <strong>management</strong><br />
processes with information provision<br />
• relevant for the current situation<br />
and the corresponding tasks of the user<br />
• integrated into seamless view<br />
• communicated in an easily understandable<br />
manner.<br />
The MONITOR II CSA tool will consist of<br />
several components and modules for supporting<br />
users in planning tasks, situation assessment,<br />
decision making and communication/<br />
documentation. These modules can be used in<br />
a flexible combination and extended according<br />
to region specific needs.<br />
Open standards<br />
The MONITOR II CSA is a series of software<br />
components, which allows the easy<br />
inte gration, presentation and use of disaster<br />
<strong>management</strong> information. The CSA supports<br />
the information needs of different phases of<br />
the <strong>risk</strong> <strong>management</strong> cycle.<br />
The system architecture of the CSA takes into<br />
account the existence and well established use<br />
of legacy systems. This means that the components<br />
of the CSA follow some design rules:<br />
• they are standards based, supporting<br />
OGC standard (like WMS, WFS or Sensor<br />
Web) and INSPIRE whereever feasible;<br />
• they define open service oriented<br />
interfaces, allowing to integrate them with<br />
other components;<br />
• their functionality is encapsulated so that<br />
they function indepently of specific other<br />
components and/or information sources;<br />
• their modular design ist defined on<br />
thematic and interoperable units.<br />
The CSA is designed to store event data in a<br />
special CSA database. Object data - like buildings<br />
or roads - are assumed to be stored in the<br />
local, regional or national GIS. The CSA can<br />
use these object data directly if they conform<br />
to the thematically corrspeonding INSPIRE<br />
implementation rules. Otherwise a transformation<br />
of data is necessary.<br />
Interaction with other systems<br />
MONITOR II project is well aware of the fact<br />
that partners and potential users have developed<br />
a number of well established systems.<br />
These systems have been built with considerable<br />
costs and many users are accustomed to<br />
using them. The consequences from this are<br />
• MONITOR II CSA provides solutions only<br />
as a complement to existing systems<br />
• MONITOR II CSA strongly builds upon<br />
and is dependent upon interactions with<br />
existing and planned systems
44 Monitor II MONITOR II CSA<br />
Monitor II MONITOR II CSA 45<br />
CSA modules<br />
The CSA will provide modules for different<br />
purposes. These purposes can be related to<br />
phased of the <strong>risk</strong> <strong>management</strong> cycle:<br />
Figure 43: MONITOR II CSA modules within the <strong>risk</strong> <strong>management</strong> cycle<br />
The CSA core module serves for services<br />
integration, as rule engine and for visualisation<br />
purposes. It includes all basic administration<br />
functionality (user administration, authorisation<br />
and security <strong>management</strong>, service configuration)<br />
and allows to interface to GIS integration<br />
services (WMS, WFS, …). Basic user inter action<br />
- like mapping, querying and filtering and<br />
searching is provided via easy to use web client.<br />
The sensor manager supports the inte gration<br />
of sensor information of various sources (by<br />
using standards like sensor web) and helps<br />
to configure and <strong>monitor</strong> sensors. Sensor<br />
generated information can be visualised (on<br />
maps, in charts) and analysed – together with<br />
other information sources provided via CSA<br />
core module.<br />
Figure 44: MONITOR II scenario manager supports the definition of observation points<br />
for further use in contingency planning<br />
Figure 45: MONITOR II documentation manager visualized all relevant parameters of an<br />
event in its development over time<br />
The scenario manager supports the definition<br />
of hazard scenarios and to link them to hazard<br />
maps. Ths shall help to communicate scenarios<br />
and to provide an information base for<br />
contingency plans.<br />
The contingency manager supports the<br />
definition of contingency plans (conforming<br />
to contingency planning guidelines as defined<br />
in MONITOR II) in a digital, GIS based way.<br />
In response phase these digital contingency<br />
plans support the <strong>monitor</strong>ing and execution of<br />
contingency plans (the work-flow of measures)<br />
and after an event to evaluate the contingency<br />
plan and update the contingency plan.<br />
The documentation manager provides mobile<br />
information viewing and mobile information.<br />
On platforms like smartphones or tablets<br />
the user is supported in mobile observation<br />
(with the help of augmented reality), reporting<br />
and information collection. All information can<br />
be interfaced with thecore system and used for<br />
reporting and documentation purposes.
46 Monitor II Literature and authors<br />
Monitor II Partners 47<br />
MONITOR II Partners<br />
Authors contacts<br />
Hubert Siegel<br />
Lead Partner BMLFUW, Austria<br />
hubert.siegel@lebensministerium.at<br />
Stefan Kollarits<br />
PRISMA solutions, Austria<br />
stefan.kollarits@prisma-solutions.at<br />
Diethart Leber<br />
Geoexpert, Austria<br />
leber@geoexpert.at<br />
Alessandro Corsini<br />
Partner 08 UNIMORE<br />
allecors@unimore.it<br />
TO BE COMPLETED<br />
Literature<br />
Cruden, D.M., 1991.<br />
A simple definition of a landslide.<br />
Bulletin International Association for<br />
Engineering Geology, 43: 27-29.<br />
Dickau, R., Brundsden,<br />
D., Schrott, L., Ibsen, M.-L., (Eds.) 1996.<br />
Landslide Recognition – Identification, Movement<br />
and Courses. 251 p.,Wiley.<br />
EPOCH (European Community Programme)<br />
1993.<br />
Temporal Occurrence and Forecasting of Landslides<br />
in the European Community, (Ed. J.-C.<br />
Flageollet), 3 Volumes, Contract No. 900025.<br />
Varnes, D. J. 1978.<br />
Slope movement types and processes.<br />
In: Special Report 176: Landslides:<br />
Analysis and Control (Eds: Schuster,<br />
R. L. & Krizek, R. J.). Transportation and Road<br />
Research Board, National Academy of Science,<br />
Washington D. C., 11-33<br />
WISNER et al. (2002)<br />
KOLLARITS et al. (2007)<br />
EXIMAP (2007): Handbook on good practices<br />
for flood mapping in Europe.<br />
Directive 2007/60/EC:<br />
Lead Partner<br />
BMLFUW<br />
Federal Ministry of Agriculture, Forestry,<br />
Environment and Water Management,<br />
Forest Department<br />
Vienna, Austria<br />
www.lebensministerium.at<br />
Project Partners<br />
02 OEBB<br />
Federal Railways Railnet Austria Inc.<br />
Railway Services<br />
Natural Hazards Management<br />
Vienna, Austria<br />
www.oebb.at<br />
03 PUH<br />
Torrent and Erosion Control Service<br />
Ljubljana, Slovenia<br />
www.puh.si<br />
04 UL-FGG<br />
University of Ljubljana<br />
Faculty of Civil and Geodetic Engineering<br />
Ljubljana, Slovenia<br />
www.fgg.uni-lj.si<br />
05 BZ-CP<br />
Autonomous Province of Bolzano South Tyrol<br />
Department of Fire Control and Civil Protection<br />
Bolzano, Italy<br />
www.provinz.bz.it/zivilschutz<br />
06 ROMSILVA<br />
National Forest Administration<br />
Development Department<br />
Bucharest, Romania<br />
www.rosilva.ro<br />
07 UNIMORE<br />
University of Modena and Reggio Emilia<br />
Department of Earth Sciences<br />
Modena, Italy<br />
www.terra.unimore.it<br />
08 DAG<br />
State Forestry Agency<br />
Sofia, Bulgaria<br />
www.dag.bg<br />
11 IMIBAS<br />
Institute of Mathematics and Informatics<br />
at the Bulgarian academy of Sciences<br />
Sofia, Bulgaria<br />
www.math.bas.bg/index.html<br />
12 REMTH<br />
The Hellenic Republic<br />
Region of East Macedonia – Thrace<br />
Komotini, Greece<br />
www.remth.gr<br />
13 OTRG<br />
Office of the Tyrolean Regional Government<br />
Regional Forestry commission (public)<br />
Innsbruck, Austria<br />
www.tirol.gv.at/wald<br />
10% Project Partner<br />
UNIBG<br />
(financed by Lead Partner)<br />
Belgrade University<br />
Faculty of Forestry<br />
Department of Ecological Engineering in Soil<br />
and Water resources Protection<br />
Belgrade, Serbia<br />
www.sfb.bg.ac.yu
MONITOR II within the<br />
South East Europe programme<br />
The South East Europe programme (SEE) is a unique instrument which, in the framework<br />
of the Regional Policy’s Territorial Cooperation Objective, aims to improve integration and<br />
competitiveness in an area which is as complex as it is diverse.<br />
The programme is supporting projects developed within four Priority Axes: Innovation,<br />
Environment, Accessibility, and Sustainable Growth Areas - in line with the Lisbon and<br />
Gothenburg priorities, and is also contributing to the integration process of the non-EU<br />
member states.<br />
More information about MONITOR II and SEE:<br />
www.<strong>monitor</strong>2.org, <strong>monitor</strong><strong>ii</strong>@prisma-solutions.at<br />
www.southeast-europe.net