Channeling the Energy - Marine Renewables Canada
Channeling the Energy - Marine Renewables Canada
Channeling the Energy - Marine Renewables Canada

You also want an ePaper? Increase the reach of your titles
YUMPU automatically turns print PDFs into web optimized ePapers that Google loves.
www.renewable-uk.com<br />
<strong>Channeling</strong> <strong>the</strong> <strong>Energy</strong><br />
A Way Forward for <strong>the</strong> UK Wave & Tidal Industry Towards 2020<br />
October 2010<br />
RenewableUK previously:
1<br />
About RenewableUK<br />
RenewableUK is <strong>the</strong> trade and<br />
professional body for <strong>the</strong> UK wind<br />
and marine renewables industries.<br />
Formed in 1978, and with 652 corporate<br />
members, RenewableUK is <strong>the</strong> leading<br />
renewable energy trade association<br />
in <strong>the</strong> UK. In 2004, RenewableUK<br />
expanded its mission to champion<br />
wave and tidal energy and use <strong>the</strong><br />
Association’s experience to guide <strong>the</strong>se<br />
technologies along <strong>the</strong> same path to<br />
commercialisation.<br />
Our primary purpose is to promote<br />
<strong>the</strong> use of wind, wave and tidal power in<br />
and around <strong>the</strong> UK. We act as a central<br />
point for information for our membership<br />
and as a lobbying group to promote<br />
wind energy and marine renewables<br />
to government, industry, <strong>the</strong> media<br />
and <strong>the</strong> public. We research and find<br />
solutions to current issues and generally<br />
act as <strong>the</strong> forum for <strong>the</strong> UK wind,<br />
waveand tidal industry, and have<br />
an annual turnover in excess of four<br />
million pounds.<br />
Acknowledgment<br />
This report was prepared by<br />
RenewableUK using information<br />
derived both from published studies<br />
and from industry members. Entec<br />
provided support to RenewableUK<br />
to help interpret and analyse <strong>the</strong><br />
results. Where possible <strong>the</strong> information<br />
has been checked against original<br />
sources to ensure that it is used in<br />
context. Some information provided<br />
by members was given in confidence<br />
to RenewableUK and was provided to<br />
Entec only in aggregated form. Except<br />
where stated, Entec has not completed<br />
independent checks of <strong>the</strong> validity of<br />
<strong>the</strong>se sources and has interpreted <strong>the</strong><br />
information in good faith. The opinions<br />
and conclusions in this report are those<br />
of <strong>the</strong> contributors and RenewableUK<br />
members; <strong>the</strong>y do not necessarily<br />
represent <strong>the</strong> views of Entec.<br />
Kreab Gavin Anderson also<br />
contributed to <strong>the</strong> report, interviewing<br />
a range of utility companies and OEMs<br />
to obtain <strong>the</strong>ir views on <strong>the</strong> marine<br />
sector. These interviews were designed<br />
to understand <strong>the</strong> organisations’<br />
involvement in wave and tidal<br />
projects to date, <strong>the</strong>ir role in funding<br />
development, <strong>the</strong>ir views on financial<br />
incentives and <strong>the</strong>ir general perceptions<br />
of <strong>the</strong> future of <strong>the</strong> UK marine sector.<br />
Interviews were undertaken during July<br />
and August 2010 and are reported on<br />
an unattributable basis.<br />
Kreab Gavin Anderson is a global<br />
public relations and communications<br />
consultancy, with particular expertise<br />
in <strong>the</strong> cleantech sector. KGA’s<br />
consultants are experts in financial<br />
communications, corporate positioning,<br />
crisis management, public affairs and<br />
government relations.<br />
Entec is an environmental and<br />
engineering consultancy and employs<br />
specialists who work for our clients in<br />
<strong>the</strong> private and public sectors on <strong>the</strong><br />
economics, technology and application<br />
of renewable and low carbon energy.<br />
Entec are part of AMEC. Entec is<br />
pleased to be involved with this work<br />
and to help ensure that information<br />
valuable in <strong>the</strong> debate on marine energy<br />
is aired. Entec also hopes that <strong>the</strong> study<br />
will promote quality discussion on <strong>the</strong><br />
key issues.<br />
Table of Contents<br />
1. Executive Summary & Key Conclusions__________________________________________________________________________ 2<br />
2. Social and Economic Benefits of Developing a World Leading <strong>Marine</strong> <strong>Energy</strong> Industry_________________________________ 4<br />
3. Securing Economic Benefit from Renewable <strong>Energy</strong>_______________________________________________________________ 8<br />
4. Private Sector Investor Perceptions of <strong>the</strong> UK <strong>Marine</strong> <strong>Energy</strong> Industry________________________________________________ 12<br />
5. Costs for Developing <strong>Marine</strong> Technology_ ________________________________________________________________________ 18<br />
6. Measures to Support <strong>Marine</strong> <strong>Energy</strong>_ ____________________________________________________________________________ 22
2<br />
1. Executive Summary & Key Conclusions<br />
The UK is currently leading <strong>the</strong> world in <strong>the</strong><br />
rapidly developing marine (wave and tidal) energy<br />
industry, with 2.4MW installed, a world leading<br />
testing infrastructure to support deployment, a high<br />
concentration of technology developers and more<br />
project leases having been awarded than <strong>the</strong> rest<br />
of <strong>the</strong> globe combined. 1<br />
“ In <strong>the</strong> next five years <strong>the</strong><br />
UK has a unique opportunity<br />
to establish itself as global<br />
centre of <strong>the</strong> future marine<br />
energy industry…”<br />
Based on deployment Scenario 3 in The<br />
Offshore Valuation, 2 market retention<br />
figures published by <strong>the</strong> Carbon Trust 3<br />
and proportional project distribution<br />
figures obtained via a survey of<br />
RenewableUK members 4 it is estimated<br />
that <strong>the</strong> UK could secure a marine<br />
energy industry worth up to £6.1bn per<br />
annum, which would directly employ<br />
as many as 19,500 individuals and<br />
contribute GVA to <strong>the</strong> UK economy in<br />
<strong>the</strong> region of £800m per annum by 2035.<br />
The views and opinions of potential<br />
future and current investors in <strong>the</strong> sector<br />
highlight a willingness to engage with<br />
technology development; however<br />
start-up investment costs could prove<br />
to be a major hurdle to future UK<br />
industry prospects. From analysis of<br />
<strong>the</strong> development of <strong>the</strong> onshore wind<br />
industry it is evident that a coordinated<br />
government support framework is<br />
essential to establish a world leading<br />
renewable energy industry.<br />
In <strong>the</strong> next five years <strong>the</strong> UK has a<br />
unique opportunity to establish itself as<br />
global centre of <strong>the</strong> future marine energy<br />
industry, if it can ensure <strong>the</strong> delivery of<br />
<strong>the</strong> world first marine energy arrays and<br />
provide long term stable market support.<br />
In light of this <strong>the</strong> key actions for varying<br />
stages of industry development can be<br />
summarised as follows:<br />
1. RenewableUK, 2010. <strong>Marine</strong> Renewable <strong>Energy</strong> - State of <strong>the</strong> Industry 2010<br />
2. Public Interest Research Centre, 2010. The Offshore Valuation. P 54<br />
3. Carbon Trust, 2009. Focus for success - A new approach to commercialising low carbon technologies. P 66<br />
4. Contributors included Aquamarine Power, Atlantis Resource Corporation and Pelamis Wave Power.<br />
5. NASA, 2010. http://esto.nasa.gov/files/TRL_definitions.pdf Viewed - 15/10/2010
3<br />
First and Next Generation Prototype -<br />
Technology Readiness Level (TRL) 5<br />
1-7 - Up to 1MW<br />
Recent funding schemes have<br />
been highly effective but need to be<br />
continued over a number of years to<br />
bring technology to <strong>the</strong> point where <strong>the</strong><br />
industry can move on to <strong>the</strong> first arrays.<br />
During <strong>the</strong> next comprehensive<br />
spending review period government<br />
must ensure <strong>the</strong> delivery of targeted<br />
funding that continues to bridge <strong>the</strong><br />
technology market gaps in a coordinated<br />
manner from <strong>the</strong> varying UK funding<br />
bodies, departments and devolved<br />
administrations.<br />
First Wave and Tidal Farms -<br />
TRL 8-9 - 2-10MW<br />
UK and Scottish Government<br />
should work towards providing a<br />
complementary combined grant and<br />
revenue package to incentivise utilities<br />
and original equipment manufacturers<br />
to invest in and deliver <strong>the</strong> world’s first<br />
marine energy arrays in <strong>the</strong> next three to<br />
five years.<br />
Capital funding of £251m is <strong>the</strong><br />
minimum amount required to support<br />
this first build, which will halve to roughly<br />
£131m if revenue support is provided at<br />
a level of 5 ROCs, <strong>the</strong> revenue portion<br />
of this support could alternatively be<br />
provided by an interim FiT.<br />
The capital funding could be<br />
potentially sourced from <strong>the</strong> SRO £186m<br />
fund, <strong>the</strong> MRDF £42m and EU funds<br />
(e.g. NER 300).<br />
Second Farm and Beyond -<br />
TRL 8-9 - 10MW+<br />
Scottish and UK Government must<br />
provide sufficient, stable and level<br />
revenue support at a level of 5 ROCs<br />
for both wave and tidal technologies to<br />
ensure continued interest from Utilities<br />
and OEMs and until <strong>the</strong> industry has<br />
matured.<br />
The above recommendations provide a<br />
coherent support framework that should<br />
be executed in a coordinated approach.<br />
If implemented correctly <strong>the</strong>y will<br />
allow <strong>the</strong> industry to grow to <strong>the</strong> scale<br />
predicted above.<br />
RenewableUK recommends<br />
that to achieve coordination <strong>the</strong> UK<br />
Government and <strong>the</strong> sector, should<br />
investigate and implement a mechanism<br />
or forum to continue to develop a long<br />
term strategy and delivery processes for<br />
<strong>the</strong> UK marine energy industry.
4<br />
2. Social And Economic Benefits Of Developing<br />
A World Leading <strong>Marine</strong> <strong>Energy</strong> Industry<br />
To date <strong>the</strong> UK has installed 2.4 MW of marine<br />
energy and generated over 2,500MWh to <strong>the</strong><br />
UK grid.<br />
To date <strong>the</strong> UK has installed 2.4 MW<br />
of marine energy and generated over<br />
2,500MWh to <strong>the</strong> UK grid. The Crown<br />
Estate recently awarded development<br />
leases for 1.2GW of projects in <strong>the</strong><br />
Pentland Firth and Orkney waters, which<br />
consisted of eight projects ranging in<br />
size from 50MW to 200MW and provides<br />
<strong>the</strong> UK with <strong>the</strong> most developed<br />
plans for commercial deployment of<br />
marine energy projects. The industry is<br />
supported by a host of testing facilities<br />
including <strong>the</strong> National Renewable<br />
<strong>Energy</strong> Centre, <strong>the</strong> European <strong>Marine</strong><br />
<strong>Energy</strong> Centre, Wave Hub and QinetiQ.<br />
It was also able to secure in excess of<br />
£41m of private investment in <strong>the</strong> past<br />
year alone. 6<br />
It has been well documented that <strong>the</strong><br />
development of a successful marine<br />
industry could help <strong>the</strong> UK achieve both<br />
its 2020 and 2050 renewable energy<br />
and climate change targets whilst also<br />
providing security of supply and bringing<br />
significant social and economic benefits,<br />
<strong>the</strong> scale of which will depend heavily<br />
upon <strong>the</strong> domestic and export market<br />
potential and <strong>the</strong> proportion of which<br />
that is secured by UK plc. 7,8<br />
For <strong>the</strong> purpose of this report marine<br />
energy refers to energy extracted from<br />
wave energy and tidal stream energy.<br />
Resource Analysis<br />
The UK and Europe have a vast marine<br />
energy resource which could produce<br />
between 15-20% of <strong>the</strong> current UK<br />
electricity demand 9 and 15% of EU<br />
electricity demands, 10 representing a<br />
substantial domestic and export market<br />
(Table 2.1).<br />
Estimated<br />
Market Size (GW)<br />
2020 2050<br />
Domestic 1.5 11 36 12<br />
Export (EU - excluding UK) 2.1 13 152 14<br />
Table 2.1 - Summary of <strong>the</strong><br />
Domestic and Export <strong>Marine</strong><br />
<strong>Energy</strong> Market Potential 15<br />
6. RenewableUK, 2010. <strong>Marine</strong> Renewable <strong>Energy</strong> - State of <strong>the</strong> Industry 2010<br />
7. Carbon Trust, 2006. Future <strong>Marine</strong> <strong>Energy</strong>.<br />
8. BWEA, 2006. Path to Power.<br />
9. Carbon Trust, 2006. Future <strong>Marine</strong> <strong>Energy</strong>.<br />
10. EU-OEA, 2010. Oceans of <strong>Energy</strong> - 2020 Road Map.<br />
11. RenewableUK, 2010. <strong>Marine</strong> Renewable <strong>Energy</strong> - State of <strong>the</strong> Industry 2010 - Estimated installed capacity 1 - 2GW. 1.5GW is used as a mid range target.<br />
12. Public Interest Research Centre, 2010. The Offshore Valuation. P 54. The offshore valuation represents <strong>the</strong> most recent deployment scenarios for practically<br />
extractable wave and tidal energy in UK waters at <strong>the</strong> time of print, with contributions from UK Government, Industry and <strong>the</strong> Crown Estate. Development Scenario<br />
3 states a potential installed capacity of 36.3GW. It is noted that this is higher than any previous practically extractable wave and tidal energy resource estimations<br />
for UK waters.<br />
13. EU-OEA , 2010. Oceans of <strong>Energy</strong> - 2020 Road Map - Target Capacity of 3.6GW, minus 1.5GW for <strong>the</strong> UK results in a European Market of 2.1GW.<br />
14. EU-OEA , 2010. Oceans of <strong>Energy</strong> - 2020 Road Map - Target Capacity of 188GW, minus 36GW for <strong>the</strong> UK results in a European Market of 152GW.<br />
15. RenewableUK believes that additional work will be required to define <strong>the</strong> global market potential.
5<br />
From a review of recent studies of <strong>the</strong><br />
socioeconomic impact of marine energy,<br />
it is evident that development of <strong>the</strong><br />
industry will be capital intensive with<br />
commensurate impacts on <strong>the</strong> economy,<br />
resulting in a continuous requirement for<br />
labour for construction, installation and<br />
decommissioning services toge<strong>the</strong>r with<br />
an ongoing requirement (with a different<br />
set of labour skills) to support operations<br />
16, 17, 18<br />
and maintenance.<br />
UK Content<br />
Existing marine energy supply chain<br />
studies conclude that marine energy<br />
provides employment onshore in<br />
manufacturing, offshore in installation<br />
and servicing and in shore-side<br />
in support activities. It provides<br />
opportunities both in industrial areas<br />
inland and on <strong>the</strong> coast and provides<br />
links between <strong>the</strong>m.<br />
In general terms, impacts are<br />
‘additional’ and predominately result in<br />
new jobs ra<strong>the</strong>r than movement of jobs<br />
from one industry to ano<strong>the</strong>r. Whilst it<br />
is thought that <strong>the</strong> existing skills base<br />
will be insufficient to deliver <strong>the</strong> industry<br />
growth needed, <strong>the</strong>se skills can and<br />
must be developed within <strong>the</strong> UK to<br />
ensure sustainable future employment<br />
opportunities.<br />
Overall, <strong>the</strong>re is potential for <strong>the</strong><br />
UK marine energy suppliers to service<br />
<strong>the</strong> entire supply chain as well as<br />
organising its integration. Fur<strong>the</strong>rmore<br />
having developed such capability<br />
it should be possible to service<br />
overseas as well as UK marine energy<br />
developments.<br />
The economic benefits and job creation<br />
generated by <strong>the</strong> growth of <strong>the</strong> marine<br />
energy industry would also be beneficial<br />
to <strong>the</strong> UK and enable <strong>the</strong> redeployment<br />
of skilled staff from any decline in <strong>the</strong> oil<br />
and gas industries.<br />
Whilst securing 100% of <strong>the</strong><br />
market is unrealistic, if <strong>the</strong> correct<br />
political, financial and consenting<br />
environment were to be established<br />
a high percentage could be retained.<br />
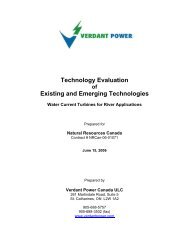
RenewableUK conducted a survey<br />
of leading technology developers to<br />
understand <strong>the</strong> estimated future project<br />
cost break-down. 20 It is evident from<br />
Figure 2.1 that <strong>the</strong> three areas of highest<br />
economic benefit are in manufacture<br />
and construction, installation and<br />
grid connection, subsea and onshore<br />
infrastructure. This echoes <strong>the</strong> results of<br />
a similar survey conducted by <strong>the</strong> Forum<br />
for Renewable <strong>Energy</strong> Development<br />
Scotland. 21<br />
Figure 1<br />
Figure 2.1 - Estimated future project cost breakdown - nominal farm capacity 30MW<br />
Project Management/Development<br />
R&D and engineering design studies<br />
Grid Connection, Subsea and Onshore Infrastructure<br />
Installation<br />
O&M<br />
Figure 5<br />
Device structure & Components -manufacture & construction<br />
100%<br />
90%<br />
16. SQW report for Aquamarine Power, 2009. Socio-Economic 80% Impact Assessments of Aquamarine Power’s Oyster Projects.<br />
17. ECONorthwest report for Oregon Wave <strong>Energy</strong> Trust, 2009. 70% Economic Impact of Wave <strong>Energy</strong> to Oregon’s Economy.<br />
18. Sgurr <strong>Energy</strong> report for FREDS <strong>Marine</strong> <strong>Energy</strong> Group, 2009. 60% Supply Chain Report Analysis.<br />
19. Carbon Trust, 2009. Focus for Success, A new approach to 50% commercialising low carbon technologies.<br />
20. Contributors included Aquamarine Power, Atlantis Resource Corporation and Pelamis Wave Power.<br />
40%<br />
21. Sgurr <strong>Energy</strong> Report for FREDS <strong>Marine</strong> <strong>Energy</strong> Group, 2009. Supply Chain Report Analysis.<br />
30%<br />
O<strong>the</strong>r<br />
Revenue support<br />
Angel Investor<br />
Private Industrial<br />
Private Venture Capital<br />
Public Venture Capital<br />
Grants<br />
20%<br />
10%
6<br />
Figure 2.2 - Potential Domestic Figure and 2 Export Market Share - 2020-2050<br />
% Market Share<br />
60<br />
50<br />
40<br />
30<br />
20<br />
10<br />
0<br />
R&D,<br />
Engineering<br />
& Design<br />
Manufacturing Project<br />
Management,<br />
Development<br />
& Installation<br />
O&M<br />
Figure 6<br />
1,000<br />
Figure 2.2 normalises <strong>the</strong> estimated<br />
project costs of varying sectors of a<br />
marine energy 500 project and correlates<br />
<strong>the</strong>m to <strong>the</strong> estimated domestic and<br />
export markets - share which could be<br />
Stage 1 - First and Next<br />
secured by <strong>the</strong> UK within <strong>the</strong>se sectors<br />
Generation Prototype<br />
in 2020 and 2050. 22 TRL 1-7<br />
Based on deployment Scenario 3<br />
in The Offshore Valuation 23 and upon <strong>the</strong><br />
market retention figures in Figure 2.2,<br />
<strong>the</strong> UK could secure a marine energy<br />
industry worth up to £6.1bn per annum,<br />
directly employ as many as 19,500<br />
individuals and produce a GVA in <strong>the</strong><br />
region of £800m per annum by 2035<br />
(Table 2.2). Throughout this analysis it<br />
was noted that <strong>the</strong> date at which <strong>the</strong>se<br />
socio-economic benefits are reached<br />
Grid Connection,<br />
Subsea &<br />
Onshore<br />
Infrastructure<br />
Proportional Project<br />
Costs (based on<br />
commercial project<br />
with nominal size of<br />
30MW).<br />
Domestic 2020<br />
Domestic 2050<br />
Export 2020<br />
Export 2050<br />
Table 2.2 – Socio-economic impacts from developing a UK <strong>Marine</strong> <strong>Energy</strong> Industry<br />
Annual 2,500 value to UK £3.7bn £6.1bn £5.9bn<br />
Number of individuals directly employed<br />
Funding gap<br />
10,000 19,500 19,000<br />
UK share 2,000 of domestic market Available finance<br />
80% 71% 65%<br />
UK share of export market 22% 14% 9%<br />
£ million<br />
1,500<br />
Gross Value Added £530m £800m £770m<br />
Stage 2 - First Wave and<br />
Tidal Farms<br />
TRL 8-9<br />
2020 2035 2050<br />
will depend heavily upon domestic and<br />
global deployment rates, as a faster<br />
industry establishment will result in<br />
earlier industry maturation.<br />
The following points should be<br />
Stage 3 - Second Farms Total<br />
borne in mind when interpreting <strong>the</strong> data<br />
and Beyond<br />
from Table 2.2: TRL 8-9<br />
• The annual value is <strong>the</strong> total capital and<br />
operating cost (excluding financing costs<br />
and interest charges), spend on goods<br />
and services provided domestically.<br />
• Jobs are numbers of Full Time<br />
Equivalent (FTE) staff working directly<br />
in <strong>the</strong> marine energy industry. Their<br />
spending would also lead to <strong>the</strong><br />
creation of a substantial number of<br />
additional induced jobs in <strong>the</strong> wider<br />
economy. Jobs numbers reflect<br />
Carbon Trust estimates for 2040, and<br />
are scaled pro-rata to <strong>the</strong> annual value<br />
900<br />
for <strong>the</strong> industry in 2020 and 2050. 24<br />
800<br />
RenewableUK is currently undertaking<br />
700<br />
additional research to provide greater 600<br />
clarity on <strong>the</strong> sectors <strong>the</strong>se jobs are 500<br />
400<br />
likely to be created in. This work<br />
300<br />
will also review <strong>the</strong> current levels<br />
200<br />
of employment, scrutinise existing<br />
100<br />
predictions on future employment 0<br />
levels and provide greater certainty on<br />
this issue. R&D<br />
• GVA uses <strong>the</strong> number Capital Grants of direct jobs<br />
multiplied by a typical<br />
Production<br />
estimate<br />
Incentives<br />
of GVA<br />
to employee ratio, for engineering<br />
based industries.<br />
• The decline in <strong>the</strong> figures from 2035<br />
to 2050 can be attributed to <strong>the</strong><br />
rate of UK deployment altering from<br />
2.3GW installed per annum in 2035 to<br />
1.3GW per annum 120 in 2050, a function<br />
of practically extractable resource<br />
limitations. 25 100<br />
Wind Industry Support (£ million)<br />
Commercialising<br />
80<br />
<strong>Marine</strong><br />
<strong>Energy</strong> Technology<br />
60<br />
Whilst <strong>the</strong> UK is currently leading<br />
marine energy technology development,<br />
40<br />
significant work is still required to<br />
reach <strong>the</strong> stage at which projects can<br />
20<br />
be commercially viable. Based upon<br />
<strong>the</strong> UKERC and 0 ETI UK marine energy<br />
deployment strategy 26 and correlated<br />
TRL 1-7<br />
to NASA Technology Readiness Levels<br />
(TRL), 27 Figure 2.3 provides a basic<br />
outline of <strong>the</strong> anticipated stages of<br />
industry development, showing <strong>the</strong><br />
transition from capital support to<br />
revenue support, from prototypes and<br />
next generation devices through first<br />
farms and beyond.<br />
£ million<br />
Wind Industry Public<br />
De<br />
Figu<br />
TRL 1-7 Recent A<br />
22. Carbon Trust, 2009. Focus for Success, A new approach to commercialising low carbon technologies. P 66<br />
23. Public Interest Research Centre, 2010. The Offshore Valuation.<br />
24. Carbon Trust, 2009. Focus for success - A new approach to commercialising low carbon technologies. P 68<br />
25. Public Interest Research Centre, 2010. The Offshore Valuation.<br />
26. <strong>Energy</strong> technology Institute and UK <strong>Energy</strong> Research Centre, 2010. <strong>Marine</strong> <strong>Energy</strong> Technology Roadmap<br />
27. NASA, 2010. http://esto.nasa.gov/files/TRL_definitions.pdf Viewed - 15/10/2010
7<br />
Figure 2.3 - Stages of <strong>Marine</strong> <strong>Energy</strong> Industry Development<br />
1st & Next Generation Prototype<br />
Market Push:<br />
E.g. Capital Grants<br />
First Wave/Tidal Farms<br />
Market Push AND Pull:<br />
E.g. Capital Grants (Push)<br />
E.g. Multiple ROCs (Pull)<br />
2nd Farms and Beyond<br />
Market Pull:<br />
E.g. Multiple ROCs<br />
1. First and Next Generation Prototype -<br />
TRL 1-7 - Up to 1MW<br />
Capital support is vital to <strong>the</strong> industry<br />
today and devices require continued<br />
support through <strong>the</strong> research and<br />
development (R&D) stage. The primary<br />
gap today exists when devices are ready<br />
for open ocean deployment; at this<br />
point capital needs rise rapidly. Device<br />
developers are generally small and<br />
medium enterprises (SMEs) that do not<br />
have <strong>the</strong> financial backing to fund such<br />
projects, and <strong>the</strong> initial risk exposure<br />
is too high for utilities to commit<br />
investment or for any manufacturer to<br />
underwrite performance. Hence, capital<br />
support from government is required<br />
to de-risk investment in technology<br />
development and stimulate <strong>the</strong> private<br />
sector backing.<br />
RenewableUK believes that Stage<br />
1 of industry development can be split<br />
into three specific phases for technology<br />
development that can be related to <strong>the</strong><br />
NASA TRLs as follows:<br />
• Phase 1 - Concept Development and<br />
Tank Testing (TRL 1-3)<br />
• Phase 2 - Greater Scale Prototype<br />
(TRL 4-5)<br />
• Phase 3 - Full-Scale Grid Connected<br />
Prototype (TRL 6-7)<br />
2. First Wave and Tidal Farms -<br />
TRL 8-9 - 2-10MW<br />
When marine energy devices become<br />
ready for deployment in small arrays,<br />
revenue incentives play an important<br />
part in making <strong>the</strong> projects economically<br />
viable. However, electricity production<br />
from <strong>the</strong> first wave and tidal farms<br />
will be unpredictable, making revenue<br />
incentives alone insufficient. For <strong>the</strong>se<br />
first steps, upfront capital grant is<br />
also required to reduce <strong>the</strong> amount of<br />
capital at risk. Under this scenario, a<br />
marine energy project starts to become<br />
attractive to utilities. However, to<br />
secure investment from utilities, device<br />
offerings have to be on a par with<br />
alternative options. In particular, device<br />
manufacturers have to be able to offer<br />
potential utility investors (a) sufficient<br />
operating experience to offer guarantees<br />
in performance and reliability and (b)<br />
involvement of major manufacturers<br />
able to underpin <strong>the</strong>se guarantees both<br />
technically and financially.<br />
3. Second Farms and Beyond -<br />
TRL 8-9 - 10MW+<br />
Following <strong>the</strong>se initial small-scale<br />
projects, and with sufficient revenue<br />
support, it is likely that marine energy<br />
projects could start to move towards<br />
attracting debt finance, one of <strong>the</strong><br />
key requirements in facilitating rapid<br />
deployment at larger scales. In turn this<br />
will deliver associated cost reductions<br />
that would reduce <strong>the</strong> level of revenue<br />
support required.<br />
Over <strong>the</strong> past five years both <strong>the</strong><br />
UK industry and Government has<br />
taken strides to capitalise upon <strong>the</strong><br />
UK’s unique marine energy potential.<br />
However, even with this commitment it<br />
has already been suggested that greater<br />
Government support will be required<br />
to develop robust and affordable<br />
28, 29, 30<br />
technology.<br />
This report will aim to understand<br />
how <strong>the</strong> support framework outlined<br />
above could be established in <strong>the</strong> UK<br />
to deliver a world leading marine energy<br />
industry over <strong>the</strong> next five years. This<br />
will be achieved by ensuring lessons are<br />
learnt from <strong>the</strong> development of previous<br />
renewable energy industries (onshore<br />
wind), obtaining an understanding of<br />
<strong>the</strong> investor perspective, reviewing <strong>the</strong><br />
impact of government intervention to date<br />
and providing updated cost figures for<br />
technology development and deployment<br />
of <strong>the</strong> first marine energy arrays.<br />
28. Carbon Trust, 2009. Focus for success - A new approach to commercialising low carbon technologies.<br />
29.The Climate Change Commission, 2010. Building a Low Carbon Economy - The UK’s innovation Challenge.<br />
30. Bain and Company, October 2008. Employment Opportunities and Challenges in <strong>the</strong> Context of Rapid Industry Growth.
8<br />
3. Securing Economic Benefit<br />
from Renewable <strong>Energy</strong><br />
In developing a policy and financial framework to<br />
continue to support <strong>the</strong> UK marine energy industry<br />
it will be important to ensure lessons are learnt from<br />
previous renewable energy success stories to secure<br />
<strong>the</strong> greatest return on public investment.<br />
M<br />
Recent retrospective analysis of <strong>the</strong><br />
development of both <strong>the</strong> Danish and<br />
British onshore wind industries has<br />
identified that disparities in support<br />
mechanisms between <strong>the</strong> two countries<br />
was a key factor in determining <strong>the</strong><br />
variation in <strong>the</strong> present day market share<br />
and correlated economic benefit received<br />
31, 32<br />
from development of this industry.<br />
Development of Onshore Wind<br />
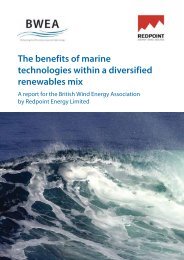
It is particularly interesting to review<br />
<strong>the</strong> total investment which <strong>the</strong> two<br />
Proportional Project<br />
Governments provided to support <strong>the</strong><br />
Costs (based on<br />
industries (Figure commercial 3.1). project Even though both<br />
with nominal size of<br />
Governments 30MW). invested similar sums of<br />
money into R&D activities, <strong>the</strong> Danish<br />
Domestic 2020<br />
Government awarded grants from 1976<br />
to 1981, 33 Domestic 2050<br />
five years earlier than those<br />
Export 2020<br />
which occurred in <strong>the</strong> UK, providing<br />
<strong>the</strong> Danes with Export an 2050 essential early mover<br />
advantage. This was swiftly followed<br />
by <strong>the</strong> establishment of premium<br />
revenue incentives 34 and a holistic policy<br />
package (Table 3.1).<br />
Since <strong>the</strong>se early initiatives, a total<br />
Grid Connection,<br />
Subsea &<br />
Onshore<br />
Infrastructure<br />
of 20 years consistent market and policy<br />
support have laid <strong>the</strong> foundation for a<br />
technological revolution that has resulted<br />
in a global export market worth over<br />
€5.7bn in 2008. With a 20% share of <strong>the</strong><br />
global wind turbine market, <strong>the</strong> Danish<br />
wind industry provides employment for<br />
28,000 workers and contributes €1.5bn<br />
in GVA to <strong>the</strong> Danish economy each<br />
35, 36<br />
year.<br />
Wind Industry Support (£ million)<br />
Figure 3.1 - Comparative Wind Industry<br />
Public Support made available in <strong>the</strong> UK<br />
and Denmark 37<br />
Wind Industry Public Support 1980–2000)<br />
900<br />
800<br />
700<br />
600<br />
500<br />
400<br />
300<br />
200<br />
100<br />
0<br />
Denmark<br />
R&D 122 141<br />
Capital Grants 31 0<br />
Production Incentives 615.4 240<br />
UK<br />
31. Aquamarine Power, 2010. Danish wind 1980-2010: lessons for <strong>the</strong> British marine energy industry.<br />
32. Garrad, A., 2011, Phil. Trans. R. Soc. A, in press.<br />
Figure 7<br />
33. Nielsen, K.H., 2002, Translating Wind Power Policies, PhD <strong>the</strong>sis, University of Aarhus, Denmark.<br />
34. Musgrove, P., 2009, Wind Power, Cambridge Press, ISBN: 9780521762380<br />
35. Ministry of Foreign Affairs of Denmark, 23rd March 2010. 120 Vestas Maintains its No. 1 Position in <strong>the</strong> Wind Turbine Market. http://www.investindk.com/visNyhed.<br />
Gap<br />
aspartikelID=23741 Viewed - 30/09/2010<br />
36. Denmark: Centre for Politiske Studier, 2009. Wind <strong>Energy</strong>: 100<br />
ETI<br />
The Case of Denmark. http://www.cepos.dk/fileadmin/user_upload/Arkiv/PDF/Wind_energy_-_<strong>the</strong>_case_<br />
of_Denmark.pdf Viewed - 5/10/2010<br />
SWRDA<br />
80<br />
37. Aquamarine Power, 2010. Danish wind 1980-2010: lessons for <strong>the</strong> British marine energy industry<br />
TSB Round 1<br />
£ million<br />
60<br />
TSB Round 2<br />
WATERS
9<br />
Table 3.1 - A comparison of <strong>the</strong> socioeconomic framework in which wind energy<br />
developed in Denmark and <strong>the</strong> UK between 1980 and 2000 38<br />
Political<br />
Denmark<br />
UK<br />
• £615m spent on production incentives • £240m spent from 1990-2000 NFFO.<br />
between 1980-2000.<br />
• £140m on R&D 1980-2000.<br />
• £122m on R&D 1980-2000.<br />
• 1989 Electricity Act privatised UK<br />
• Stable financial support for 20 years: 85% electricity generation. The Non Fossil Fuel<br />
of retail price and later, a premium of £30/ Obligation was intended to support <strong>the</strong><br />
MWh spurred domestic growth of wind nuclear industry but was later expanded to<br />
energy.<br />
include renewables.<br />
• Change of government in 2001 altered <strong>the</strong> • Policy during first decade (1980-1990)<br />
support scheme and as a result, stalled of wind energy was uncertain, NFFO<br />
domestic growth of wind energy. New contracts made electricity pricing highly<br />
support mechanisms vary according to competitive.<br />
size of turbine and hours of full production.<br />
Economic<br />
Denmark<br />
UK<br />
Danish agricultural sector was in decline.<br />
Companies such as Vestas, Bonus, Micon<br />
moved from traditional industries to a new<br />
energy industry.<br />
The UK government supported nuclear and<br />
had a strong offshore oil and gas industry.<br />
Wind energy was not a priority.<br />
Social<br />
Denmark<br />
UK<br />
Wind energy continues to achieve a<br />
• Widespread public objection to wind<br />
90% approval rating. Public support was turbines between 1990-1995 due to<br />
encouraged by allowing anyone within a developments in areas of high potential for<br />
prescribed vicinity of a wind farm to purchase conflict, and limited cooperation with local<br />
shares in <strong>the</strong> development. Structured financial communities.<br />
support favoured individuals over power<br />
companies. In 2002, 80% of <strong>the</strong> 6,300 wind<br />
turbines in Denmark were owned by wind<br />
energy cooperatives or individual farmers. 39<br />
Technical<br />
Denmark<br />
UK<br />
• Early R&D support defined three bladed • NFFO came too late for <strong>the</strong> UK<br />
turbines as <strong>the</strong> design of choice before manufacturers with only British Wind<br />
market pull techniques were employed. <strong>Energy</strong> Group (WEG) still active and due<br />
• Early support provided <strong>the</strong> industry with to <strong>the</strong> price pressures a lot of out of date<br />
a long term stable framework in which to Danish technology was installed because<br />
fur<strong>the</strong>r develop system reliability and gain it was cheaper than anything WEG could<br />
a lead over o<strong>the</strong>r nations.<br />
provide. Some WEG equipped farms were<br />
• Priority access to grid and infrastructure built but <strong>the</strong>y suffered failures.<br />
improvements streamlined additional • NEG Micon bought <strong>the</strong> British Wind <strong>Energy</strong><br />
capacity.<br />
Group in 1998 which effectively ended<br />
a domestic wind turbine manufacturing<br />
sector.<br />
Current status of <strong>Marine</strong><br />
<strong>Energy</strong> Industry<br />
What is clear from <strong>the</strong> onshore wind<br />
example is that a mixture of consistent<br />
financial and political drivers must be<br />
coordinated to successfully capitalise<br />
upon first mover advantage and secure<br />
long-term socio-economic benefit.<br />
Table 3.2 compares <strong>the</strong> progress to date<br />
that <strong>the</strong> UK and <strong>the</strong> USA have made<br />
in securing first mover advantage in<br />
establishing a marine energy industry.<br />
For <strong>the</strong> short term it is apparent<br />
<strong>the</strong> UK has established both political<br />
and financial support signals for<br />
development of a marine energy<br />
industry, yet lack of a clear and enduring<br />
vision means that <strong>the</strong> UK runs <strong>the</strong> risk<br />
of only securing minimum long term<br />
economic benefit. The USA by contrast<br />
has started to realign its energy priorities<br />
since <strong>the</strong> establishment of a new<br />
administration and is in <strong>the</strong> process of<br />
developing a long term holistic support<br />
plan for marine energy. A recent review<br />
of <strong>the</strong> sector also outlines that many<br />
o<strong>the</strong>r countries including <strong>Canada</strong>, Spain,<br />
Ireland and Portugal are in <strong>the</strong> advanced<br />
stages of developing favourable political<br />
and market support environments. 40<br />
The Carbon Trust suggests that<br />
one of <strong>the</strong> key actions for <strong>the</strong> UK to<br />
secure long term socio-economic<br />
benefits is to minimise costs of <strong>the</strong><br />
technology through innovation support,<br />
in coordination with developing a stable<br />
financial framework. 41<br />
38. Aquamarine Power, 2010. Danish wind 1980-2010: lessons for <strong>the</strong> British marine energy industry<br />
39. Krohn, S., 2002. Danish Wind Turbines: An Industrial Success Story. Danish Wind Turbine Industry Association.<br />
http://www.talentfactory.dk/media(483,1033)/Danish_Wind_Turbine_Industry,_an_industrial_succes_story.pdf Viewed - 30/09/2010<br />
40. Garrad Hassan America, Inc., 2009. Wave <strong>Energy</strong> Technology Review, Utility Market Initiative.<br />
41. Carbon Trust, 2009. Focus for success - A new approach to commercialising low carbon technologies.
10<br />
Key Lessons Learnt<br />
1. First and Next Generation Prototype -<br />
Whilst <strong>the</strong>re are analogies to be drawn TRL 1-7 - Up to 1MW<br />
with <strong>the</strong> manner in which public support • Leaving technology development<br />
aided development of <strong>the</strong> onshore wind entirely to a market route is likely to be<br />
industry, 42 RenewableUK believes that <strong>the</strong> slower than necessary for <strong>the</strong> UK to<br />
following factors will drive a different route to secure a significant market share.<br />
industry development for marine energy: • To drive knowledge transfer a<br />
mandate should be placed on<br />
1. Early wind turbine technology<br />
recipients of substantial sums from<br />
development could be made with a market stimulation programme or<br />
modest investment. In contrast <strong>the</strong> some o<strong>the</strong>r fiscal instrument to make<br />
existing wave and tidal energy devices generic scientific measurements and,<br />
deployed to date possess a rated as far as possible, to share those<br />
power output up to 30 times greater measurements within IP constraints.<br />
than <strong>the</strong> first prototype wind turbines<br />
from <strong>the</strong> 1970s and are aiming to 2. First Wave and Tidal farms -<br />
deploy in some of <strong>the</strong> worlds harshest TRL 8-9 - 2-10MW<br />
marine environments.<br />
• Incentives should be provided to<br />
encourage industrial investors to enter<br />
2. Consenting a small-scale wind turbine <strong>the</strong> sector. Such companies are able<br />
was relatively simple compared to to take <strong>the</strong> longer term view required<br />
<strong>the</strong> legislation that wave and tidal for marine energy technologies, and<br />
energy projects currently face from a will provide more effective support<br />
developing regulatory framework. than Venture Capital, which tends<br />
to require faster returns than marine<br />
3. Restricted grid access is already causing energy companies can provide.<br />
delays for marine energy projects. 43<br />
3. Second Farms and Beyond -<br />
With this in mind <strong>the</strong> key lessons <strong>the</strong> UK TRL 8-9 - 10MW+<br />
marine energy industry could learn from • Provided <strong>the</strong> technology can<br />
<strong>the</strong> development of onshore wind can be demonstrate success at <strong>the</strong> first farm<br />
summarised as: 44 stage, market incentives will generate<br />
a viable industry in due course, if<br />
<strong>the</strong>y are sufficiently generous and<br />
providing <strong>the</strong> technology is adequately<br />
supported initially until it can<br />
demonstrate success.<br />
• Early visualisation of a generous,<br />
consistent and long term supported<br />
market in <strong>the</strong> UK will be <strong>the</strong> single<br />
most powerful means of encouraging<br />
both a UK industry and a large UK<br />
installed capacity.<br />
42.Aquamarine Power, 2010. Danish wind 1980-2010: lessons for <strong>the</strong> British marine energy industry.<br />
43. RenewableUK, 2010. <strong>Marine</strong> Renewable <strong>Energy</strong> - State of <strong>the</strong> Industry 2010.<br />
44. Garrad, A., 2011, Phil. Trans. R. Soc. A, in press.
11<br />
Table 3.2 - A comparison of <strong>the</strong> socio-economic framework in which <strong>the</strong> current marine<br />
energy industry is developing in <strong>the</strong> UK and <strong>the</strong> USA<br />
Political<br />
UK<br />
USA<br />
• Revenue support administered through banded Renewable<br />
• Revenue support via renewable electricity production tax credit.<br />
51, 52<br />
Obligation Certificates (ROCs). Scotland currently offers <strong>the</strong> most This equates to $11/MWh.<br />
attractive support levels anywhere in <strong>the</strong> world. 45 Roughly equating • <strong>Marine</strong> Renewable <strong>Energy</strong> Promotion Act of 2009 - Requires <strong>the</strong><br />
to £170/MWh for tidal energy and £260MWh for wave energy. 46 Department of <strong>Energy</strong> (DOE) to establish a program of marine<br />
• £205m committed in R&D and infrastructure 2000-2010 47<br />
renewable energy research, separated from <strong>the</strong> Wind and<br />
• The Coalition Government have committed to “Introducing Measure Hydropower program. 53<br />
to Support <strong>Marine</strong> <strong>Energy</strong>”. 48<br />
• R&D spend increased significantly in 2008 and in 2010 $34m was<br />
• Decisions from <strong>the</strong> 2010 comprehensive spending review 49 and committed by <strong>the</strong> DOE.<br />
renewables obligation banding review 50 provide a key opportunity<br />
to establish a delivery plan and secure long term benefits.<br />
Economic<br />
UK<br />
USA<br />
• Government indicated intent to significantly cut future public • The USA is starting to deliver a clear policy to drive renewables<br />
spending. 54<br />
56, 57<br />
under <strong>the</strong> new administration.<br />
• Already established marine and offshore industry capable of • Existing manufacturing industry capable of securing economic<br />
adapting to secure significant section of value chain. 55<br />
benefit from developing <strong>the</strong> sector.<br />
Social<br />
UK<br />
USA<br />
• Early engagement, public meetings and consultation held in order to • Varying levels of coordination for marine planning and licensing. 59<br />
60, 61<br />
manage expectations.<br />
• In <strong>the</strong> process of streamlining federal and state licensing process.<br />
• Developing marine planning and licensing system and SEA planned<br />
for completion in 2011. 58<br />
Technical<br />
UK<br />
USA<br />
• World Leading testing facilities<br />
• Recently established National <strong>Marine</strong> Renewable <strong>Energy</strong> Centres. 63<br />
• No current drive toward consensus.<br />
• Coordinated Water Power Programme currently developing<br />
• Early support has failed to provide <strong>the</strong> industry with a long term multiyear program planning long term R&D priorities focused on<br />
stable framework in which to fur<strong>the</strong>r develop system reliability and gain driving consensus. 64<br />
a lead over o<strong>the</strong>r nations.<br />
• Poor grid access and high associated charges. 62<br />
45. http://www.scotland.gov.uk/Publications/2010/09/06152625/2 Viewed -<br />
13/10/2010<br />
46. Based on a ROC price plus Recycle of £45/MWh and LEC of £37.5/MWh<br />
47. RenewableUK, 2010. <strong>Marine</strong> Renewable <strong>Energy</strong> - State of <strong>the</strong> Industry 2010<br />
48. http://programmeforgovernment.hmg.gov.uk/files/2010/05/coalitionprogramme.pdf<br />
Viewed - 13/10/2010<br />
49. http://www.hm-treasury.gov.uk/d/spending_review_framework_080610.pdf<br />
Viewed - 13/10/2010<br />
50. http://www.decc.gov.uk/assets/decc/What%20we%20do/UK%20<br />
energy%20supply/<strong>Energy</strong>%20mix/Renewable%20energy/policy/renew_<br />
obs/1_20100331174250_e_@@_RObandingreviewprocess.pdf Viewed -<br />
13/10/2010<br />
51. http://www.irs.gov/pub/irs-pdf/f8835.pdf Viewed - 13/10/2010<br />
52. http://www.dsireusa.org/incentives/incentive.cfmIncentive_<br />
Code=US13F&State=US&ee=1&re=1 Viewed - 13/10/2010<br />
53. http://www.oregonwave.org/resources/legislation/ Viewed - 13/10/2010<br />
54. http://www.hm-treasury.gov.uk/d/press_04_10.pdf Viewed - 13/10/2010<br />
55. RenewableUK, 2010. Rebirth of UK Manufacturing: An Opportunity for a<br />
World-class Industry<br />
56. http://www.oregonwave.org/resources/legislation Viewed - 13/10/2010<br />
57. American Clean <strong>Energy</strong> and Security Act of 2009 (H.R. 2454).<br />
58. http://www.offshore-sea.org.uk/site/scripts/news_article.phpnewsID=42<br />
Viewed - 13/10/2010<br />
59. http://www.oregonwave.org/wp-content/uploads/Licensing-and-Permitting-<br />
Study.pdf Viewed - 13/10/2010<br />
60. http://www.acore.org/files/pdfs/Renewable_<strong>Energy</strong>_in_America_Aug2010.pdf<br />
Viewed - 13/10/2010<br />
61. http://www.boemre.gov/offshore/Renewable<strong>Energy</strong>/PDF/<br />
FinalRenewable<strong>Energy</strong>Rule.pdf Viewed - 13/10/2010<br />
62. RenewableUK, 2010. <strong>Marine</strong> Renewable <strong>Energy</strong> - State of <strong>the</strong> Industry 2010<br />
63. http://www1.eere.energy.gov/windandhydro/news_detail.htmlnews_<br />
id=16248 Viewed - 13/10/2010<br />
64. http://www1.eere.energy.gov/windandhydro/pdfs/48104.pdf Viewed -<br />
13/10/2010
12<br />
4. Private Sector Investor Perceptions of <strong>the</strong> UK<br />
<strong>Marine</strong> <strong>Energy</strong> Industry<br />
As suggested from <strong>the</strong> review of lessons to be learnt<br />
from <strong>the</strong> development of onshore wind, <strong>the</strong>re are<br />
two distinct communities with which <strong>the</strong> marine<br />
energy industry should engage to ensure continued<br />
financial support.<br />
Due to differing drivers for interest and<br />
investment, it has been suggested that<br />
engagement should be sought for <strong>the</strong><br />
following objectives:<br />
1. The investment community (‘angel’,<br />
venture capital, private equity)<br />
with sufficient capital should be<br />
encouraged to continue to support<br />
technology developers during <strong>the</strong>ir<br />
prototype development.<br />
2. Industrials (Utilities and Original<br />
Equipment Manufacturers) should<br />
be encouraged to continue to invest<br />
<strong>the</strong>ir capital and skills in <strong>the</strong> marine<br />
energy industry throughout <strong>the</strong> next<br />
phase of development, towards <strong>the</strong><br />
consolidation and growth of <strong>the</strong><br />
sector, in particular to fund initial array<br />
development. 65<br />
Perceptions of <strong>the</strong> UK <strong>Marine</strong><br />
<strong>Energy</strong> Industry from <strong>the</strong> Investment<br />
Community 66<br />
Research commissioned by <strong>the</strong><br />
Department of <strong>Energy</strong> and Climate<br />
Change to understand <strong>the</strong> appetite<br />
of <strong>the</strong> financial community toward<br />
marine energy resulted in 21 institutions<br />
taking part in interviews in January<br />
and February 2010. The sample<br />
consisted of Banks, Corporates, Venture<br />
Capitalists and Angel investors. Their<br />
key involvements and perceptions are<br />
summarised in Table 4.1<br />
Overall 16 organisations had a<br />
generally positive view of marine energy,<br />
stating that <strong>the</strong> UK has excellent marine<br />
resource, a unique opportunity for a<br />
market leading position, strong policy<br />
and early stage financial support from<br />
government.<br />
The overall negative perceptions<br />
focused upon issues relating to <strong>the</strong><br />
high demand for capital in technology<br />
development, <strong>the</strong> high costs of start-up<br />
to commercialisation and <strong>the</strong> lack of<br />
funding between research phase and<br />
full scale operation. One of <strong>the</strong> key<br />
conclusions which can be drawn from<br />
this survey is that whilst it is evident<br />
that <strong>the</strong>se institutions are watching <strong>the</strong><br />
sector, <strong>the</strong>re are key barriers which are<br />
preventing <strong>the</strong>m from investing with<br />
confidence.<br />
To try to understand what <strong>the</strong>se<br />
barriers are, interviewees were asked<br />
what would make investment attractive.<br />
The top three responses related to<br />
an enhanced, secure and long-term<br />
political and financial backing. Table 4.2<br />
provides a summary of <strong>the</strong>se responses.<br />
The interviews also highlighted key<br />
economic, political, technical and social<br />
critical showstoppers which can be<br />
viewed in table 4.3.<br />
From <strong>the</strong> responses provided it<br />
is evident that a combination of grant<br />
and revenue support with available grid<br />
access can help drive activity from <strong>the</strong><br />
investor community, whereas removal<br />
of <strong>the</strong>se incentives and potential<br />
environmental opposition are <strong>the</strong> critical<br />
show stoppers.<br />
It can be concluded that whilst<br />
<strong>the</strong>re are a number of investors<br />
interested in <strong>the</strong> sector, <strong>the</strong>ir key driver<br />
for investment is generally short-term<br />
financial return; an approach that does<br />
not match <strong>the</strong> long-term development<br />
needs of <strong>the</strong> industry that must be<br />
overcome if <strong>the</strong> industry is to succeed. 67<br />
65. DECC, 2010. <strong>Marine</strong> <strong>Energy</strong> Action Plan Executive Summary.<br />
66. Kreab Gavin Anderson, DECC Wave & Tidal Investor Perspective, 2010 - Presentation at RenewableUK Wave & Tidal 2010.<br />
67. Garrad, A., 2011, Phil. Trans. R. Soc. A, in press.
13<br />
Table 4.1 - Summary of Investment Community Views of <strong>Marine</strong> <strong>Energy</strong> Industry<br />
Banks<br />
Venture Capital<br />
Angel Investors<br />
• All are involved in renewable investment.<br />
• Most invest in proven technology and larger scale opportunities.<br />
• Sector currently viewed as small and fragmented.<br />
• Investment timescales do not match typical fund requirements.<br />
• Most are familiar with sector - and viewed it as exciting, promising or<br />
interesting.<br />
• The most concerning issues are: technology risk, no standout product,<br />
economic viability, market fragmentation, scalability and better<br />
investment opportunities elsewhere.<br />
• One actively investing in wave and tidal - o<strong>the</strong>rs less interested.<br />
• Wave is seen as potentially scalable, high risk but with high potential.<br />
• Tidal is seen as less risky - but may be effective in smaller-scale<br />
applications.<br />
Table 4.2 - Key enablers drive activity from <strong>the</strong> private sector investment community<br />
Ensure Targeted<br />
Funding<br />
Revenue Support<br />
Angel Investors<br />
• Funding for infrastructure support was suggested to focus on<br />
enhancing test sites.<br />
• Of 12 respondents 8 believe public sector support increases chances<br />
of fur<strong>the</strong>r investment.<br />
• Many considered that increased levels of funding delivered via a number<br />
of mechanisms including a dedicated <strong>Marine</strong> fund or Green bank is<br />
required to fill <strong>the</strong> early stage / VC gap and promote inward investment.<br />
• Majority supported a RO banding review with a need for increased RO<br />
banding levels in England and Wales.<br />
• A small minority suggested feed-in tariff for early stage deployment<br />
was more appropriate.<br />
• Ready grid connections and reduced Ofgem charges are needed.<br />
• Assistance with project permitting is needed.<br />
• The involvement of utilities and major industrials should be promoted.<br />
• More clarity around long term leases is needed.<br />
Table 4.3 - Issues Deemed to be Critical Showstoppers by <strong>the</strong> Private Sector Investment Community<br />
Political<br />
Economic<br />
Social<br />
Technical<br />
• Lack of funding.<br />
• Removal of ROC support.<br />
• Achieving competitive price for marine energy.<br />
• Highly capital intensive.<br />
• Low rates of return.<br />
• Experience of existing developers - costs exceeding expectations.<br />
• Environmental opposition.<br />
• Grid connections.<br />
• Proving consistent and reliable technology.
14<br />
Perceptions of <strong>the</strong> UK <strong>Marine</strong><br />
<strong>Energy</strong> Industry from <strong>the</strong> Industrial<br />
Community 68<br />
Kreab Gavin Anderson was<br />
commissioned by RenewableUK in July<br />
2010 to undertake a survey of utilities<br />
and original equipment manufacturers<br />
(OEMs) to understand <strong>the</strong>ir involvement<br />
in and attitudes towards <strong>the</strong> wave and<br />
tidal sector. A total of 19 interviews were<br />
held in August and September 2010.<br />
Respondents included <strong>the</strong> following<br />
OEMs and Utilities<br />
• OEMs - ABB, Fred Olsen, BAE<br />
Systems, Bosch Rexroth, Rolls-Royce,<br />
Siemens and Voith.<br />
Table 4.4 - Potential Barriers to Future Progress as Viewed by <strong>the</strong> Utility and OEM Community<br />
Political<br />
Economic<br />
Social<br />
Technical<br />
• Need for greater government clarity.<br />
• Sector underfunded - level of support / capital grants insufficient.<br />
• Confusion over ROCs discrepancies between wave and tidal, England,<br />
Wales & Scotland.<br />
• Relative costs compared to offshore wind.<br />
• Competition for internal resources.<br />
• High level of cost required for commercialisation.<br />
• Future cost of energy.<br />
• Need for costly and extensive environmental monitoring.<br />
• Need for improved communications between stakeholders<br />
• Poor grid access.<br />
• Lack of commercial industry participants, e.g. installers and EPC<br />
contractors.<br />
• Lack of Clarity on Technology risk, resulting from insufficient projects<br />
at scale and certainty of reliability.<br />
• Utilities - BP, Centrica, EDF, E.ON,<br />
EDP, ESBI, Fortum, International<br />
Power, RWE Npower <strong>Renewables</strong>,<br />
SSE <strong>Renewables</strong>, Scottish Power<br />
<strong>Renewables</strong> and Vattenfall.<br />
Current Involvement<br />
17 of <strong>the</strong> 19 organisations are actively<br />
involved in <strong>the</strong> sector, ei<strong>the</strong>r as investors<br />
or in an advisory capacity. The majority<br />
of respondents were generally positive<br />
about <strong>the</strong> potential future opportunities<br />
within <strong>the</strong> sector, although most believe<br />
that it will take years to achieve projects<br />
of commercial scale.<br />
“Our strategy for marine energy is<br />
more a feasibility project to see if<br />
<strong>the</strong>re is a business in developing<br />
tidal and wave Our strategy is to<br />
undertake demonstration projects and<br />
<strong>the</strong>n get an idea of what <strong>the</strong> costs,<br />
risks and difficulties are. Once we<br />
run a project we have a better view<br />
on whe<strong>the</strong>r we should have a much<br />
bigger involvement.”<br />
UTILITY<br />
Ten utilities have already committed<br />
funds to <strong>the</strong> sector - ei<strong>the</strong>r via direct<br />
investment in device developers and/or<br />
prototypes or pre-commercial projects<br />
- due both to <strong>the</strong> excellent UK resource<br />
and <strong>the</strong> potential for <strong>the</strong> industry to<br />
become globally relevant. O<strong>the</strong>rs are<br />
currently less active, due ei<strong>the</strong>r to limited<br />
internal resources, uncertainty about<br />
economic viability or <strong>the</strong> length of time<br />
needed for <strong>the</strong> industry to mature.<br />
“We as a utility are of course users<br />
of technology and not developers of<br />
technology ourselves. In this ocean<br />
area we are trying to follow <strong>the</strong><br />
market a bit sooner than wind.”<br />
UTILITY<br />
“There’s a Catch 22 here - <strong>the</strong> device<br />
companies struggle with levels<br />
of funding to get to a commercial<br />
solution - in rough terms £50-60m. As<br />
a consequence <strong>the</strong> utility companies<br />
are quite nervous and want someone<br />
like us, who is going to be around in<br />
20 years, to get involved.”<br />
OEM<br />
A wide range of issues were cited<br />
as being potential barriers to future<br />
progress. Answers were given<br />
spontaneously, and most were only<br />
mentioned by one or two participants<br />
(Table 4.4). However, three or more<br />
individuals cited <strong>the</strong>ir main concerns<br />
as being <strong>the</strong> lack of government<br />
clarity and consistency (particularly<br />
on support mechanisms), issues<br />
relating to technology and reliability,<br />
and <strong>the</strong> high level of funds required for<br />
commercialisation.<br />
68. Kreab Gavin Anderson for RenewableUK, 2010. <strong>Marine</strong> <strong>Energy</strong> - Utility & Supply Chain Survey.
15<br />
Inevitably, given <strong>the</strong> lack of specific<br />
information from <strong>the</strong> Government<br />
since <strong>the</strong> election, several participants<br />
expressed concern and confusion over<br />
<strong>the</strong> coalition Government’s level of<br />
support for <strong>the</strong> industry and <strong>the</strong> structure<br />
of financial incentives going forwards.<br />
“The main issue is <strong>the</strong> confusion over<br />
<strong>the</strong> Renewable Obligation Certificate<br />
(ROC) system and indecision over<br />
what is happening <strong>the</strong>re from a<br />
government perspective. Government<br />
needs to encourage <strong>the</strong> industry, not<br />
discourage it… potentially investors<br />
are hanging back because of <strong>the</strong><br />
uncertainties. There needs to be a<br />
long period for stable investment.”<br />
OEM<br />
Clearly, <strong>the</strong> risk profile of <strong>the</strong> industry<br />
and <strong>the</strong> high cost of development is<br />
a great concern to many participants.<br />
Uncertainty is also holding several<br />
market players back, with some<br />
preferring to observe <strong>the</strong> experiences<br />
and mistakes of o<strong>the</strong>rs before deciding<br />
on an appropriate course of action.<br />
“Grid access and expanding <strong>the</strong> grid<br />
is an issue - it takes time to plan for<br />
that - and <strong>the</strong>re are issues around <strong>the</strong><br />
strength of <strong>the</strong> grid in areas where<br />
resources are insufficient, because<br />
of <strong>the</strong> planning and consenting<br />
of electricity projects across <strong>the</strong><br />
country. It is holding us back.”<br />
UTILITY<br />
Pre-Commercial Activities<br />
Interviewees stated that <strong>the</strong>y are<br />
involved in a range of pre-commercial<br />
activities, extending from providing<br />
investment for prototype devices<br />
through to obtaining sites and putting<br />
in planning applications for arrays. The<br />
more advanced players are seeking<br />
to operate right across <strong>the</strong> chain of<br />
activities - from obtaining consents,<br />
to constructing and commissioning<br />
demonstration arrays. O<strong>the</strong>rs are<br />
looking at more specific activities, such<br />
as deploying <strong>the</strong>ir prototypes into <strong>the</strong><br />
water, proving <strong>the</strong> technology works,<br />
obtaining reliability data and generally<br />
de-risking projects. It is notable that all<br />
companies are keen to demonstrate<br />
longer term that <strong>the</strong> projects are cost<br />
effective and can create value.<br />
In terms of funding, all<br />
participating utilities are spending <strong>the</strong>ir<br />
own money and three OEMs are also<br />
doing so. Eight organisations have<br />
obtained or hope to receive grant<br />
funding, ei<strong>the</strong>r domestically (from <strong>the</strong><br />
TSB, <strong>the</strong> ETI, <strong>the</strong> MRPF and/or Scottish<br />
WATERS) or from Europe (both at <strong>the</strong><br />
EU and regional level). None of <strong>the</strong><br />
respondents mentioned commercial<br />
bank funding or project financing, both<br />
being premature, although one utility<br />
mentioned that funding was available<br />
from development banks.<br />
Through a number of <strong>the</strong><br />
interviews it was apparent that some<br />
of <strong>the</strong> utility companies are starting to<br />
appreciate <strong>the</strong> large amount of money<br />
and o<strong>the</strong>r resources <strong>the</strong>y will have to<br />
spend in order to get to <strong>the</strong> point where<br />
<strong>the</strong>y can actually make money from <strong>the</strong><br />
wave and tidal sector.<br />
Methods of Funding<br />
Respondents were asked about <strong>the</strong><br />
different potential types of funding<br />
at different stages of technology<br />
development. 11 respondents<br />
spontaneously said that grant funding is<br />
most appropriate for <strong>the</strong> current stage<br />
of <strong>the</strong> industry’s evolution (First and<br />
Next Generation Prototype - TRL 1-7<br />
- Up to 1MW). Equity co-investment<br />
was mentioned by three participants as<br />
being useful, with funding from <strong>the</strong> ETI,<br />
TSB, Carbon Trust and MRPF is all felt<br />
to be extremely helpful.<br />
Seven individuals spontaneously<br />
went on to comment on <strong>the</strong> importance<br />
of a stable long term revenue support<br />
system going forwards, with <strong>the</strong> majority<br />
supporting <strong>the</strong> ROC regime (although<br />
<strong>the</strong>re is an obvious desire to achieve<br />
alignment between technologies and<br />
territories) and some favouring a feed-in<br />
tariff for early stages of deployment<br />
(First Wave and Tidal Farms).<br />
“For us we believe in multi-ROCS.<br />
Once you get to an array-sized<br />
project, ROCs do what we need<br />
<strong>the</strong>m to do for us to invest. We know<br />
ROCs, we understand <strong>the</strong>m, <strong>the</strong>y are<br />
sufficient for us… <strong>the</strong>y’re enough to<br />
make us take <strong>the</strong> investment decision<br />
to go forward.”<br />
Utility<br />
Respondents were generally provided<br />
lukewarm responses to <strong>the</strong> suggestion<br />
of loan guarantees (only four mentioned<br />
<strong>the</strong>m, all negatively) and tax credits<br />
were not particularly favoured, due in<br />
part to being perceived as less enduring<br />
than <strong>the</strong> <strong>Renewables</strong> Obligation (RO).<br />
There appeared to be no appetite<br />
for mezzanine financing, which was<br />
viewed as too expensive, or for capital<br />
guarantees.
16<br />
Due to <strong>the</strong> evolving nature of <strong>the</strong> wave<br />
and tidal industry, and <strong>the</strong> fact that it<br />
is still essentially at <strong>the</strong> first and next<br />
generation prototype stage TRL 1-7 -<br />
Up to 1MW, <strong>the</strong>re was relatively little<br />
discussion about commercial bank<br />
funding. The consensus focused around<br />
<strong>the</strong> fact that technologies are still being<br />
tested so more traditional forms of bank<br />
lending simply are not an option because<br />
<strong>the</strong> lenders generally do not yet have a<br />
sufficient level of comfort about <strong>the</strong> ability<br />
of companies to be able to repay <strong>the</strong><br />
money in <strong>the</strong> future. Three respondents<br />
expressed a concern about <strong>the</strong> apparent<br />
funding gap between early stage<br />
development and commercialisation.<br />
Finally, one utility made a request for<br />
ei<strong>the</strong>r DECC or RenewableUK to assist <strong>the</strong><br />
industry in producing a guide to finding<br />
sources of finance.<br />
“I would almost describe it as a taper.<br />
At <strong>the</strong> early stages of R&D, it’s very<br />
much grant, up-front capital funding<br />
for projects because you know that<br />
<strong>the</strong>re’s going to be no revenue. As <strong>the</strong><br />
sector moves to commercialisation<br />
you can probably shift to 100%<br />
revenue support. Once things have<br />
commercialised, investors will take a risk<br />
on <strong>the</strong> capital on <strong>the</strong> basis that you can<br />
get revenue support for <strong>the</strong> project.”<br />
UTILITY<br />
First Wave and Tidal Farms -<br />
TRL 8-9 - 2-10MW<br />
When asked a more specific question<br />
about funding for first wave and tidal<br />
farms, 14 individuals answered <strong>the</strong><br />
question and all responses were<br />
spontaneous. Nine supported grant<br />
funding and six mentioned equity<br />
investment as being useful. Four<br />
expressed support for a combination of<br />
grant funding at <strong>the</strong> outset followed by<br />
revenue support as projects move into<br />
<strong>the</strong> commercial stage. Again, <strong>the</strong> issue<br />
of equality of Renewable Obligation<br />
Certificate (ROC) regimes across <strong>the</strong> UK<br />
was mentioned.<br />
Loans were felt to be<br />
inappropriate, as were mezzanine<br />
finance and capital guarantees. As for<br />
tax credits, <strong>the</strong> general view was that<br />
<strong>the</strong>se would only benefit <strong>the</strong> major<br />
players. Two individuals added that<br />
one of <strong>the</strong> roles of <strong>the</strong> proposed Green<br />
Investment Bank could be to streamline<br />
or coordinate methods of funding.<br />
“For pre-commercial arrays we believe<br />
that post-construction incentives<br />
are necessary but not sufficient as<br />
<strong>the</strong>y do not contribute to getting <strong>the</strong><br />
arrays installed and commissioned to<br />
begin with or address <strong>the</strong> availability/<br />
performance uncertainty required to<br />
support loans and de-risk revenue NPV.<br />
They should <strong>the</strong>refore be supplemented<br />
with pre-construction incentives. There<br />
are several advantages including a<br />
greater potential capital contribution<br />
from government / The Crown Estate<br />
co-investor as <strong>the</strong>y can share in<br />
revenue as opposed to simply writing<br />
off a cash injection.”<br />
UTILITY<br />
Respondents were asked what o<strong>the</strong>r<br />
features of funding were important. A<br />
significant number of participants (12)<br />
took <strong>the</strong> opportunity to mention <strong>the</strong><br />
disparity between <strong>the</strong> ROC regimes in<br />
Scotland versus England and Wales.<br />
The o<strong>the</strong>r issue of major significance<br />
(mentioned spontaneously by 10<br />
respondents) is <strong>the</strong> requirement for<br />
clarity on future revenue support<br />
mechanisms and consistency of <strong>the</strong><br />
messages from Government. As one<br />
respondent said, “political certainty<br />
means funding certainty.”<br />
Investment Timetable, ROI and<br />
Features of a Successful Global<br />
<strong>Marine</strong> Industry<br />
Respondents were asked about <strong>the</strong>ir<br />
investment timetable and how long <strong>the</strong>y<br />
would be prepared to commit to <strong>the</strong><br />
sector before expecting to see a return<br />
on investment. None of <strong>the</strong> respondents<br />
who answered this question expect to<br />
make a return within <strong>the</strong> next five years<br />
as <strong>the</strong>re is an expectation that returns<br />
will take between five and ten years.<br />
“This industry has to come out<br />
of <strong>the</strong> embryonic stage to <strong>the</strong><br />
commercialisation stage within five<br />
years, o<strong>the</strong>rwise investors will say<br />
<strong>the</strong>y have to go elsewhere. The reality<br />
is it will take longer if we do not get<br />
<strong>the</strong> impetus. If you want to accelerate<br />
this thing it has got to have <strong>the</strong><br />
financial climate to be able to drive<br />
investment, and that has to be over a<br />
five year cycle.”<br />
OEM<br />
Most participating utilities and some<br />
OEMs take a flexible approach at this<br />
stage. Those who are most active<br />
believe <strong>the</strong>ir development spend can<br />
be contained and do not view <strong>the</strong> initial<br />
costs as too onerous yet. However,<br />
for some, <strong>the</strong> level of spend is only<br />
acceptable as long as progress can be<br />
seen to be made. A smaller number of<br />
participants expressed some doubt that<br />
<strong>the</strong> level of returns would be acceptable<br />
or commercial projects achievable.<br />
Those individuals who commented<br />
on <strong>the</strong> longer term would expect<br />
commercial projects to generate a return<br />
over 20-30 years. As <strong>the</strong> risks diminish<br />
and costs reduce, so would <strong>the</strong> targeted<br />
returns. At <strong>the</strong> commercialisation stage<br />
all participants will take a harder view on<br />
<strong>the</strong>ir return on investment.<br />
To continue investment<br />
respondents felt that a successful global<br />
marine energy industry would contain<br />
<strong>the</strong> following elements:<br />
• The active involvement of industry<br />
majors able to offer commercial<br />
contracts with warranties and<br />
performance guarantees and<br />
increase reliability and durability (12<br />
respondents)<br />
• A healthy supply chain (5)<br />
• A sizeable number of megawatts<br />
installed (4). Target numbers ranged<br />
from 10-20 GW in <strong>the</strong> UK, to 50 GW<br />
installed globally by 2030.<br />
• Industry consolidation resulting in a<br />
smaller number of mature technologies<br />
appropriate for a variety of locations<br />
(8). 4-5 devices per category is felt to<br />
be <strong>the</strong> optimum number, as this would
17<br />
focus available capital but at <strong>the</strong> same<br />
time help maintain a competitive<br />
environment.<br />
• Comparative levels of competitiveness<br />
with o<strong>the</strong>r renewable technologies,<br />
particularly offshore wind (4)<br />
Government Non-Fiscal Measures<br />
and Industry Action for Encouraging<br />
Private Investment<br />
Respondents were asked what nonfiscal<br />
measures <strong>the</strong> Government could<br />
provide to increase private investment.<br />
In <strong>the</strong> context of <strong>the</strong> key political,<br />
social and technical drivers considered<br />
in Chapter 2, respondents answers<br />
focused upon <strong>the</strong> technical, providing<br />
improved grid connectivity and reduced<br />
transmission charging (13 respondents),<br />
and <strong>the</strong> social - arranging a fast,<br />
transparent consenting and licensing<br />
process (12)<br />
“Government can assist in a number<br />
of ways, primary among which is <strong>the</strong><br />
accelerated establishment of <strong>Marine</strong><br />
<strong>Energy</strong> Parks. As with National<br />
Parks, which are set up to promote<br />
heritage objectives and regulate o<strong>the</strong>r<br />
developments which impact on <strong>the</strong>se<br />
objectives, we believe that geographic<br />
areas should be set aside as <strong>Marine</strong><br />
<strong>Energy</strong> Parks within which marine<br />
energy objectives are set and o<strong>the</strong>r<br />
developments/activities are regulated<br />
to minimise <strong>the</strong> adverse impact on<br />
<strong>the</strong> development of marine energy.”<br />
UTILITY<br />
Finally, respondents were asked<br />
what <strong>the</strong> industry could be doing<br />
to encourage more active private<br />
investment. The most important action<br />
was thought to be increasing <strong>the</strong> level<br />
of transparency amongst developers<br />
with realistic expectations, credible<br />
testing and operations reporting (10<br />
respondents). Two fur<strong>the</strong>r key actions<br />
focused around <strong>the</strong> involvement of<br />
large industrial players (3) and industry<br />
collaboration (3). These suggestions<br />
are in line with <strong>the</strong> priorities outlined<br />
in points 4 and 5 of <strong>the</strong> key lessons<br />
learnt from <strong>the</strong> onshore wind industry<br />
highlighted in Chapter 2.<br />
“We would be a supporter of<br />
standards, for instance looking at<br />
how you measure <strong>the</strong> performance<br />
of devices… There are far too many<br />
technologies out <strong>the</strong>re and <strong>the</strong>y need<br />
to come toge<strong>the</strong>r. There is not enough<br />
finance for everyone.”<br />
UTILITY<br />
“Be united. The industry is confused,<br />
investors are confused. Government<br />
representatives are confused simply<br />
because each developer presents<br />
<strong>the</strong>ir own story as <strong>the</strong> solution.<br />
RenewableUK is doing a good job<br />
here - it’s a very good start and I<br />
admire <strong>the</strong>ir efforts. They need to...<br />
help unite <strong>the</strong> industry.”<br />
OEM<br />
Conclusions<br />
From reviewing <strong>the</strong> activities and<br />
perceptions of private sector investors it<br />
is apparent that many of <strong>the</strong> views and<br />
opinions echo <strong>the</strong> suggested lessons<br />
which should be learnt by <strong>the</strong> marine<br />
energy industry from <strong>the</strong> development<br />
of <strong>the</strong> onshore wind industry. These<br />
suggestions could be translated into<br />
specific actions for <strong>the</strong> three stages of<br />
industry development as follows:<br />
1. First and Next Generation Prototype -<br />
TRL1-7 - Up to 1MW<br />
• Policy certainty results in investment<br />
and <strong>the</strong> coalition government should<br />
identify and clearly articulate how <strong>the</strong>y<br />
will support <strong>the</strong> sector.<br />
• Capital grants are deemed to be <strong>the</strong><br />
most effective way in which to offer<br />
pre-commercial technology support.<br />
• Technology developers need to be<br />
more open with information and share<br />
<strong>the</strong>ir learning experiences.<br />
2. First Wave and Tidal farms -<br />
TRL 8-9 - 2-10MW<br />
• A combination of grant and revenue<br />
funding will be required to attract<br />
industrial investors who are able to<br />
take a long term engineering and<br />
investment perspective.<br />
3. Second Farms and Beyond -<br />
TRL 8-9 - 10MW+<br />
• Increased stable revenue support<br />
should be established on a unified<br />
basis across <strong>the</strong> UK as soon as<br />
possible to ensure continued<br />
investment.
18<br />
5. Costs for Developing <strong>Marine</strong> Technology<br />
The previous sections have discussed how<br />
Government intervention can impact development<br />
and reviewed <strong>the</strong> perspectives of private investors<br />
toward <strong>the</strong> UK marine energy industry.<br />
To fur<strong>the</strong>r aid <strong>the</strong> development of a<br />
coherent policy and financial support<br />
framework <strong>the</strong> following section will<br />
examine <strong>the</strong> effectiveness of government<br />
funding to date and present evidence on<br />
<strong>the</strong> cost of technology development for<br />
<strong>the</strong> three stages of industry development<br />
Figure 5.1 - Cost of Stage 1 Industry development, taking a technology from test tank to<br />
first full-scale grid-connected prototypes. The ranges apply to <strong>the</strong> overall cost of each<br />
stage and represent <strong>the</strong> full ranges quoted by <strong>the</strong> developers. Beneath each bar is <strong>the</strong><br />
upport 1980–2000) Figure 4<br />
ratio of public to private money.<br />
mark<br />
First and Next Generation Prototype -<br />
TRL1-7 - Up to 1MW<br />
<strong>Marine</strong> energy is still an immature<br />
technology at a pre-commercial stage<br />
of development, with efforts to date<br />
concentrating on <strong>the</strong> demonstration of<br />
UK<br />
first generation full-scale grid-connected<br />
prototypes.<br />
To understand <strong>the</strong> estimated cost<br />
of developing and proving marine energy<br />
devices RenewableUK undertook a<br />
survey of technology companies active<br />
in <strong>the</strong> UK. 69 Figure 5.1 depicts <strong>the</strong><br />
average costs of developing technology<br />
from test tank through to first full-scale<br />
grid-connected prototype. As stated in<br />
Chapter 2, RenewableUK believes that<br />
Gap<br />
Stage 1 of industry development (First<br />
ETI<br />
and Next Generation Prototype) can be<br />
divided into three specific SWRDA phases for<br />
technology development.<br />
TSB Round<br />
In relation<br />
1<br />
to NASA technology readiness levels<br />
as follows: 70<br />
TSB Round 2<br />
122 141<br />
31 0<br />
5.4 240<br />
• Phase 1 - Concept Development and<br />
Tank testing (TRL 1-3)<br />
• Phase 2 - Greater-Scale Prototype<br />
(TRL 4-5)<br />
70<br />
• Phase 3 - Full-Scale Estimated Grid-Connected<br />
Prototype<br />
60<br />
Private<br />
(TRL 6-7)<br />
7 Figure 8<br />
WATERS<br />
£ million<br />
30<br />
25<br />
20<br />
15<br />
10<br />
5<br />
0<br />
50<br />
Private<br />
Overseas Public<br />
UK Public<br />
Phase 1<br />
1:2<br />
Whilst we expect <strong>the</strong> cost of energy<br />
40<br />
to decrease dramatically as installed<br />
capacity increase, 30 it is also evident that<br />
<strong>the</strong> costs of developing and proving<br />
£ million<br />
20<br />
Overseas Public<br />
UK Public<br />
Phase 2<br />
1:3<br />
Phase 3<br />
1:2<br />
technology are high. The data collected<br />
by RenewableUK suggests that a total<br />
average investment of £30 million will<br />
be required to take a technology from<br />
concept through to construction and<br />
installation of <strong>the</strong> first full-scale gridconnected<br />
prototype. 71 This assumes<br />
that technology development is<br />
sequential and that <strong>the</strong>re is limited<br />
need for development iterations during<br />
this process.<br />
ocation<br />
69. Contributors included - Aquamarine MRPF Power, Pulse Tidal, <strong>Marine</strong> Current 10 Turbines, Pelamis Wave Power, Minesto, Atlantis Resource Corporation and Voith Hydro.<br />
70. NASA, 2010. http://esto.nasa.gov/files/TRL_definitions.pdf Viewed - 15/10/2010<br />
Allocated<br />
0<br />
71. N.B. Cost estimates do not take into account additional company overheads Phase (e.g. staff 1 and Phase rates) 2 and are based Phase on deploying 3 First only 5 one MW demonstration First 10 MW per phase.<br />
(TRL 1-3) (TRL 4-5)<br />
(TRL 6-7)<br />
1:2<br />
1:3<br />
1:2<br />
TRL 1-7 Gap<br />
Stage 1 - First and Next Generation<br />
Prototype - TRL 1-7<br />
Stage 2 - First Wave and<br />
Tidal Farms (TRL 8-9)
Project Management/Development<br />
R&D and engineering design studies<br />
Device structure & Components -manufacture & construction<br />
Grid Connection, Subsea and Onshore Infrastructure<br />
Installation<br />
O&M<br />
19<br />
Members of RenewableUK also<br />
provided data relating to <strong>the</strong> sources of<br />
investment, <strong>the</strong> aggregated proportional<br />
split for each phase of development can<br />
been seen in Figure 5.3. Angel funding<br />
does not exist for any Phase 3 projects<br />
and private venture capital continually<br />
decreases, whereas <strong>the</strong> proportion<br />
of industry funds and grants increase<br />
during <strong>the</strong> later stages of development.<br />
This supports <strong>the</strong> assumptions made in<br />
Chapter 2 and <strong>the</strong> responses from <strong>the</strong><br />
private sector investors in Chapter 3,<br />
which concluded that industrial investors<br />
are required to deliver technologies<br />
at scale and that capital grants can<br />
stimulate <strong>the</strong>ir involvement.<br />
Whilst <strong>the</strong> UK has invested<br />
relatively significant sums on<br />
infrastructure and test centres, relatively<br />
limited amounts have actually been<br />
spent on device R&D to date, with <strong>the</strong><br />
funds allocated O<strong>the</strong>r in <strong>the</strong> last year being<br />
Revenue support<br />
broadly equivalent to that spent in <strong>the</strong><br />
Angel Investor<br />
last decade. Private Industrial<br />
Initial work Private reviewing Venture Capital <strong>the</strong> delivery<br />
Public Venture Capital<br />
of a long term marine energy financial<br />
Grants<br />
support framework highlighted three<br />
funding gaps in <strong>the</strong> UK’s existing<br />
support framework, which correlate<br />
to <strong>the</strong> stages of industry development<br />
outlined in Chapter 2 (Figure 5.4). 72<br />
Since <strong>the</strong> publication of <strong>the</strong> work<br />
from Figure 5.4, <strong>the</strong> UK and devolved<br />
Phase 3<br />
Governments have committed an<br />
estimated £51m in Stage 1 of industry<br />
74, 75, 76, 77, 78<br />
development (Figure 5.5).<br />
Project Management/Development<br />
R&D and engineering design studies<br />
Device structure & Components -manufacture & construction<br />
Grid Connection, Subsea and Onshore Infrastructure<br />
Installation<br />
O&M<br />
Figure 5.3 - Sources of funding for marine technology development<br />
Figure 52<br />
100%<br />
90% 60<br />
80%<br />
50<br />
70%<br />
40<br />
60%<br />
% Market Share<br />
£ million<br />
50% 30<br />
40%<br />
20<br />
30%<br />
10<br />
20%<br />
10% 0<br />
0%<br />
2,500<br />
2,000<br />
1,500<br />
1,000<br />
500<br />
-<br />
R&D, Manufacturing Project O&M Grid Connection,<br />
Engineering<br />
Management,<br />
Subsea &<br />
& Design Phase 1 Development<br />
Phase 2 Phase Onshore 3<br />
& Installation<br />
Infrastructure<br />
Funding gap<br />
Available finance<br />
Stage 1 - First and Next<br />
Generation Prototype<br />
TRL 1-7<br />
Figure 6<br />
O<strong>the</strong>r<br />
Revenue Proportional support Project<br />
Angel<br />
Costs<br />
Investor<br />
(based on<br />
commercial project<br />
Private<br />
with<br />
Industrial<br />
nominal size of<br />
Private 30MW). Venture Capital<br />
Public Venture Capital<br />
Grants<br />
Domestic 2020<br />
Domestic 2050<br />
Export 2020<br />
Export 2050<br />
Figure 5.4 –Cumulative support required for <strong>the</strong> UK to reach early deployment. 73<br />
Stage 2 - First Wave and<br />
Tidal Farms<br />
TRL 8-9<br />
Stage 3 - Second Farms<br />
and Beyond<br />
TRL 8-9<br />
Total<br />
72. Carbon Trust, 2009. Focus for success - A new approach to commercialising low carbon technologies.<br />
73. Carbon Trust, 2009. Focus for success - A new approach to commercialising low carbon technologies. P 75. Investment analysis assumes process of selection<br />
which starts with 21 devices in <strong>the</strong> development phase (Stage 1), 13 of which make it to <strong>the</strong> demonstration phase (Stage 2), <strong>the</strong>n 11 devices enter MRDF (at 10MW<br />
scale) operating for five years of which 9 devices go on to operate post-MRDF (at 20MW scale) for a fur<strong>the</strong>r 10 years (Stage 3) - giving total operating capacity at<br />
this stage of 180MW.<br />
74. <strong>Marine</strong> <strong>Renewables</strong> Proving Fund (£22m) - http://www.carbontrust.co.uk/emerging-technologies/current-focus-areas/marine-renewables-proving-fund/pages/<br />
default.aspx Viewed - 15/10/2010<br />
75. Scottish Enterprise - Wave and Tidal <strong>Energy</strong>: Research, Development and Demonstration Support fund (£13m) - http://www.scottish-enterprise.com/your-sector/<br />
energy/energy-support/energy-funding/energy-grants/Wave-and-Tidal-<strong>Energy</strong>-Fund.aspx Viewed - 15/10/2010<br />
76. Technology Strategy Board (Round 1 £7m allocated and Round 2 £3m) - http://www.innovateuk.org/content/competition/wave-and-tidal-stream-energytechnologies-reducing.ashx<br />
https://ktn.innovateuk.org/web/wave-and-tidal/articles/-/blogs/1430493;jsessionid=06156D025B2104F9BB4FA97C135722E5.9OphE<br />
wv4 Viewed - 15/10/2010<br />
77. South West Regional Development Agency (£1.5m) - http://www.press.southwestrda.org.uk/2010/07/29/minister-announces-fur<strong>the</strong>r-investment-in-marinerenewables-during-wave-hub-visit/<br />
Viewed - 15/10/2010<br />
78. <strong>Energy</strong> Technology Institute (public proportion £4.6m) - http://www.energytechnologies.co.uk/Home/Technology-Programmes/marine.aspx Viewed - 15/10/2010
20<br />
Proportional Project<br />
Costs (based on<br />
commercial project<br />
with nominal size of<br />
30MW).<br />
Domestic 2020<br />
Domestic 2050<br />
Export 2020<br />
Export 2050<br />
Wind Industry Support (£ milli<br />
900<br />
800<br />
700<br />
600<br />
500<br />
400<br />
300<br />
200<br />
100<br />
0<br />
Denmark<br />
UK<br />
O&M<br />
Grid Connection,<br />
Subsea &<br />
Onshore<br />
Infrastructure<br />
R&D 122 141<br />
Capital Grants 31 0<br />
Production Incentives 615.4 240<br />
This has resulted in at least 21<br />
new projects being initiated, with<br />
collaborations between technology<br />
developers, world leading academic<br />
institutions, utilities and a number of<br />
OEMs.<br />
upport 1980–2000) Figure 5.5 - Investment made into Figure Stage 4 1 of industry development by central and<br />
devolved UK governments 2009 - 2010 Figure 7<br />
ark<br />
First Wave and Tidal Farm -<br />
TRL8-9 - 2-10MW<br />
Once technology developers have<br />
proven a device at full scale in open<br />
sea environment, <strong>the</strong> next stage of<br />
UK<br />
development is <strong>the</strong> deployment of <strong>the</strong><br />
first marine energy arrays. 79 The cost<br />
for <strong>the</strong>se projects, in comparison to<br />
Stage 3 - Second Farms Total<br />
<strong>the</strong> deployment and Beyond of single devices, is an<br />
TRL 8-9<br />
order of magnitude higher. An estimated<br />
£432m funding gap has previously<br />
been highlighted (Figure 5.4: Stage 2 -<br />
First Wave and Tidal Farms - TRL 8-9<br />
-2-10MW), 80 this figure is derived from<br />
development of 11 projects at 10MW per<br />
project with revenue support Gap of 2 ROCs/<br />
MWh and allocation of <strong>the</strong> existing £42m<br />
ETI<br />
<strong>Marine</strong> <strong>Renewables</strong> Deployment Fund<br />
SWRDA<br />
(MRDF).<br />
The costs of a marine TSB Round energy 1<br />
array can be broken down TSB Round into 2 cash<br />
flow deriving from capital expenditure,<br />
WATERS<br />
revenue and operation and maintenance.<br />
MRPF<br />
Currently in England, Wales and<br />
Nor<strong>the</strong>rn Ireland wave Allocated and tidal energy<br />
projects receive revenue support of 2<br />
ROCs/MWh. In Scotland <strong>the</strong> revenue<br />
support TRL 1-7 Gap is 3 ROCs/MWh for tidal and 5<br />
ROCs/MWh for wave.<br />
To understand <strong>the</strong> estimated<br />
Capex and Net Present Value of<br />
developing and operating <strong>the</strong> first wave<br />
and tidal farms, RenewableUK surveyed<br />
six utilities active in <strong>the</strong> marine energy<br />
sector. 81 The results outlined in Figure<br />
5.6 show how <strong>the</strong> estimated Capex ifor<br />
stage 2 of industry development ranges<br />
from £39m for a 5MW project to £58m<br />
for a 10MW project.<br />
22 141<br />
31 0<br />
Wave and<br />
5.4 ms<br />
240<br />
9<br />
£ £ million million<br />
120<br />
100<br />
80<br />
60<br />
40<br />
20<br />
0<br />
Phase 1<br />
Phase 2<br />
1:2<br />
1:3<br />
TRL 1-7 TRL 1-7 Recent Allocation TRL 1-7 Gap<br />
7 Figure 5.6 - Estimated Capex for First Wave Figure and 8Tidal Farms.<br />
cation<br />
£ million<br />
30<br />
25<br />
20<br />
15<br />
10<br />
5<br />
0<br />
70<br />
60<br />
50<br />
40<br />
30<br />
20<br />
10<br />
0<br />
Private<br />
Overseas Public<br />
UK Public<br />
Estimated<br />
Private<br />
Phase 1<br />
(TRL 1-3)<br />
1:2<br />
Overseas Public<br />
UK Public<br />
Phase 2<br />
(TRL 4-5)<br />
1:3<br />
Stage 1 - First and Next Generation<br />
Prototype - TRL 1-7<br />
The survey of <strong>the</strong> utilities also included<br />
analysis of NPV versus <strong>the</strong> level of<br />
ROC support. This was done using a<br />
harmonised methodology across all six<br />
utilities. Table 5.1 (Wave) and Table 5.2<br />
(Tidal) outline <strong>the</strong> results. 82<br />
Phase 3<br />
(TRL 6-7)<br />
1:2<br />
First 5 MW<br />
Phase 3<br />
1:2<br />
Gap<br />
ETI<br />
SWRDA<br />
TSB Round 1<br />
TSB Round 2<br />
WATERS<br />
MRPF<br />
First 10 MW<br />
Stage 2 - First Wave and<br />
Tidal Farms (TRL 8-9)<br />
Allocated<br />
From this analysis it is apparent that<br />
if <strong>the</strong> levels of banding in England<br />
and Wales were to remain at 2 ROCs,<br />
<strong>the</strong> level of capital required to make<br />
up <strong>the</strong> short fall for <strong>the</strong> first wave<br />
and tidal farms is between £27m and<br />
£43m. By contrast a wave energy<br />
project in Scotland will require capital<br />
support in <strong>the</strong> region of £15m and<br />
£23m in order to break even.<br />
79. Hydraulics and Maritime Research Centre, University College Cork, 2003. Ocean <strong>Energy</strong> Development and Evaluation Protocol.<br />
80. Carbon Trust, 2009. Focus for success - A new approach to commercialising low carbon technologies.<br />
81. Contributors included: SSE <strong>Renewables</strong>, Scottish Power <strong>Renewables</strong>, International Power <strong>Marine</strong> Developments, E.ON, RWE Npower <strong>Renewables</strong> and EDF*<br />
82. Revenue is derived from sale of electricity via a PPA, ROC prices, ROC buy back and LEC.
21<br />
Table 5.1 - Net Present Value of a 5MW and<br />
a 10MW wave project receiving varying<br />
levels of ROC support.<br />
Revenue support NPV 5MW NPV 10MW<br />
2 ROCS -£28m -£43m<br />
3 ROCS -£24m -£36m<br />
4 ROCS -£20m -£29m<br />
5 ROCS -£15m -£23m<br />
Table 5.2 - Net Present Value of a 5MW<br />
and a 10MW tidal project receiving varying<br />
levels of ROC support.<br />
Revenue support NPV 5MW NPV 10MW<br />
2 ROCS -£27m -£41m<br />
3 ROCS -£23m -£34m<br />
4 ROCS -£18m -£28m<br />
5 ROCS -£14m -£21m<br />
These figures are based on <strong>the</strong> following<br />
assumptions which were derived via<br />
industry consultation and consensus:<br />
• 10MW sites<br />
• Based on an average of estimates<br />
supplied by industry members of<br />
Capex and Opex for a 10MW project:<br />
- Wave Capex is approximately £54m<br />
(Range £42m - £82m) and Opex<br />
is estimated at £2.2m/y (Range<br />
£0.9m/y - £4.2m/y). 84<br />
- Tidal Capex is approximately £54m<br />
(Range £43m - £84m) and Opex is<br />
estimated at £1.9m/y (Range £1.2<br />
m/y - £2.2 m/y). 85<br />
• In order to take into account<br />
economies of scale 5MW figures are<br />
based on dividing 10MW figures by a<br />
factor of 1.5.<br />
• A two year development cycle with a<br />
spend profile of 30% Capex in year<br />
-2 and 70% of Capex in year -1 of<br />
first power.<br />
• 25 year project life with<br />
decommissioning <strong>the</strong>reafter.<br />
• Calculations are based on notional<br />
locations in UK waters.<br />
• Discount rate of 15%.<br />
• Industry-estimated approximate<br />
capacity factor used is 30% - (Ranges;<br />
Wave 30 - 35% / Tidal 26 - 35%).<br />
• ROCs are assumed to be worth £45/<br />
MWh with recycle.<br />
• Base electricity including LECs is<br />
worth £37.5/MWh.<br />
• Tax is excluded, and income and<br />
costs are assumed to change similarly<br />
with inflation.<br />
These assumptions are consistent with<br />
o<strong>the</strong>r analyses in previous RenewableUK<br />
reports and <strong>the</strong> model was truth tested<br />
against RenewableUK’s best estimates<br />
for costs of offshore wind. It must be<br />
emphasised that a first farm at 5-10MW is<br />
still at <strong>the</strong> demonstration level and is not<br />
expected to be commercially viable at <strong>the</strong><br />
present stage of industry development.<br />
Second Farms and Beyond -<br />
TRL8-9 - 10MW+<br />
As globally installed capacity increases,<br />
costs can be expected to reduce.<br />
Previous reports have concluded that<br />
each doubling of capacity will result<br />
in a reduction of cost of 10% to 15%.<br />
Provided that development is continuous<br />
and uninterrupted, it is expected that<br />
a cost of energy of between £75/<br />
MWh and £125/MWh can be reached<br />
when 1GW has been installed globally<br />
per technology. This is deemed to be<br />
competitive with o<strong>the</strong>r forms of future<br />
86, 87, 88, 89<br />
low carbon energy generation.<br />
<strong>Marine</strong> and offshore experience<br />
gained from working in <strong>the</strong> oil and<br />
gas industries within <strong>the</strong> UK can be<br />
applied and transferred to <strong>the</strong> marine<br />
industry to promote <strong>the</strong> reduction of<br />
costs, improve energy capture and<br />
increase <strong>the</strong> knowledge base. However,<br />
if <strong>the</strong> industry were to find itself in a<br />
development hiatus this learning effect<br />
could be reversed as <strong>the</strong> industry begins<br />
to ‘forget’. It is essential <strong>the</strong>refore that<br />
industry momentum is maintained.<br />
84. The cost range presented reflects <strong>the</strong> variety of devices currently under development, each with its own optimal performance and cost characteristics. For example,<br />
some devices are optimised for high capital cost and high capacity factor, whereas o<strong>the</strong>rs are <strong>the</strong> opposite. Also some devices are optimised for low Capex but<br />
higher Opex, whereas o<strong>the</strong>rs have high Capex with low Opex. This diversity is to be expected and is an indicator of healthy competition to identify <strong>the</strong> overall<br />
optimum configurations.<br />
85. IBID.<br />
86. Carbon Trust, January 2006. Future <strong>Marine</strong> <strong>Energy</strong>. Results of <strong>the</strong> <strong>Marine</strong> <strong>Energy</strong> Challenge: Cost Competitiveness and Growth of Wave and Tidal Stream <strong>Energy</strong>.<br />
87. Ernst & Young, April 2007. Impact of Banding <strong>the</strong> <strong>Renewables</strong> Obligation - Costs of Electricity Production.<br />
88. RenewableUK, 2010. <strong>Marine</strong> Renewable <strong>Energy</strong> - State of <strong>the</strong> Industry 2010<br />
89. <strong>Energy</strong> technology Institute and UK <strong>Energy</strong> Research Centre, 2010. <strong>Marine</strong> <strong>Energy</strong> Technology Roadmap
22<br />
6. Measures to Support <strong>Marine</strong> <strong>Energy</strong><br />
A generous, supported market in <strong>the</strong> UK will be <strong>the</strong><br />
single most powerful means of encouraging both<br />
a UK industry and a large UK installed capacity.<br />
From <strong>the</strong> data presented in Chapter 5 it<br />
is apparent that <strong>the</strong> costs of developing<br />
marine energy technology are high. Yet<br />
encouragement can be drawn from <strong>the</strong><br />
fact that <strong>the</strong> results of Chapter 4 and<br />
<strong>the</strong> key lessons to be learnt highlighted<br />
in Chapter 3 suggest that <strong>the</strong> correct<br />
private sector investors are engaged.<br />
The UK now has a five year window in<br />
which to capitalise upon its established<br />
first mover advantage.<br />
During <strong>the</strong> period of 2009 to 2010<br />
a number of strategic industry and<br />
government marine energy coordination<br />
reports were published. These documents<br />
have already started to outline what<br />
may be required to deliver a clear and<br />
consistent political and financial support<br />
platform. 90, 91 The key areas of consensus<br />
lie around following points:<br />
• Ensuring <strong>the</strong> provision of targeted<br />
funding that bridges <strong>the</strong> technology<br />
market gaps in a coordinated manner<br />
from <strong>the</strong> various UK funding bodies,<br />
UK government and devolved<br />
administrations.<br />
• Confirmation of long term revenue<br />
support which is set at a level which<br />
provides a strong financial signal<br />
to <strong>the</strong> private sector to invest in<br />
marine energy.<br />
The coalition government has clearly<br />
stated that it will introduce “measures to<br />
support marine energy”. 92 This chapter<br />
will explore options and make suggestions<br />
for delivering a support framework<br />
that will allow marine energy projects<br />
to reach a point by which <strong>the</strong>y are<br />
sustainable on revenue support alone.<br />
The key measures to support <strong>the</strong><br />
three stages of industry development<br />
are considered in turn:<br />
1 - First and Next Generation<br />
Prototype - TRL 1-7 - Up to 1MW<br />
Leaving technology development<br />
entirely to a market route is likely to be<br />
slower than necessary for <strong>the</strong> UK to<br />
secure a significant market share.<br />
In <strong>the</strong> 2010 <strong>Marine</strong> Renewable<br />
<strong>Energy</strong> State of <strong>the</strong> Industry Report, 93<br />
RenewableUK highlighted two reasons<br />
as to why developers have not been<br />
able to access <strong>the</strong> MRDF to date: firstly<br />
that many developers cannot obtain<br />
<strong>the</strong> funding required to install <strong>the</strong> first<br />
full-scale device and secondly that<br />
marine energy device development is<br />
challenging, takes a significant period of<br />
time and does not allow <strong>the</strong> opportunity<br />
to prove performance onshore before<br />
going offshore.<br />
The focused funding provided to<br />
industry over <strong>the</strong> past year has started<br />
to tackle <strong>the</strong> issue of deploying full<br />
scale prototypes and has been strongly<br />
welcomed. It is expected that a number<br />
of devices will advance to <strong>the</strong> full scale<br />
array stage within <strong>the</strong> next three years.<br />
To continue to address <strong>the</strong> issues being<br />
faced by development challenges,<br />
RenewableUK believes that <strong>the</strong><br />
Government needs to maintain this<br />
support to industry through <strong>the</strong> crucial<br />
early years. The TSB call launched<br />
in September 2010, focusing upon<br />
verifying performance; improving<br />
reliability in a real environment; and<br />
developing installation, operation<br />
and maintenance methodologies, is a<br />
good example and will go some way to<br />
potentially addressing <strong>the</strong>se issues.<br />
One of <strong>the</strong> key reasons for <strong>the</strong> success of<br />
<strong>the</strong> funding allocated over <strong>the</strong> past year<br />
has been communication between funding<br />
bodies and improved consultation with<br />
industry. Currently however, <strong>the</strong>re are no<br />
clear indications that future funding will<br />
be made available, creating <strong>the</strong> risk that<br />
90. DECC, 2010. <strong>Marine</strong> <strong>Energy</strong> action Plan Executive Summary.<br />
91. <strong>Marine</strong> <strong>Energy</strong> Group, Forum for Renewable <strong>Energy</strong> Development Scotland, 2009. <strong>Marine</strong> <strong>Energy</strong> Road Map.<br />
92. http://programmeforgovernment.hmg.gov.uk/files/2010/05/coalition-programme.pdf Viewed - 13/10/2010<br />
93. RenewableUK, 2010. <strong>Marine</strong> Renewable <strong>Energy</strong> - State of <strong>the</strong> Industry 2010
23<br />
technology and IP may become stranded,<br />
with potentially leading technologies<br />
being unable to attract <strong>the</strong> private finance<br />
required to proceed at industrial scale.<br />
One of <strong>the</strong> key conclusions from<br />
Chapter 3 notes that - To drive knowledge<br />
transfer a mandate should be placed on<br />
recipients of substantial sums from a<br />
market stimulation programme or some<br />
o<strong>the</strong>r fiscal instrument to make generic<br />
scientific measurements and, as far as<br />
possible, to share those measurements<br />
within IP constraints - and this should<br />
also be borne in mind when allocating<br />
future funding.<br />
Recommendations<br />
Recent funding schemes have<br />
been highly effective but need to be<br />
continued over a number of years to<br />
bring technology to <strong>the</strong> point where <strong>the</strong><br />
industry can move on to <strong>the</strong> first arrays.<br />
During <strong>the</strong> next comprehensive<br />
spending review period government<br />
must ensure <strong>the</strong> delivery of targeted<br />
funding that continues to bridge<br />
<strong>the</strong> technology market gaps in a<br />
coordinated manner from <strong>the</strong> varying<br />
UK funding bodies, departments and<br />
devolved administrations.<br />
2 - First Wave and Tidal Farms -<br />
TRL 8-9 - 2-10MW<br />
Incentives should be provided to<br />
encourage industrial investors to enter<br />
<strong>the</strong> sector. Such companies are able<br />
to take <strong>the</strong> longer term view required<br />
for marine power technologies, and will<br />
provide more effective support than<br />
Venture Capital, which tends to require<br />
faster returns than marine energy<br />
companies can provide.<br />
The <strong>Marine</strong> <strong>Renewables</strong> Deployment<br />
Fund (MRDF) was established by <strong>the</strong><br />
UK Government in 2004 to support<br />
<strong>the</strong> first arrays of devices operating at<br />
sea. £42m of <strong>the</strong> £50m fund provides a<br />
combination of capital grant and revenue<br />
support for devices. This is limited to<br />
a £9m cap per technology/project of<br />
which a maximum of £5m can apply as<br />
a capital grant based on 25% of eligible<br />
capital costs with <strong>the</strong> remainder being<br />
able to be applied as a revenue top up<br />
over seven years operation. As a result,<br />
from <strong>the</strong> project owners’ perspective to:<br />
a) obtain <strong>the</strong> maximum revenue support<br />
a project would need to be no more<br />
than 2-3MW in scale; however to<br />
b) achieve maximum capital support <strong>the</strong><br />
project would need to cost >£30m.<br />
In practice since <strong>the</strong>se requirements<br />
are mutually exclusive, <strong>the</strong> actual level<br />
of support given to a project over <strong>the</strong><br />
seven years of MRDF support would be<br />
much lower than <strong>the</strong> current £9m cap,<br />
meaning that <strong>the</strong> £42m of MRDF as<br />
currently structured would be unlikely to<br />
be fully deployed.<br />
Based on <strong>the</strong> analysis in Chapter<br />
5, table 6.1 outlines <strong>the</strong> estimated<br />
shortfall industry would incur from three<br />
scenarios of development. Justification<br />
of <strong>the</strong>se scenarios is as follows:<br />
• MRDF Scenario (Four 5MW projects) -<br />
Based upon <strong>the</strong> maximum number of<br />
projects <strong>the</strong> MRDF would be able to<br />
support at £9m per project.<br />
• <strong>Marine</strong> <strong>Renewables</strong> Proving Fund<br />
(MRPF) Scenario (Six 10MW projects)<br />
- Based upon developing <strong>the</strong> six<br />
technologies which government has<br />
supported to full scale prototype stage<br />
via <strong>the</strong> MRPF.<br />
• Carbon Trust Scenario (Eleven<br />
Revenue<br />
Support Level<br />
MRDF Scenario<br />
(Four 5MW projects)<br />
10MW projects) - Based upon <strong>the</strong><br />
eleven 10MW projects <strong>the</strong> Carbon Trust<br />
estimate will be required for <strong>the</strong> UK to<br />
secure a significant future market share<br />
of <strong>the</strong> industry.<br />
As Government has already<br />
committed to developing 6 full scale<br />
prototypes via <strong>the</strong> MRPF, RenewableUK<br />
recommends that at minimum funds<br />
should put in place to support <strong>the</strong>se<br />
devices deploy initial arrays and<br />
advance through Stage 2 of industry<br />
development. Failure to do so would<br />
result in UK investment benefiting<br />
foreign industry development.<br />
It is evident from all of <strong>the</strong><br />
scenarios in Table 6.1 if high levels of<br />
revenue support are not provided to<br />
support initial marine energy projects,<br />
<strong>the</strong> level of capital grant required to<br />
make up <strong>the</strong> shortfall will potentially<br />
double to a level which may be prohibitive<br />
for private investment to overcome.<br />
One of <strong>the</strong> key recommendations<br />
from <strong>the</strong> MEAP was to retain <strong>the</strong> current<br />
UK-wide MRDF mechanisms or to<br />
instigate a similar instrument and to<br />
extend its operation to cover new devices<br />
reaching demonstration stage in <strong>the</strong><br />
period 2011-2014. This was also stated<br />
in <strong>the</strong> UK Renewable <strong>Energy</strong> Strategy<br />
published in July 2009 and is an action<br />
which RenewableUK strongly supports. 94<br />
RenewableUK also welcomes<br />
Scottish government’s recent statement<br />
in <strong>the</strong>ir <strong>Renewables</strong> Obligation<br />
consultation document that <strong>the</strong>y are<br />
minded to allow <strong>the</strong> provision of capital<br />
grants in combination with banded<br />
Table 6.1 - Estimated short fall (net present value) incurred in developing five 5MW marine<br />
energy arrays at varying levels of revenue support.<br />
MRPF Scenario<br />
(Six 10MW Projects)<br />
2 ROCs -£111m -£251m -£459m<br />
3 ROCs -£94m -£211m -£386m<br />
4 ROCs -£76m -£171m -£313m<br />
5 ROCs -£58m -£131m -£240m<br />
Carbon Trust Scenario<br />
(Eleven 10MW Projects)<br />
94. DECC, 2010. The UK Renewable <strong>Energy</strong> Strategy, ISBN: 9780101768627. P 143<br />
95. The Scottish Government, 2010. Changes to <strong>the</strong> <strong>Renewables</strong> Obligation (Scotland) Order 2010: Statutory Consultation http://www.scotland.gov.uk/<br />
Publications/2010/09/06152625/2 Viewed - 15/10/2010
24<br />
ROC’s for marine energy. 95<br />
In order to have maximum impact on<br />
industry development, a change to make<br />
MRDF support capital only and banding<br />
of <strong>the</strong> RO to 5 ROCs for wave and tidal<br />
technologies across <strong>the</strong> UK, have been<br />
suggested as necessary reforms that<br />
would transform <strong>the</strong> scheme.<br />
An additional alternative option<br />
would be to raise <strong>the</strong> small-scale FiT to<br />
10MW for a limited number of marine<br />
energy arrays. The level of FiT support<br />
required to assist with such deployments<br />
would need to be significant in order<br />
to mitigate <strong>the</strong> high risk and costs<br />
associated with deploying such a small<br />
array in <strong>the</strong> offshore environment. This<br />
would also have to be coupled with a<br />
capital grant mechanism.<br />
Recommendations<br />
UK and Scottish Government<br />
should work towards providing a<br />
complementary combined grant<br />
and revenue package to incentivise<br />
utilities and OEMs to invest in and<br />
deliver <strong>the</strong> world’s first marine energy<br />
arrays in <strong>the</strong> next three to five years.<br />
Capital funding of £251m is <strong>the</strong><br />
minimum amount required to support<br />
this first build, which will halve to<br />
roughly £131m if revenue support<br />
is provided at a level of 5 ROCs, <strong>the</strong><br />
revenue portion of this support could<br />
alternatively be provided by an interim<br />
FiT.<br />
The capital funding could be<br />
potentially sourced from <strong>the</strong> SRO<br />
£186m fund, <strong>the</strong> MRDF £42m and EU<br />
funds (e.g. NER 300).<br />
3 - Second Farms and Beyond – TRL<br />
8-9 – 10MW+<br />
Incentives alone based on energy<br />
produced, provided <strong>the</strong>y are sufficiently<br />
generous, will provide a viable industry<br />
in due course<br />
<strong>the</strong>m economically viable and to build<br />
<strong>the</strong> UK marine energy industry. This<br />
support level can <strong>the</strong>n be reduced in<br />
line with increased installed capacity<br />
and as <strong>the</strong> industry learns and becomes<br />
more efficient. 96 This should not be seen<br />
as a long term enduring support level,<br />
ra<strong>the</strong>r an enhancement reflecting <strong>the</strong><br />
initial cost of bringing novel technology<br />
to market. In time, <strong>the</strong> need for support<br />
would be expected to decline in line with<br />
enhancements in project economics.<br />
Even if increased interim FiT<br />
measures were introduced for projects<br />
under 10 MW, <strong>the</strong> long term certainty<br />
that an increased revenue incentive at<br />
a level of 5 ROCs is still required for<br />
project over 10 MW and needs to be<br />
confirmed as soon as possible to drive<br />
continued utility and OEM investment in<br />
current projects.<br />
Recommendations<br />
Scottish and UK Government must<br />
provide sufficient, stable and level<br />
revenue support at a level of 5 ROCs<br />
for both wave and tidal technologies<br />
to ensure continued interest from<br />
Utilities and OEMs and until <strong>the</strong><br />
industry has matured.<br />
The above recommendations provide<br />
a coherent support framework<br />
that should be executed in a<br />
coordinated approach. RenewableUK<br />
recommends that to achieve<br />
coordination and ensure as many as<br />
19,500 direct jobs and a GVA in <strong>the</strong><br />
region of £800m per is secured by<br />
<strong>the</strong> UK in 2035. The UK Government<br />
and <strong>the</strong> sector should investigate and<br />
implement, a mechanism or forum<br />
to continue to develop a long-term<br />
strategy and delivery processes for<br />
<strong>the</strong> UK marine energy industry.<br />
It is apparent that initially marine energy<br />
projects will need at least 5 ROCs for<br />
both wave and tidal technology to make<br />
96. RenewableUK, 2010. <strong>Marine</strong> Renewable <strong>Energy</strong> - State of <strong>the</strong> Industry 2010
RenewableUK<br />
Greencoat House, Francis DStreet<br />
London SW1P 1DH, United Kingdom<br />
Tel: +44 (0)20 7901 3000<br />
Fax: +44 (0)20 7901 3001<br />
Web: www.renewable-uk.com<br />
Email: info@renewable-uk.com