Energy from Waves and Tidal Currents - Marine Renewables Canada
Energy from Waves and Tidal Currents - Marine Renewables Canada
Energy from Waves and Tidal Currents - Marine Renewables Canada
- No tags were found...

You also want an ePaper? Increase the reach of your titles
YUMPU automatically turns print PDFs into web optimized ePapers that Google loves.
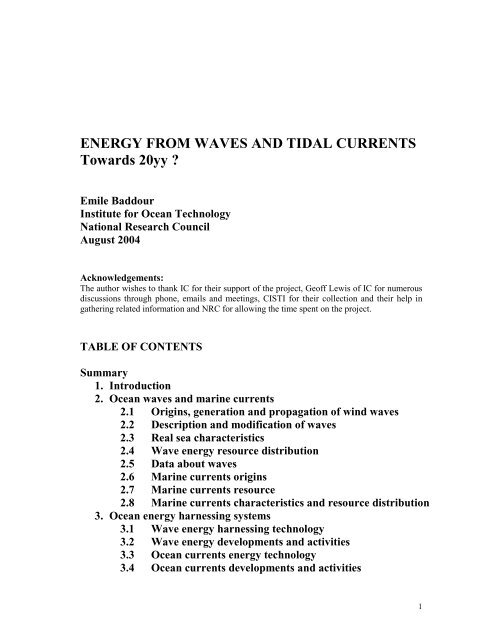
ENERGY FROM WAVES AND TIDAL CURRENTSTowards 20yy ?Emile BaddourInstitute for Ocean TechnologyNational Research CouncilAugust 2004Acknowledgements:The author wishes to thank IC for their support of the project, Geoff Lewis of IC for numerousdiscussions through phone, emails <strong>and</strong> meetings, CISTI for their collection <strong>and</strong> their help ingathering related information <strong>and</strong> NRC for allowing the time spent on the project.TABLE OF CONTENTSSummary1. Introduction2. Ocean waves <strong>and</strong> marine currents2.1 Origins, generation <strong>and</strong> propagation of wind waves2.2 Description <strong>and</strong> modification of waves2.3 Real sea characteristics2.4 Wave energy resource distribution2.5 Data about waves2.6 <strong>Marine</strong> currents origins2.7 <strong>Marine</strong> currents resource2.8 <strong>Marine</strong> currents characteristics <strong>and</strong> resource distribution3. Ocean energy harnessing systems3.1 Wave energy harnessing technology3.2 Wave energy developments <strong>and</strong> activities3.3 Ocean currents energy technology3.4 Ocean currents developments <strong>and</strong> activities1
4. Transfer of power systems4.1 Interfaces4.2 Storage of energy4.3 Electric power generation <strong>and</strong> conversion4.4 Power transmission to the grid5. Ocean power economics5.1 Factors affecting the evaluation of costs5.2 Capital <strong>and</strong> Operating costs of Ocean <strong>Energy</strong> systems5.3 Generation costs of wave <strong>and</strong> current energy5.4 Comparison with costs of other renewables <strong>and</strong> electricpower prices6. R&D programmes6.1 In <strong>Canada</strong>7. Timeline proposal7.1 Ocean energy influential events7.2 Timeline7.3 Scientific, technical, societal <strong>and</strong> economic challenges7.4 Constraints <strong>and</strong> opportunities8. References9. Recent scientific <strong>and</strong> technical research bibliographyAppendices:Appendix 1. Formulation <strong>and</strong> computation of wave power in longcrestedregular <strong>and</strong> irregular seasAppendix 2: Useful wave & tidal power/energy linksAppendix 3: Recent publications <strong>from</strong> IOT2
Summary:Renewable energy sources have been known for centuries. It is only recently in the past30 years that modern technology <strong>and</strong> investment got together to produce viablealternatives to fossil fuel that can produce energy on a useful, economical scale. Thestimulus to develop renewables is being driven by several factors. It is found that fossilfuels are causing global warming <strong>and</strong> there is pressure to reduce the amount of carbondioxide produced in energy production. There is prospect of rising pricing of oil <strong>and</strong>gas as well as depletion of the reserves <strong>and</strong> relying on importing fuel. Now formally onaccepting the Kyoto protocol <strong>Canada</strong> has committed towards reducing gas emitions thatcause house effects.In its Millennium Statement, "<strong>Energy</strong> for Tomorrow’s World – Acting Now!", thereport of the World <strong>Energy</strong> Council, presents three principles for energy development:Accessibilityis the provision of reliable, affordable modern energy services.Availabilityaddresses the quality <strong>and</strong> reliability of the service.Acceptabilityaddresses environmental goals <strong>and</strong> public attitudes, specifically local pollution <strong>and</strong>global climate change.These principles are underpinned by ten policy actions which include: keeping allenergy options open <strong>and</strong> ensuring adequate <strong>and</strong> appropriate research funding. (World<strong>Energy</strong> Council, 2000)Keeping with the recommendation of keeping all energy options open, the presentdocument reports on <strong>Energy</strong> <strong>from</strong> the Ocean. To put this energy source in perspectivewe have to note that presently this new renewable is part of the Other sources makingthe 0.5% of the World Total Primary <strong>Energy</strong> Supply. See Figure 1.1 below.This report presents an overview of the main developments in ocean energy <strong>from</strong>waves <strong>and</strong> currents <strong>and</strong> could be considered as an introduction to the topic of Ocean<strong>Energy</strong> Systems, specifically <strong>from</strong> ocean waves <strong>and</strong> currents. Limited time <strong>and</strong> notbeing in the scope of this review precluded verification of some of the claims herein,using different or independent sources <strong>from</strong> the ones reported. However, it can indicatethe trend. Further development <strong>and</strong> assessment of the resource are needed. The reportconcludes with a list of tasks classified under 6 main possible threads for an action planfor research <strong>and</strong> development in ocean energy systems <strong>and</strong> a proposal to identify theInstitute of Ocean Technology of the National Research Council, http://iot-ito.nrccnrc.gc.ca/about.htmlas the Center for Testing, Evaluation, <strong>and</strong> Research in Ocean<strong>Energy</strong> Systems. The center is proposed as a node within an Ocean <strong>Energy</strong> TechnologyNetwork that would allow Industry, Academia <strong>and</strong> Government a much-neededcollaboration within their identified respective roles.3
ever closer to commercial utilization. A number of commercial plants are being built inEurope, Australia <strong>and</strong> elsewhere. A number of devices have proven their applicabilityon a large scale in harsh operational environments <strong>and</strong> other are in different stages oftheir Research <strong>and</strong> Development cycle with different levels of their implementation.These will be reported herein. From studying the experts reports it is concluded thatextensive R&D work is needed at both fundamental <strong>and</strong> application levels with theobjective of improving the cost estimation, performance, feasibility of ocean energysystems to establish their position in the renewable energy market.The societal, political, industry <strong>and</strong> academic sectors are converging towards a need<strong>and</strong> dem<strong>and</strong> for more "green", renewable energy. This trend is clearly seen in the Kyotoagreement <strong>and</strong> expressed in action plans in Europe, <strong>Canada</strong>, USA <strong>and</strong> other parts of theworld. The following excerpt <strong>from</strong> of the Speech <strong>from</strong> the Throne in BC speaks foritself:Speech <strong>from</strong> the Throne, The Honourable Iona Campagnolo, Lieutenant Governor at the Opening of the FifthSession, Thirty-Seventh Parliament of the Province of British Columbia, February 10, 2004
non-commercial energy <strong>and</strong> covers all major renewable energy resources. Combustiblerenewables <strong>and</strong> waste account for nearly 80% of the renewables share, hydro for 16.5%<strong>and</strong> "new" renewables: geothermal, solar, tidal, wave, wind <strong>and</strong> other, together accountfor 0.5%. See Figure 1.1 below.Figure 1.1 Fuels Shares of World Total Primary <strong>Energy</strong> Supply (source: IEA, 2002)The domination of the energy supply by fossil fuels is set to continue for aforeseeable future, since their resource base remains adequate <strong>and</strong> the adverseenvironmental impacts are attracting a considerable effort to identify <strong>and</strong> deploycleaner fossil fuel technologies, an area in which World <strong>Energy</strong> Council (WEC) hasbeen active for several years.In its Millennium Statement, "<strong>Energy</strong> for Tomorrow’s World – Acting Now!", thereport of the World <strong>Energy</strong> Council, presents three principles for energy development:Accessibilityis the provision of reliable, affordable modern energy services for which payment ismade under policy specifically targeted on meeting the needs of the poor.Availabilityaddresses the quality <strong>and</strong> reliability of the serviceAcceptabilityaddresses environmental goals <strong>and</strong> public attitudes, specifically local pollution <strong>and</strong>global climate change.These principles are underpinned by ten policy actions which include keeping allenergy options open <strong>and</strong> ensuring adequate <strong>and</strong> appropriate research funding. (World<strong>Energy</strong> Council, 2000). See also International <strong>Energy</strong> Agency, Ocean <strong>Energy</strong> SystemsAnnual Report (2003).Keeping with the recommendation of keeping all energy options open, the presentdocument reports on <strong>Energy</strong> <strong>from</strong> the Ocean. To put this energy source in perspective6
we note that this new renewable is part of the Other sources making the 0.5% of all therenewables, See Figure 1.1.2 Ocean waves <strong>and</strong> marine currents2.1 Origins <strong>and</strong> generation of wind waves2.2 Wave energy resource distribution2.3 Description <strong>and</strong> modification of waves2.4 Real sea characteristics2.5 Data about waves2.6 <strong>Marine</strong> currents origins2.7 <strong>Marine</strong> currents resource2.8 <strong>Marine</strong> currents characteristics <strong>and</strong> resource distribution2.1 Origins <strong>and</strong> generation of wind wavesThere are many kinds of waves in the ocean. They differ in form, velocity <strong>and</strong>origin. Some waves are too long <strong>and</strong> low to see, also there exist waves that travel ondensity interfaces below the sea surface. <strong>Waves</strong> may be generated by ships orl<strong>and</strong>slides or the passage of the moon or by earthquakes or changes in the atmosphericpressure. The waves which are of interest in this report are those mainly raised by thewinds.The energy in the waves comes <strong>from</strong> the sun through the winds as they blow over theoceans due to the differential heating of the earth. The winds transfer their energy to thesurface of the sea creating waves. See Kinsman (1984). Wave energy is henceconsidered as a concentrated form of solar energy. The mechanism of the transfer ofenergy <strong>from</strong> the atmosphere to the surface of the sea is complex. The main phenomenacan be reduced to:Air flowing over the free surface of the water activates a tangential stress on thewater surface <strong>and</strong> result in the formation <strong>and</strong> growth of the waves.Variable shear stresses <strong>and</strong> pressure fluctuations are created by turbulent air flowing onthe sea surface. Further wave increase <strong>and</strong> development happens when theseoscillations <strong>and</strong> fluctuations are in phase with the waves. Some kind of resonanceeffect.Wave reaching a certain height will be directly affected by the wind forcing on theupwind face of the wave causing further growth. At each of the above steps energy intransferred to the water. The amount of energy transferred <strong>and</strong> hence the size of theresulting waves is a function of the wind speed, the length of time it blows <strong>and</strong> thedistance over which it blows called the fetch.As the wave continues to grow the surface facing the wind becomes higher <strong>and</strong>steeper <strong>and</strong> the process of wave building becomes more efficient. However up to apoint because there is a limit on how steep a wave can be. Steepness is the ratio of theheight of the wave (distance between a crest <strong>and</strong> the following trough) to its length7
(distance between a crest <strong>and</strong> the following one) is approximately 1:7 in deep water. Inthe generating area, often a storm, wind waves form what is called a "sea". At theupwind end of the fetch the waves are small but with distance they develop i.e. theirperiod <strong>and</strong> height increase <strong>and</strong> eventually they reach maximum dimensions possible forthe wind that is raising them. The sea is then said to be fully developed. The waveshave absorbed then as much energy as they can <strong>from</strong> wind of that velocity. Anextension of the fetch or a lengthening of the time would not produce larger waves.(Kinsman 1987, Bascom 1976) See also Sverdrup <strong>and</strong> Munk: Wind, Sea <strong>and</strong> Swell.See Figure 2.1 for a schematic of waves development <strong>and</strong> propagation stages.Figure 2.1. Concept of wave generation <strong>and</strong> propagation. The fetch is within the dashed line.Source: R. Silvester.2.2 The wave energy resource distributionAt each of the above steps energy in transferred to the water. The amount of energytransferred <strong>and</strong> hence the size of the resulting waves is a function of the wind speed, thelength of time it blows <strong>and</strong> the distance over which it blows called the fetch. It is foundthat at each step power is concentrated <strong>and</strong> that solar power levels of about 100W/m 2can eventually be transformed into waves with power levels of over 1000 kW per meterof wave crest .The distribution of the wave energy resource over the globe <strong>and</strong> its daily <strong>and</strong>seasonal variability during the year are dependent on the major wind distributions <strong>and</strong>systems that are the main cause for the generation of ocean waves. The main windsystems are due to extra-tropical storms <strong>and</strong> trade winds. Ocean currents like the GulfStream in the North Atlantic <strong>and</strong> the Kuroshio current in the pacific feed energy intoextra-tropical cyclones creating low pressure systems with wind speed that can reach upto 25 m/s <strong>and</strong> blow over a thous<strong>and</strong> kilometer fetch for two to four consecutive daysbefore subsiding by hitting the coast. The storms are most frequent during the winter.Extra-tropical cyclones follow a north-easterly track <strong>and</strong> continually build the waves in8
the southern sector of the storm. These waves will travel in the same direction as thestorm that generates them. However, waves generated in the northern part of anorthern-hemisphere cyclone travel opposite to the direction of the storm <strong>and</strong> get lessexposure to the storm’s wind energy. The result is that one gets comparatively lesswave energy in the western sides of an ocean basin than in the eastern side. Thisfeature is found in the northern hemisphere sectors of the Atlantic as well as the PacificOcean. The annual average of the wave-power levels is estimated along the edge ofNorth America <strong>from</strong> 10 to 20 kW/m reaching a level of 50 kW/m along Newfoundl<strong>and</strong>cost while along the edge of the eastern continental shelf of the north Atlantic isestimated to vary <strong>from</strong> 40kW/m off Portugal up to 75kW/m off the Irish <strong>and</strong> Scottishcoast dropping to about 30kW/m off the Northern part of the Norwegian coast. Figure2.2 shows the geographical distribution of coastal wave power levels. Along the coastof California the level is estimated as 30 kW/m <strong>and</strong> increasing to 60 kW/m along thecoast of Northern British Colombia. Local variation in the estimate of wave poweravailability is certain <strong>and</strong> more accurate estimates are needed. Accurate knowledge ofthe directionality of the wave regimes is also needed. Similar analysis has been done forthe southern hemisphere <strong>and</strong> is not presented here. (See for example Wavegen 2000)As for the trade winds systems off tropical coasts they carry an annual offshore wavepower levels of the order of 10 to 20 kW/m. In comparison to the extra-tropical stormwinds the trade-winds are more persistent <strong>and</strong> the variations in these winds intensitybetween the seasons are smaller. Some of these tropical areas might also be affected byswells generated in storm regions further north or south. Therefore some believe thatthis sustained source of wave energy around the equator is qualitatively a potential areafor wave energy systems deployment since these areas avoid the extreme conditionsfound in higher density locations. (See for example Wavegen 2000)Figure 2.2 Approximate global distribution of time-average deep water wave power.Wavepower is given in kW/m of wave front. Source: Thorpe (1998) <strong>and</strong> World <strong>Energy</strong> CouncilOrganisation (2004).9
2.3 Description <strong>and</strong> modification of waves<strong>Waves</strong> in the ocean are generally irregular. They are short-crested as opposed tolong-crested, directional <strong>and</strong> more or less r<strong>and</strong>om in nature. No two waves have exactlythe same height <strong>and</strong> they travel across the surface at different speeds <strong>and</strong> in differentdirections. Techniques for the coping with the chaotic nature of these waves on the realsea surface are discussed in the next section. It is first necessary to give an overview ofthe characteristics of ideal regular waves. Such waves rarely occur in the real oceanenvironment although they can be produce in laboratory wave tanks. They areimportant also because of the fact that the theory of irregular waves is based on theassumption that they can be represented by superposing or adding together a suitablenumber of regular waves.In order to discuss waves we use a st<strong>and</strong>ard set of definitions <strong>and</strong> terms for parts ofthe wave. The principal ones are defined as follows (Figure 2.3):Crest : The high point of a waveTrough: The low point of a wave.Wave height: Vertical distance <strong>from</strong> trough to crest.Wave length:Wave period:Horizontal distance between adjacent crests.The time in seconds for a wave crest to travel a distance equal toone wave length.Wave frequency: The inverse of the wave period.Wave celerity: The ratio of wave length <strong>and</strong> wave period.Note that there is a direct relationship between wave period <strong>and</strong> wavelength but waveheight is independent of either.Figure 2.3 The important features of water surface waves.After © Craton 1992, Brock Univ.In the offshore deep water regions waves vary slowly over space. However, as theyapproach towards the coast interaction with the seabed <strong>and</strong> currents could lead tosignificant changes in the characteristics of these waves. There also exist wave-coastline interactions resulting in what is called focusing, defocusing <strong>and</strong> sheltering of thewaves. These changes in the wave climate will affect the energy densities <strong>and</strong>characteristic. In general near shore wave systems carry less energy than their offshorecounterparts.10
Shallow water phenomena are generally classified according to their features inmaintaining energy or not. Hence we classify wave changes phenomena as conservativeor non-dissipative <strong>and</strong> dissipative.The main conservative processes include:i- shoaling <strong>and</strong> refractionii- diffraction <strong>and</strong> reflectionShoaling is defined as the variation of wave height due to changes in water depth.As the water depth decreases the wave height first decreases then would increase veryrapidly. The sudden increase in wave height causes the wave to break.Refraction like shoaling is caused by a varying depth seabed resulting in the focusing<strong>and</strong> scattering of waves <strong>and</strong> the turning of the wave crests becoming parallel to thebottom contours lines. Refraction can also be caused by the interaction of the waveswith currents. Refraction in the form of focusing of the waves can be a positive factorin wave energy extraction.Diffraction is a negative factor. In wave energy extraction applications diffractionaffect the smoothing of the distribution of wave energy in space.The main dissipative processes of interest include a reduction of the total amount ofwave energy by converting it into current, water turbulence, sediment transport or heat.Also included in such dissipative phenomena are wave breaking, bottom friction, wavereflection <strong>from</strong> sloping or rough surfaced structures or beds <strong>and</strong> percolation.<strong>Waves</strong> loose energy by friction at the sea bottom. This is more important once thewaves travel in shallower waters. The losses increase with travel distance <strong>and</strong> bottomroughness.2.4 Real sea characteristics<strong>Waves</strong> range in size <strong>from</strong> the ripples in a pond to the great storm waves of the ocean<strong>and</strong> the tides whose wavelength is half the distance around the earth. <strong>Waves</strong> areclassified according to their period (or frequency) that ranges <strong>from</strong> less than one secondto more than hundred thous<strong>and</strong> seconds (tides). The energy spectrum diagram of Prof.Munk shows that the energy in the ocean is distributed among several major groups ofwaves each with a characteristic range of periods.At the lower end of the spectrum with the very short period waves we have:Ripples:of periods of fractional secondsWind chop: of periods between 1 to 4 secondsFully developed seas: of periods ranging between 5 to 12 secondsSwells:of periods ranging between 6 to 22 secondsSurf beats:of periods ranging between 1 to 3 minutesTsunamis:of periods ranging between 10 to 20 minutesTides:with periods of 12 or 24 hours.11
Each are generated <strong>and</strong> developed in a special way. See section 2.1 for themechanisms generating wind waves. The above waves are also called gravity waves,since once they are created gravity is the force that drives them by attempting to restorethe original flat surface. Also the small tiny ripples of one or two millimeters in height,generated by a small breeze are sometimes also called capillary waves because they arecontrolled by surface tension. Tsunamis <strong>and</strong> tides are generated by differentmechanisms than the wind. See Figure 2.4.Figure 2.4 Types of waves that occur on the oceans classified by their wave period. The red barsindicate the mean wave period for each type <strong>and</strong> the yellow bars show the range of wave periods.After © Craton 1992, Brock University.Figure 2.5 after W. Munk shows the relative amount of energy in each of the wavesystems described above. See also Bascom (1976).Figure 2.5 The Ocean Wave Spectrum (Source Munk. See Bascom 1976)12
Real seas include waves that are r<strong>and</strong>om in height, period <strong>and</strong> direction. It is usuallyassumed that within a short length of time the characteristics of real seas remain thesame hence defining what is called a sea state. Statistical parameters derived <strong>from</strong> thewave spectrum are used to describe such sea states <strong>and</strong> characteristics relevant to theirenergy content. See Appendix 1.The following wave height <strong>and</strong> period parameters are most often used:The significant wave height H s : is the average height of the highest one-third waves.The energy period T e : is the mean wave period with respect to the spectral distributionof transport of energy. T p the peak period is defined as the period corresponding to thepeak in the variance density spectrum of sea surface elevation. It is the harmonicfrequency component having the greatest amount of energy at a place passed by ar<strong>and</strong>om wave system. Some ocean energy systems can be tuned to this frequency. Itresembles the tuning of a radio circuit to an electromagnetic field. (Thorpe, 1998).In deep water the power in each sea state P is given by as:P = 0.5 Hs 2 T e kW/mWhere H s is expressed in meters <strong>and</strong> T e in seconds <strong>and</strong> density of water taken as 1000kg/m 3 . See Thorpe, 1998.In Thorpe, the annual variation in sea states is represented in a scatter diagramindicating how often a sea state with a combination of characteristic parameters occurannually. The annual average wave power level can be determined <strong>from</strong> the scatterdiagram in the form:P ave =∑ P i W i /∑ W iWhere sea states of power level P i occur W i times per year.Several models for the formulation of the wave energy density distribution in termsof the frequency have been proposed. They are based on the velocity of the wind thatgenerated the waves. The most notable are the Pierson-Moskowitz, the JONSWAPspectral models (Joint North Sea Wave Project) <strong>and</strong> others. Reference is here made to,for example, Kinsman, 1984 for further details.Some of the properties of wind waves are shown in Figure 2.6. In the figure the waveperiod is plotted against the amount of energy contained for three wind velocities. Eachcurve (spectrum) represents the distribution of energy between various periods in afully developed sea. The area under each curve gives an estimation of the total energy.As an example we can consider a 20 knot wind (10 m/s). A knot is about 0.5 m/s. Thisrelatively modest wind raises waves whose average is 5 feet or 1.52m <strong>and</strong> whoseenergy is spread over a range of periods ranging between 7 to 10 seconds (orfrequencies between 0.15 Hz to 0.1 Hz) . If the wind increases to 30 knots (15 m/s) thewaves increases substantially <strong>and</strong> the period gets longer. There is more energy available<strong>and</strong> these longer waves store it better, (Kinsman 1984). The average height of thewaves are now 13.6 feet or 4.14 m <strong>and</strong> the maximum energy is centered around aperiod of 12 seconds or frequency of 0.08 Hz. See Figure 2.6. For a 40 knots ( or 20m/s) wind the spectrum shows a sharp peak at 16.2 seconds ( or 0.062 Hz) <strong>and</strong> theaverage height of the waves are now in this case 28 feet (or 8.53 m).13
Figure 2.6 Wave spectra for fully developed seas for winds of 20, 30 <strong>and</strong> 40 knots.After Pierson, Neumann <strong>and</strong> James see Bascom 1984.The following Table 2.1 shows the important characteristics of seas that are fullydeveloped for winds of various velocities. An important point to note here is that aparticular wind at a certain speed must blow for at least some time (shown in the table)along a minimum fetch length to raise fully the waves it is capable to generate. Fromthe table for a 50-knot or 25 m/s wind blowing for 3 days over a 1500 miles fetch thehighest tenth of the waves would average about 100 feet (about 30 m) high. Stormsrarely reach such dimensions or durations.Table 2.1 Conditions in fully developed seasAfter Munk , Kinsman 1984.Wind Distance Time <strong>Waves</strong>Velocity(knots)Length of fetch innautical miles (km)(hours)Averageheight in ft(m)H sSignificantheight (ft)H 10Average ofthe highest10% (ft)Period wheremost ofenergy isconcentrated(sec)10 10 (16.7km) 2.4 0.9 (0.27m) 1.4 (0.43m) 1.8 (0.55m) 415 34 (57.8km) 6 2.5 (0.76m) 3.5 (1.07m) 5 (1.53m) 620 75 (127.5km) 10 5 (1.52m) 8 (2.44m) 10 (3.05m) 825 160 (272.1km) 16 9 (2.74m) 14 (4.27m) 18 (5.50m) 1030 280 (476.2km) 23 14 (4.26m) 22 (6.71m) 28 (8.54m) 1240 710 (1207.5km) 42 28 (8.52m) 44 (13.41m) 57 (17.4m) 1650 1420 (2415.1km) 69 48 (14.63m) 78 (23.77m) 99 (30.17m) 2014
2.5 Data about ocean wavesFor the evaluation <strong>and</strong> estimation of long-term series of wave data twomethodologies have been suggested. The first is based on measurement <strong>and</strong>observations <strong>and</strong> the second on building time series with numerical wind-wave models.A wide variety of on site <strong>and</strong> remote sensing measuring methods are available thatproduce accurate wave data. Visual observations made <strong>from</strong> sea-going ships are theearliest type of wave data for the oceans. Wind-wave models are mathematicalalgorithms encapsulated in computer programs that numerically generate <strong>and</strong> propagatewave energy based on input wind data or other relevant data. The accuracy is good foropen ocean resource assessment in large basins such as the North-Atlantic <strong>and</strong> PacificOceans. These models are implemented at most meteorology centers. The availablewave data is not an easy task to collect since the data are archived at several institutionsthat have different procedures to access it.1) Measurements <strong>and</strong> Observations of ocean (wave/current) climate:MeasurementsA wide choice of measuring systems exists. The choice of a system depends on anumber of parameters, namely: on depth, access <strong>and</strong> wave conditions of themeasurement site <strong>and</strong> of the required details, for example directionality. Figure 2.7shows a diagram of several wave measurement systems. Figure 2.8 shows a sketch ofan in situ measuring system based on a buoy with local data storage as well astransmission to an on-shore processing data station.Figure 2.7: Diagrammatic Sketch of several measurement systemsSource: Pontes T. Department of Renewable Energies, Lisbon, Portugal. Original in Earle <strong>and</strong>Bishop (1984). See also Brooke (2003).15
Figure 2.8: Diagrammatic sketch of an in situ wave measuring system.Source: Pontes T. Department of Renewable Energies, Lisbon, Portugal <strong>and</strong> Laboratorio nacionalde Engenharia e Tecnologia, Portugal . See also Brooke (2003).Some devices can provide wave directional information by their own or whencoupled with other devices. In situ devices can store information or transmit by cable ortelemetry to an on-shore data processing stations. Remote sensing could use laser orradar devices mounted on a satellite, aircraft, ship, or could be based on l<strong>and</strong>. Studiescomparing device accuracy have been performed <strong>and</strong> could be found in the literature.Generally, the types of measurements are classified as:i) In situ measurementsii) Remote sensing measurementsWave-recording buoys are used extensively in the open-sea. Their data are generallyin the form of time series of sea surface elevation <strong>from</strong> which wave height, period <strong>and</strong>direction parameters could be calculated. Spectral <strong>and</strong> direct analyses of the time seriesare used for this purpose. Beside buoys other devise are used. For example in coastalareas submerged or suspended pressure <strong>and</strong> acoustic probes, wave staffs, current meterscould be used to obtain non-directional information about wave activities characteristic.When such probes are used in arrays directional information could be calculated.<strong>Energy</strong> devices utilizing Oscillating Water Column principle would generally includesome measuring system of the water surface inside the chamber. Difficulties could arisein the presence of water spray.For resource assessment long period measurements are needed. However these are noteasy to find. Short-term wave data acquisition is usually performed for coastalengineering projects as well as for offshore oil platforms.Remote sensing systems are used to provide spatial information about the sea surfacein contrast to the information gathered at one point (in situ) as described above. Thesimplest remote-system measuring devices rely on aerial photography. These could be16
used for studies of wave refraction <strong>and</strong> diffraction near <strong>and</strong> along coastlines. Theywould be important for optimizing near-shore <strong>and</strong> shoreline plants sites.Satellites have also been advanced as a means to remote sensing wave on the surfaceof the ocean. The main limitation with this technology is that the data would only beintermittent. This strongly limits the data available in a specific zone. The positive sideof it is that the method is statistically unbiased since the satellite sampling method isnot under the effects of the sea conditions they try to measure. Altimeter data valueshave been used.The cost of performing <strong>and</strong> collecting wave data is not discussed in this report.This is by no means an exhaustive review <strong>and</strong> evaluation of the methods used for wavedata collection.ObservationsEarliest types of wave data resulted <strong>from</strong> visual observations made <strong>from</strong> travelingships. These have been archived <strong>from</strong> 1850s onward. Presently the visual observationsare performed using well-defined procedures <strong>and</strong> techniques. Reference is here made tothe world Meteorological Organization publications <strong>and</strong> st<strong>and</strong>ards. Several authorsstudied the accuracy of visual data. The report on these studies is outside the scope ofthis report. However, a number of reports conclude that in general, visually wavedirections are most reliable, wave heights are considered satisfactory but wave periodsare much less accurate. Visual data are considered to supplement the data obtained<strong>from</strong> measurements. Several global <strong>and</strong> regional atlases of visual wave climates couldbe found in the literature. They would also be relied upon wherever measurements arenot available.2) Theoretical <strong>and</strong>/or Computational ocean wave modelsTheoretical <strong>and</strong> computational models have been used to assess shoreline, near-shore oroffshore wave power resource. Deepwater models are available to simulate <strong>and</strong>compute the propagation of deepwater waves <strong>and</strong> their energy transport. Calculationsof the transformation of deepwater wave systems when they approach shallower depthare also required. The size of the coastal area in these studies can vary depending on theseabed topography <strong>and</strong> the length the coastal line. Scaled physical models aresupplemented with computational computations that are based on mathematical modelsof wave propagation <strong>and</strong> transformation. This is an ongoing area of research in offshore<strong>and</strong> coastal engineering <strong>and</strong> the results could well suit the application discussed in thisreport. Such models except perhaps wave breaking <strong>and</strong> some other complexinteractions can satisfactorily describe a wide range of wave propagation phenomena.Simplified representations are hence used in these cases. The purpose being to evaluate<strong>and</strong> determine the amount of ocean (wave/current) energy transported <strong>and</strong> dissipated.Without being exhaustive Table 2.2 <strong>and</strong> Table 2.3 present an example of an attemptto classify computational shallow water wave models that are found to be appropriatefor the assessment of ocean energy resource. The information in the tables follow thecriteria presented by Southgate (1987, 1993). These tables help to illustrate only thevast amount of studies on waves <strong>and</strong> currents, their generation, propagation, forecasting<strong>and</strong> modeling. A separate study of the resource evaluation methodology is needed toassess the progress in this field of research <strong>and</strong> development.17
Table 2.2 Wave processes incorporated in shallow water computational models(source after Southgate 1987, 1993)Computational modelRay modelsGrid modelsForwardtrackingBacktrackingRefractionHyperbolicrefractiondiffractionParabolicrefractiondiffractionEllipticrefractiondiffractionInternaldiffractionNot modeled,but numericalsmoothing byray averagingSame asaboveSame asaboveWave processes modeledExternal Reflections BottomdiffractionfrictionOnly forspecialsituationsWavebreakingYes Yes (1) Yes (1,2)No Yes NoNo, apart<strong>from</strong> check atinshore pointsNo No (3) Yes Yes (2)Yes Yes No Yes Yes (2)YesYes, butdifficult ingeneralNo (3) Yes Yes (2)Yes Yes Yes Yes YesNonlinear Yes Yes Yes Yes YesNote: All models require reasonable gentle depth variations(1) Except for intersecting wave trains(2) Approximate energy loss in shallow water only(3) Backscattered waves cannot be modeledTable 2.3 Shallow water computational models: model suitability parametersComputationalmodelRay modelsGrid modelsForwardtrackingBathymetry(specialrequirements)Regular depthvariation;poor for shoalsystems(source after Southgate 1987)Extent of seaareaUnlimitedBacktracking No UnlimitedRefractionHyperbolicrefractiondiffractionParabolicrefractiondiffractionEllipticrefractiondiffractionRegular depthvariationSame asaboveNoNoUnlimitedType ofcoastlineAnyAny, exceptwhere depthvariation isimportantReasonablystraight coastfacing open seaNumber ofinshore pointsCovering entiremodeled areaOneCovering entiremodeled areaUnlimited Same as above Same as aboveLimited to afew kilometersat mostSame as aboveOffshorewaveconditionsRegularwave (1)FullspectrumRegularwave (1)Regularwave (1)Same as above Same as above Regularwave (1)Same as above Same as above Regularwave (1)Nonlinear No Same as above Same as above Same as above Surfaceelevation18
Note: All models require reasonable gentle depth variations(1) Full spectrum S(fθ ) may be covered by multiple runs.Wave-current interaction models have also been studied. The review of this topic isbeyond the scope of this report. However, the work of Baddour et al (1990, 1991) onthis particular subject of wave-current interaction <strong>and</strong> more recently in 2003- 2004 onnonlinear wave generation <strong>and</strong> propagation is worth noting, see Appendix 3. Thesemodels also allow the development of a computational tool for energy flux estimationsin deep <strong>and</strong> shallow water for specified sea states. Other CFD tools <strong>and</strong> computerprograms could theoretically be used for such purposes. An evaluation campaign ofthese tools are perhaps in order.2.6 <strong>Marine</strong> currents origins<strong>Currents</strong> within the oceans are determined, for the most part, by the large scalestructure of atmospheric circulation; currents at the surface of the oceans are dictated bythe prevailing winds that blow over the water surface. Surface waters move due tofriction between the moving air <strong>and</strong> the water surface. Figure 2.9 shows the majorsurface currents of the world’s oceans. This displacement of water at the surface, inturn, contributes to the generation of currents that extend to great depth within theoceans. See: Craton 1993, Brock university.We are here interested in locally generated currents due to tides that are simply therhythmic rising <strong>and</strong> falling of the surface of the ocean over the course of a day. Tidesare not currents, themselves, but as the water surface rises <strong>and</strong> falls along a coast thewater must flow to accommodate the geometry <strong>and</strong> topography of the coastline. Therising <strong>and</strong> falling of the ocean surface is due to the rotation of the approximatelyspherical Earth that is covered by a slightly elliptical ocean. The form of the surface ofthe oceans is dictated by gravitational interaction between the Earth, the Sun <strong>and</strong> theMoon.The centrifugal force about the earth (due to its rotation) acts outward <strong>from</strong> thecentre of the Earth <strong>and</strong> is equal in all directions. The presence of the Moon, in a circularorbit around the Earth, results in a gravitational attraction between the two bodies.Gravitational attraction is strongest at the closest point between the two bodies <strong>and</strong>diminishes away <strong>from</strong> that point. Thus, the moon’s gravitational attraction is strongeston the side of the Earth that faces the moon <strong>and</strong> weakest on the opposite side of theEarth. The average gravitational force exerted on the Earth by the moon is balancedexactly by the centrifugal force of the spinning Earth. On the side of the Earth facingthe moon the gravitational force is strongest <strong>and</strong> exceeds the centrifugal force so thatthe ocean surface is pulled slightly towards the moon (creating a bulge on the oceansurface). On the opposite side of the Earth the centrifugal force exceeds thegravitational force, pushing the ocean surface slightly away <strong>from</strong> the Earth (creating asecond bulge on the ocean surface). The result is an ocean surface with two bulges at180 degrees to each other (<strong>and</strong> shallower water at 90 degrees to each of the bulges).19
The position of these two bulges are fixed with respect to the position of the Moonwhile the Earth rotates about its polar axes <strong>and</strong> the ocean’s ellipsoidal axis is the linethat joins the moon <strong>and</strong> the Earth. The tides are produced as the Earth rotates throughthese two bulges on the ocean surface. See Craton 1992. Every 24 hours a point on theocean will rotate through the bulge twice, creating two high tides, <strong>and</strong> through therelatively shallow areas at 90 degrees to the axis of the bulge, creating two low tides.The water level at any point varies in a constant manner <strong>from</strong> high to low tide <strong>and</strong> backagain twice over every day.Fig 2.9: Major surface currents (Source © Craton 1992, Brock University)2.7 <strong>Marine</strong> current resourceThe global marine current energy resource that we are interested in, is mostly drivenby the tides. Other technologies would be interested in currents driven by thermal <strong>and</strong>density effects <strong>and</strong> are not presented here. As discussed above the tides cause water toflow inwards twice each day (flood tide) <strong>and</strong> seawards twice each day (ebb tide) with aperiod of approximately 12 hours <strong>and</strong> 24 minutes (a semi-diurnal tide), or once bothinwards <strong>and</strong> seawards in approximately 24 hours <strong>and</strong> 48 minutes (a diurnal tide). Inmost locations the tides are a combination of the semi-diurnal <strong>and</strong> diurnal effects, withthe tide being named after the most dominant type.The strength of the currents varies, depending on the proximity of the moon <strong>and</strong> sunrelative to Earth. The magnitude of the tide-generating force is about 68% moon <strong>and</strong>32% sun due to their respective masses <strong>and</strong> distance <strong>from</strong> Earth (Open University,1989). Where the semi-diurnal tide is dominant, the largest marine currents occur atnew moon <strong>and</strong> full moon (spring tides) <strong>and</strong> the lowest at the first <strong>and</strong> third quarters ofthe moon (neap tides). With diurnal tides, the current strength varies with thedeclination of the moon (position of the moon relative to the equator). The largestcurrents occur at the extreme declination of the moon <strong>and</strong> lowest currents at zerodeclination. Further differences occur due to changes between the distances of the20
moon <strong>and</strong> sun <strong>from</strong> Earth, their relative positions with reference to Earth <strong>and</strong> varyingangles of declination. These occur with a periodicity of two weeks, one month, one yearor longer, <strong>and</strong> are entirely predictable (Bernstein et al, 1997, <strong>and</strong> World <strong>Energy</strong> Council2000).2.8 <strong>Marine</strong> currents characteristics <strong>and</strong> resource distributionGenerally the marine current resource follows a sinusoidal curve with the largestcurrents generated during the mid-tide. The ebb tide often has slightly larger currentsthan the flood tide. At the turn of the tide (slack tide), the marine currents stop <strong>and</strong>change direction by approximately 180 0 .The strength of the marine currents generated by the tide varies, depending on theposition of a site on the earth, the shape of the coastline <strong>and</strong> the bathymetry (shape ofthe sea bed). Along straight coastlines <strong>and</strong> in the middle of deep oceans, the tidal range<strong>and</strong> marine currents are typically low. Generally, but not always, the strength of thecurrents is directly related to the tidal height of the location. However, in l<strong>and</strong>-lockedseas such as the Mediterranean, where the tidal range is small, some sizeable marinecurrents exist.There are some locations where the water flows continuously in one direction only,<strong>and</strong> the strength is largely independent of the moon’s phase. These currents aredependent on large thermal movements <strong>and</strong> run generally <strong>from</strong> the equator to coolerareas. The most obvious example is the Gulf Stream, which moves approximately 80million cubic metres of water per second (Gorlov, 1997). Another example is the Straitof Gibraltar where in the upper layer a constant flow of water passes into theMediterranean basin <strong>from</strong> the Atlantic (<strong>and</strong> a constant outflow in the lower layer).Areas that typically experience high marine current flows are in narrow straits, betweenisl<strong>and</strong>s <strong>and</strong> around headl<strong>and</strong>s. Entrances to lochs, bays <strong>and</strong> large harbours often alsohave high marine current flows (EECA, 1996). Generally the resource is largest wherethe water depth is relatively shallow <strong>and</strong> a good tidal range exists, Bay of Fundy is anexcellent example. In particular, large marine current flows exist where there is asignificant phase difference between the tides that flow on either side of large isl<strong>and</strong>s.There are many sites world-wide with velocities of 5 knots (2.5 m/s) <strong>and</strong> greater.Countries with an exceptionally high resource include the UK (E&PDC, 1993), Irel<strong>and</strong>,Italy, the Philippines, Japan <strong>and</strong> parts of the United States. Few studies have beencarried out to determine the total global marine current resource, although it isestimated to exceed 450 GW (Blue <strong>Energy</strong>, 2000). See World <strong>Energy</strong> Council reports.A recommendation is here hence made to initiate a study to estimate the energy inocean currents in <strong>Canada</strong>. We all know of the currents available in the Bay of Fundy forexample. We need an accurate estimate of the energy due to currents <strong>and</strong> itsdistribution along the coast. Similar to a wave energy-prospecting project we need amarine current energy detailed survey. See Figure 2.10.21
Figure 2.10 Variation in <strong>Tidal</strong> range along the coast of North America. <strong>Tidal</strong> heights areproportional to the currents induced. Ranges given are the differences in water levels <strong>from</strong> low tideto high tide, in meters. The bare map is courtesy of Theodora.com.3 Ocean energy harnessing systems3.1 Wave energy harnessing technology3.2 Wave energy developments <strong>and</strong> activities3.3 Ocean currents energy technology3.4 Ocean currents developments <strong>and</strong> activities3.1 Wave energy harnessing technologyWave power developments face a number of difficulties. Basically, they include thefollowing: Large loading in extreme, harsh weather conditions, corrosive environment,r<strong>and</strong>omness in power input or low transmission frequencies. The design of a waveenergy harnessing system to be efficient <strong>and</strong> competitive has to deal with thesedifficulties in an efficient way. This means that the system must be beneficial <strong>and</strong>economically reasonable.Starting with a conceptual idea a wave energy device goes through a long evolution:usually starting with theoretical analyses <strong>and</strong> design the project goes through extensive22
experimental R&D work in the wave tanks at small <strong>and</strong> intermediate scales. This R&Dwork is required before the first prototype can be deployed in the sea. Freak loads inthe sea may exceed the estimated values <strong>and</strong> are difficult to predict. High degree ofknowledge <strong>and</strong> sophistication are needed so that the design of a wave energy systemmay operate safely in extreme conditions <strong>and</strong> be economically viable. This knowledge<strong>and</strong> sophistication could be found nowadays in the offshore engineering industry.In ocean energy resource utilization, in contrast to other renewables, there are a largenumber of ideas <strong>and</strong> concepts for wave energy harnessing or conversion. In Japan,North America <strong>and</strong> Europe there are over a 1000 wave energy harnessing techniquespatents.Harnessing wave energy could involve three levels:The first level called primary conversion of wave energy is gained by an oscillatingsystem. These systems include for example: a floating body, an oscillating solidelement or oscillating water within a structure. The system will then be able to storesome kinetic <strong>and</strong>/or potential energy extracted <strong>from</strong> the wave.A second level called secondary conversion may be required to convert the storedenergy into some useful form. In this level devices for control <strong>and</strong> power take offinvolve controllable valves, hydraulic rams <strong>and</strong> various hydraulic <strong>and</strong> pneumaticcomponents as well as electronic hardware <strong>and</strong> software. This secondary conversion isusually obtained by means of a turbine through rotation of a shaft.Tertiary conversion could be needed if electric generators are used for the conversionof the harnessed power into electricity. Brooke 2003.Classification:In the literature a number of ways are found to classify wave energy converters(WEC).According to their horizontal size <strong>and</strong> orientation:If the size of the system is small compared to the typical wavelength then the WEC iscalled a point absorber. See Budal <strong>and</strong> Falnes (1975).On the other h<strong>and</strong> if the extension is large <strong>and</strong> comparable to the typical wavelengththen the WEC is called a line absorber. Terminator <strong>and</strong> attenuator have also been usedto denote these WECs. A WEC is a terminator if it is aligned along the prevailingdirection of wave crests <strong>and</strong> is an attenuator if aligned normal to the prevailing wavecrests.According to their different location with respect to the coastline:WECs may be located onshore, nearshore or offshore. Onshore WEC’s are on the coastline, however nearshore is the designation given to WEC’s if located in shallow waters<strong>and</strong> within 10-15 km distance <strong>from</strong> the coastline, while offshore systems are the oneswhich would be developed beyond that.According to their locations with respect to the mean water level:WECs are found partly above <strong>and</strong> partly below the mean water level. They may becompletely submerged <strong>and</strong> placed on the seabed below the mean water level. Devicesmay be moored in a floating on the free surface or partly submerged either nearshore oroffshore. Some systems could be called hybrid in the sense that nearshore units couldbe pumping fluid in a closed loop to an elevated reservoir on the shore <strong>from</strong> whichenergy would be extracted.23
Figure 3.1 <strong>from</strong> Hagerman (1995) identifies twelve distinct process variations. Themain features that distinguish one concept <strong>from</strong> another are the mode of oscillation forenergy absorption, type of absorber, <strong>and</strong> type of reaction point. Hence energy can beabsorbed <strong>from</strong> heave motion, surge, pitch <strong>and</strong> yaw or combinations of these as shownin Figure 3.1. Table 3.1 is a modification of Hagerman (1995) classification <strong>and</strong>presented in Brooke (2003).The wave energy conversion is described as follows. See Brooke (2003). The waveforce acts on a movable absorbing member which reacts against a fixed point on l<strong>and</strong> orsea-bed based structure, or against another movable, but force–resisting structure.Heave forces may be reacted against a submerged horizontal plate. Wave forces mayalso be reacted against a long spine. The wave force results in oscillatory motion of theabsorbing member. The product of wave force <strong>and</strong> corresponding motion representsabsorbed wave energy.Figure 3.1 Classification of Wave <strong>Energy</strong> Converters Systems. Hagerman(1995)24
PrimaryLocationSystemofTable 3.1 Classification of wave energy devices processesSource Brooke (2003) with reference to Hagerman (1995) of Fig. 3.1Wave <strong>Energy</strong> Conversion Process# DescriptionOnshore 1.1 Fixed oscillating water column 21.2 Reservoir filled by wave surge 11.3 Pivoting flaps 4Nearshore 2.1 Freely floating oscillating water column 32.2 Moored floating oscillating water column 32.3 Bottom mounted oscillating water column 22.4 Reservoir filled by direct wave action 12.5 Flexible pressure device 112.6 Submerged buoyant absorber with sea floor reaction 122.7 Heaving float in bottom mounted or moored floating caisson 52.8 Floating articulated cylinder with mutual force reactionOffshore 3.1 Freely heaving float with sea floor reaction point 63.2 Freely heaving float with mutual force reaction 73.3 Contouring float with mutual force reaction 83.4 Contouring float with sea floor reaction point 93.5 Pitching float with mutual force reaction 103.6 Flexible bag with spine reaction point 113.7 Submerged pulsating-volume body with sea floor reaction point3.8 Reservoir filled by direct wave action 1ReferencetoHagermanFig 3.1The main generic types of wave energy harnessing schemes could hence be listed as:See Brooke (2003) <strong>and</strong> Hagerman (1995).1. The Oscillating Water Column systems:which in general include a partially submerged, hollow structure open to the sea belowthe water line.2. Overtopping systems:that collect the water of incident waves to create a head to drive one or more low headturbines.3. Point absorbers systems:these are either floating or mounted on the sea bed <strong>and</strong> provide a heaving motion that istransformed by mechanical <strong>and</strong>/or hydraulic subsystems into linear or rotational motionto drive electric generators.4. Surging devices :these devices use the particle velocity in a wave to drive a deflector or to generatepumping effect of a flexible bag facing the wave.5. Other devices:25
that do not fall under the above 1-4 classes. These include important developments ofwhich we find: the Salter duck, the Cockerell raft <strong>and</strong> the McCabe Wave Pump.3.2 Wave energy developments <strong>and</strong> activitiesRecently there has been a renewed interest in ocean wave <strong>and</strong> tidal current energy.Recent WATTS conferences attest to that. See WATTS 2004 conference proceedingsfor more details <strong>and</strong> status of recent developments.New ocean energy companies have been involved in the development of newtechnologies. Examples of these are the Pelamis, the Archimedes Wave Swing <strong>and</strong> theLimpet. The plan is to increase the worldwide ocean energy capacity to 6 MW in thenear future. See also Thorpe (2000). As of 2002 the installed capacity (around theworld) was about 1 MW, mainly <strong>from</strong> demonstration projects. Source Thorpe (2000)<strong>and</strong> Brooke (2003). See the following tables <strong>from</strong> the same sources.Shoreline wave energy systems:<strong>Energy</strong>ConversionProcessCountry <strong>and</strong> location Site StatusFixed OWC Australia, Port Kembla Breakwater Adv. Stage Develop." China, Dawanshan 1 Shoreline Operational" China, Shanwei Adv. Stage Develop." India, Vizhinjam, Harbour Operational" Japan, Sanze Shoreline gully Operational" Japan, Sakata port Breakwater Operational" Japan, Kujukuri-Cho Breakwater Operational" Japan, Haramachi Operational" Mexico Operational, sea water pump" Norway, Toftoy Cliff wall Operational" Portugal, Pico, Azores Rocky gully Operational" UK, Isle of Islay Shoreline gully Operational" UK, Isle of Islay Cliff face OperationalReservoir filled Norway, Toftoy Gully <strong>and</strong> Operationalby wave surgeinterior bayPivoting flaps Japan, Muroran Port Seawall OperationalPivoting flaps Japan, Wakasa Bay Seawall OperationalNearshore wave energy systems<strong>Energy</strong>ProcessConversionDevice name Country <strong>and</strong> location StatusFreely floating OWC - China, various Op., navigation buoy" - Japan, various Operational" Kaimei floating Japan, Yura OperationalFixed floating OWC Mighty Whale Japan, Gokasho Bay Opearational" Sperbuoy UK, Plymouth Adv. Stage Dev.26
" Shim wind-wave syst. South Korea Adv. Stage Dev.Bottom mounted OWC Osprey UK, Thurso -Reservoir filled by wave Floating wave power Sweden Adv Stage Dev.Flexible pres. device SEA Clam UK Adv Stage Dev.Submerged buoyant- - -absorber sea-floor RPHeaving float in bottommountedConWEC Norway Adv. Stage Dev.or mooredcaissonFloating articulated Pelamis UK, Shetl<strong>and</strong>/Isle of Islay Adv. Stage Dev.cylinder with inertial RPOffshore wave energy systemsDevice name Country <strong>and</strong> location Status<strong>Energy</strong> ConversionProcessFreely heaving float with OPT Wave Power USA, Australia, Portalnd, Adv. Stage Dev.sea floor RPSystemAustralia" Danish Heaving buoy Denmark, Hanstholm Adv. Stage Dev." Phase-controlled Norway, Trondheim Fjord Adv. Stage Dev.Power Buoy" DELBUOY US OperationalFreely heaving float with Hosepump Sweden Adv. Stage Dev.inertial RP" IPS Buoy Sweden Adv. Stage Dev.Contouring float with McCabe Wave Pump Irel<strong>and</strong>, Shannon River Adv. Stage Dev.inertial RPEstuary" Wave <strong>Energy</strong> Module US Adv. Stage Dev.Contouring float with seafloorKaiyo Jack-up Rig Japan, Iriomote Isl<strong>and</strong> Adv. Stage Dev.RPOkinawa" Contouring Raft UK Adv. Stage dev." Contouring Raft US Adv. Stagre Dev.Pitching float with inertial - - -reaction pointFlexible bag with spine - - -reaction pointSubmerged pulsatingvolumeArchimedes Wave Netherl<strong>and</strong>s, Viano do Adv. Stage Dev.body with sea-SwingCastello, Portugalfloor RP3.3 Ocean currents energy technologyThere are basically two ways to convert tidal currents energy into useful power. Theyrely on the types of turbines to be used.27
1) Turbines harnessing the potential energy in a low hydrostatic headThe first type needs a hydrostatic head for it to transformation the stored potentialenergy into power. The technology is very similar to the technology used in traditionalhydroelectric power plants. For this purpose arises the requirement of a dam or barrageacross a tidal bay or estuary. Example of this technology is found in the AnnapolisRoyal <strong>Tidal</strong> Power plant <strong>and</strong> the one at La Rance in France.Fig. 3.2 The phases of operation at La Rance, France. The darkened areas in the graphindicate the amount of head or quantity of energy available. The upper diagram shows the cycle withoutpumping. The lower one shows more energy available in sipite the expenditure on pumping. © AfterClancy (1968) The tides : Pulse of the EarthBuilding dams is an expensive process <strong>and</strong> its footprint <strong>and</strong> environmental impactcould be large. In any case, at certain points along the dam gates <strong>and</strong> turbines areinstalled. When there is an adequate difference in the elevation of the water on thedifferent sides of the barrage the gates are opened. The hydrostatic head causes thewater to flow through the turbines to produce electricity. Technically, power can begenerated by water flowing both into <strong>and</strong> out of the bay. Basically the barrage holds thewater in the estuary as the tide falls. Then, gates are opened <strong>and</strong> the water rushes28
seaward through the turbine(s). Later, the rising tide will be held back by the barragethen released to flow through another turbine (or the same if it is designed to do so) intothe river estuary. See Figure 3.2.The major factors in determining the cost effectiveness of a tidal power site are thesize (length, height) of the required dam, <strong>and</strong> the difference in height between high <strong>and</strong>low tides. These factors are expressed in what is called a site Gibrat ratio. The Gibratratio is the ration of the length of the dam in meters to the annual energy production inKilowatt hours. (1 Kilowatt hour = 1 KWH = 1000 watts used for 1 hour). The smallerthe Gibrat site ratio the more desirable is the site.Very little is understood about how altering the tides can affect complex aquatic <strong>and</strong>shoreline ecosystems. Unfortunately one of the only methods of increasing ourknowledge about how tidal barrages affect the environment may be the study of theeffects before <strong>and</strong> after such plants have been built. This strategy perhaps might then betoo late!!2) Turbines harnessing the kinetic energy of the flowUseful energy can be generated <strong>from</strong> marine currents using completely submergedturbines comprising of rotor blades <strong>and</strong> a generator. They are sometimes called waterturbines. Water turbines work on the same principle as wind turbines by using thekinetic energy of moving fluid <strong>and</strong> transferring it into useful rotational <strong>and</strong> electricalenergy. The velocities of the currents are lower than those of the wind, however owingto the higher density of water (835 times that of air) water turbines are smaller thantheir wind counterparts for the same installed capacity. The power that can be extracted<strong>from</strong> the currents is dependent on the velocity of the water flow <strong>and</strong> the area <strong>and</strong>efficiency of the water turbine, <strong>and</strong> can be calculated asfollows:P = 1 2 ρ A v3 C PWhere ρ is the density of sea water 1025 kg/m 3 A is the area of the rotor blades in m 2v is the marine current velocity in m/s <strong>and</strong> C p is the power coefficient, a measure of theefficiency of the turbine.Two types of turbines have been proposed.i) Horizontal axis turbines (axial flow turbine).ii) Vertical axis turbines (cross flow turbine).See Figure 3.3 for the conceptual designs <strong>and</strong> possible configurations.29
Figure 3.3 Conceptual diagrams of types of current turbines <strong>and</strong> their potentialconfigurations. Source © World <strong>Energy</strong> CouncilIn order for marine current energy to be utilised, a number of potential problems willneed to be addressed, including:Avoidance of cavitation by reducing tip speeds to approximately 8 m/s. This suggestsa turbine with a higher solidity than a wind turbine;Prevention of marine growth building up on the blades or ingress of debris;Proven reliability, as operation <strong>and</strong> maintenance costs are potentially high;Corrosion resistance, bearing systems <strong>and</strong> sealing;Turbines may be suspended <strong>from</strong> a floating structure or fixed to the seabed. In largeareas with high currents, it will be possible to install water turbines in groups or clustersto make up a marine current farm, with a predicted density of up to 37 turbines persquare km. This is to avoid wake-interaction effects between the turbines <strong>and</strong> to allowfor access by maintenance vessels (DTI, 1999).30
As there are currently no commercial turbines in operation, it is difficult to assess thecost of energy <strong>and</strong> competitiveness with other energy sources. Initial studies suggestthat for economic exploitation, velocities of at least 2 m/s (4 knots) will be required,although it is possible to generate energy <strong>from</strong> velocities as low as 1 m/s. As thetechnology matures <strong>and</strong> with economies of scale, it is likely that the costs will reducesubstantially, Rudkin, 2001.Future of <strong>Marine</strong> Current <strong>Energy</strong>Compared with other renewable technologies, there has been little research intoutilising marine current energy for power generation. However, in principle marinecurrent energy is technically straightforward <strong>and</strong> may be exploited using systems basedon proven engineering components (FMP, 1999). In particular, knowledge gained <strong>from</strong>the oil <strong>and</strong> gas industry, the existing hydro industry <strong>and</strong> the emerging wind energyindustry can be used to overcome many of the hurdles facing marine current energy.The global marine current energy resource is very large, <strong>and</strong> it has a number ofadvantages over other renewables. The table below shows a comparison of the oceanwaves <strong>and</strong> marine current energy resource with other renewables <strong>and</strong> conventionalenergy sources. It is clear that there are many benefits to utilising current energy,including : (Vortec <strong>Energy</strong>)The resource has four times the energy density of a good wind site, so thediameter of water turbines can be less than half that of a wind turbine for the sameenergy output.The water velocities <strong>and</strong> therefore power outputs are completely predictable,once accurate site measurements have been taken.Water turbines will not need to be designed for extreme atmosphericfluctuations as required with wind turbines, meaning that the design can be better costoptimised.With increased conflicts over l<strong>and</strong> use, water turbines offer a solution that willnot occupy l<strong>and</strong> <strong>and</strong> has minimal or zero visual impact.The greatest resource is in close proximity to coastlines <strong>and</strong> many areas withhigh population densities.The technology is potentially modular <strong>and</strong> avoids the need for large civilengineering works.The environmental impact resulting <strong>from</strong> marine current energy use is likely tobe minimal. Project planning will need to be cognisant of species protection includingfish <strong>and</strong> marine mammals, although since the blade velocities <strong>and</strong> pressure gradientsare low this is unlikely to cause any serious problems (Fraenkel, 1999). In the processof locating turbines, consideration of shipping routes <strong>and</strong> present recreational uses suchas fishing <strong>and</strong> diving will be required. Fishery exclusion zones might be necessary to beestablished.31
Table 3.2: Comparison of wave <strong>and</strong> marine current energy with other energy resourcesSource: Emily Rudkin, Vortec <strong>Energy</strong> (2001).The table (Rudkin et al, 2001) shows that marine current energy is one of the mostpromising new renewable energy sources, <strong>and</strong> is deserving of further investment.Furthermore, the know-how is now available to combine existing technologies to utilisemarine current energy for power generation.It is likely that water turbines will initially be deployed in isl<strong>and</strong> or coastalcommunities with strong marine currents <strong>and</strong> which are isolated <strong>from</strong> national gridsystems, where they are most likely to offer a cost-effective alternative. However,marine currents have the potential to supply significant quantities of energy into thegrid systems of many countries. As interest grows, marine current energy is likely toplay an increasing role in complementing other energy technologies <strong>and</strong> contributing tothe future global energy supply mix. See World <strong>Energy</strong> Council report.3.4 Ocean currents developments <strong>and</strong> activitiesThe applications <strong>and</strong> activities in this sector are also divided according to thetechnology. We have two types: the applications that use the tidal energy in generatinga hydrostatic head hence needing a dam <strong>and</strong> the applications that use water turbines toharness the marine current kinetic energy.1) <strong>Tidal</strong> energy plantsi) La Rance in Bretagne, France: This is a major tidal generating station inoperation. It is a 240 MW (1megawatt= 1MW=1 million watts) at the mouth of LaRance River estuary on the northern coast of France. Note that a large coal or nuclearpower plant generates about 1000 MW of electricity. It has been in operation since1966 <strong>and</strong> has been a very reliable source of electricity. The energy resource is exactlypredictable relying of course on the tides. This plant was supposed to be one of manytidal power plants in France, until the nuclear program in that country was greatlyexp<strong>and</strong>ed in the late 1960’s.ii) Annapolis Royal <strong>Tidal</strong> Power plant, on the Annapolis river, Bay of Fundy, NS.This was designed as an experimental facility <strong>and</strong> is of the order of 20 MW. It is in32
operation since 1984. It would have been interesting to know the economics of the plantif it had more than one generating unit.iii) Murmansk tidal power plant: of the order of 0.4 MW. Not much is known aboutthis one.iv) Studies have been undertaken to examine the potential of several other tidalpower sites worldwide. It has been estimated that a barrage across the Severn River inthe west of Engl<strong>and</strong> could supply as much as 10% of that country’s electricity needs.(12 GW). The proposed facility on the Severn would have a construction cost of $15Billion . Similarly, several sites in Cook Inlet in Alaska <strong>and</strong> the White Sea in Russiahave been found to have potential to generate large amounts of electricity.2) Water turbines plants<strong>Marine</strong> current energy is at an early stage of development, with only a small numberof prototypes <strong>and</strong> demonstration units having been tested to date. There are nocommercial grid-connected turbines currently operating. A number of configurationshave been tested on a small scale that are essentially wind turbines adapted for themarine environment. Generally speaking, turbines are either of horizontal axis orvertical axis type. Variants of these two types have been investigated, includingturbines using concentrators or shrouds, <strong>and</strong> tidal fences.© World <strong>Energy</strong> Council.i) Horizontal axis turbines (axial flow turbine).This is similar in concept to the widespread horizontal axis wind turbine. Prototypeturbines of up to 10 kW have been built <strong>and</strong> tested using this concept. There arecurrently plans to install a demonstration machine of 300 kW off the south coast of theUnited Kingdom (MCT, 2000).Concentrators (or shrouds) may be used around the blades to increase the flow <strong>and</strong>power output <strong>from</strong> the turbine. This concept has been tested on a small scale in anumber of countries, including New Zeal<strong>and</strong> (Rudkin, 2001).More information on horizontal axis turbines <strong>and</strong> their use could be found in:http://www.europeanenergyfair.com/download/marine_current_turbines.pdfSee also <strong>Marine</strong> Current Turbines Ltd. information <strong>and</strong> their web site at:http://www.marineturbines.com/ . The company has been formed to developtechnology for exploiting flowing water in general <strong>and</strong> tidal streams in particular. Thegoal is both to arrive at cost-effective <strong>and</strong> reliable power systems <strong>and</strong> to develop thesecommercially on a large scale. This is being achieved through what they call a phasedR&D programme <strong>and</strong> in partnership with an industrial consortium together with variousstrategic partners who are shareholders in this company. According to their plan <strong>Marine</strong>Current Turbines Ltd has no intention of manufacturing the technology; this function isachieved by its partners <strong>and</strong> "third parties", but the company "does research theresource with a view to developing future projects". The company will develop, own<strong>and</strong> deliver the technology <strong>and</strong> the resource to go with it. The company's shareholdersconsist of the management, private investors <strong>and</strong> several corporate investors - namelySeacore Ltd., London Power Company plc, Carrs Milling plc <strong>and</strong> IT Power Ltd. Furtherdetails could be found <strong>from</strong> the company information site.From early December 2003, a tidal turbine or underwater windmill started running apower-generating propeller mounted on the seabed of the Kvalsund channel. The33
turbine is equipped with blades of 15-16m <strong>and</strong> has been connected to the nearby townof Hammerfest’s power grid in Northern Norway via a shore connecting cable. SeeFigure 3.4 <strong>and</strong> http://www.e-tidevannsenergi.com/index.htm. It will be imperative tofollow up on the study of the economics of the project.Fig. 3.4 Diagrammatic sketch of the underwater tidal current mill operating inKvalsund channel (~70 0 N) in Northern Norway since the fall of 2003.© World <strong>Energy</strong> Councilii) Vertical axis turbines (cross flow turbine).Both drag <strong>and</strong> lift turbines have been investigated, although the lift devices offermore potential. The best-known example is the Darrieus turbine with three or four thinblades of aerofoil cross-section. Some st<strong>and</strong>-alone prototypes have been tested,including a 5 kW Darrieus turbine in the Kurushima Straits, Japan. The concept ofinstalling a number of vertical axis turbines in a tidal fence is being pursued in <strong>Canada</strong>,with plans to install a 30 MW demonstration system in the Philippines (Blue <strong>Energy</strong>,2000).For more information see: www.bluenergy.com34
4. Transfer of power systems4.1 Interfaces4.2 Storage of energy4.3 Electric power generation <strong>and</strong> conversion4.4 Power transmission to the grid<strong>Waves</strong> or currents action has to be converted <strong>from</strong> one form to another form that isamenable for transmission <strong>and</strong>/or storage. Usually the harnessed energy is convertedinto electricity that is then either fed into a grid system or transformed into some otherform for storage purposes. Hence to achieve the first transformation, power transfersystems have to turn the slowly varying oscillating forces of incoming waves into thefast, unidirectional forces required to drive generators that will produce electricity.With very few exceptions most of the systems consists of a two-stage operation: amechanical rotary device coupled to an electrical generator. A wide range of options isavailable to convert <strong>and</strong> transfer energy. After the initial energy-harnessing device mostsystems will consist of a mechanical interface an electrical generator <strong>and</strong> a way fortransmission of power <strong>and</strong> deliver it to the grid.4.1 InterfacesThe following interfaces have been proposed, adapted or used.Direct mechanical interfaceOnly few designs for a pure mechanical power transfer have been proposed. Theyhave not been tested in practice. Haggerman (1995) <strong>and</strong> the European CommissionReview (1993) do not report these as options. Devising mechanical components toconvert the oscillating variable forces into RPM unidirectional output is difficult.Thorpe (1992) indicates that to deal with such large force will require large sizecomponents making the option uneconomic. Recently the following has been reported:The Wave Rotor: see Retzler (1996). This concept uses the Magnus effect on twocontra-rotating cylinders to absorb wave power. It has been tested on a small-scalemodel. The extrapolation to a full scale capability is unknown.The OLASS system: see Rebello et al (1995). This is an Oscillating Water Columndevice in which the energy is extracted through a float system on the oscillating watercolumn. This is then mechanically coupled to a generator. This is done by means ofwhat is called a mechanical rectifier <strong>and</strong> speed multiplier. A small prototype developedabout 15 kW. Few details are available.Air turbines interfaceA simple way of transforming the low velocities <strong>and</strong> high forces of air compressedby sea waves into high speeds <strong>and</strong> low forces required by conventional generators is35
provided by air turbines. They seem to fulfil the requirements of a power transfersystem. The combination of air column <strong>and</strong> turbine seem to provide a cost efficientapproach to gearing. The most popular air turbine is found to be the Wells turbine. Tohave the property to rotate in the same direction even when the direction of the air flowchanges the turbine uses symmetrical air foils with their chords being in the plane ofrotation. No pitch angles are proposed. Blades are hence cheap to manufacture incomparison <strong>and</strong> the losses are small during idling.Some of the configurations that are found in the literature include the following:Monoplane turbines: In steady air flow these turbines were found to have amaximum efficiency of about 60% in small scale testing in steady air flow. Monoplaneturbines with guide vanes: their efficiency can reach 70% in small scale testing <strong>and</strong>steady airflows. They have poorer behaviour against stall.Contra-rotating turbines: this configuration is made up of two Wells turbines placedclose together with their blades rotating in opposite directions. The efficiency about70% was found for small scale testing in steady airflows. A wider operating range isfound in this case in comparison to the ones with vanes.See Gato et al (1996, 1997).Efficiency measurements on Wells turbines (<strong>and</strong> any other turbines in that matter seebelow) under realistic oscillating flows is a priority area for further research work.Other air turbines configurations that have been considered:Variable pitch turbines: See European Commission pilot OWC in the Azores.Russel et al (1996).Impulse turbines: with adjustable guide vanesUse of valves: to allow some of the airflow to bypass the turbines hence avoidingstall. Valves can be used to delay the movement of the water column hence allowing itsvelocity to come into phase with the wave force. Better suited for hydraulic conversion.See Korde (2002).Water Turbines:In this sector of the industry these are considered to be a well-developed technology.The surrounding fluid provides a good supply of working fluid. The various designsproposed claim to offer control over the volume of water flow allowing the devise tomanage variations in wave power levels enabling relatively conventional electricalgenerators to be used.According to the European Commission report (1994) several types of turbine couldbe found specifically designed for different working heads or pressures.A summary of some of these water turbines is as follows:Pelton wheels:This configuration is suitable for high pressure operations. These include forexample:The original Bristol Cylinder with high pressure Pelton wheel36
The Hose-pump Swedish design with a high pressure Pelton wheel.Francis turbines:This configuration is suitable for medium pressure operationsKaplan turbines:This configuration is suitable for low pressure operations. These include for example:The Danish water pump with low pressure propeller,The Tapchan with low pressure Kaplan turbine.Two of these schemes The Tapchan <strong>and</strong> the Hose-pump have been successfullydemonstrated in pilot plants. In a sense showing that water turbines can be used in wavepower devices with little development providing well known problems in the use ofthese turbines are taken care of. Cavitation is the first that would come to the front.Hydraulic systemsFor several wave energy devices high pressure oil systems have been proposed <strong>and</strong>used. As part of power take-off technology these systems have the followingadvantages:They are capable of h<strong>and</strong>ling high power levels in a small volume.They can be made to adapt to various types of input motions (circular or linear) <strong>and</strong>so could be utilised on a range of types of devices.They can be computer controlled hence allowing optimization of the device on awave by wave basis.They can accommodate a wide range of input power levels.The reliability of hydraulic systems has been proven in their wide use in manyapplications. In wave energy harnessing systems they will be subject to much differentenvironments, namely:Hydraulic systems will be in contact with seawater. The design will have to prevent<strong>and</strong> make sure that seawater does not come in contact with the oil in the system.Corrosion problems <strong>and</strong> ways to mitigate with underwater systems specific problems ingeneral have been very well researched <strong>and</strong> studied within the Offshore Engineeringcommunity. Use of new materials like ceramics <strong>and</strong> ceramic coatings have provensuccessful in such applications.Hydraulic rams might be affected with high loads due to large displacements inextreme conditions. High dynamic loadings in general will have to be taken intoaccount.Some wave energy applications are predicting their operations under high torque <strong>and</strong>variable displacement. In general, current rotary hydraulic machinery applicationsoperate under relatively low torque <strong>and</strong> fixed displacement.Nebel (1992) describes the problems with control systems to optimize the capture <strong>and</strong>conversion efficiencies of wave energy schemes. Current methods of controllinghydraulic mechanisms could involve much power losses.The European <strong>Energy</strong> Programme (Russel <strong>and</strong> Diamantaras 1996, Eshan et al 1996)predicted the need to design tailor-made hydraulic systems <strong>and</strong> is an intrinsic part of theprogramme. However current hydraulic systems can be used in wave energy devices.Research in their efficiency <strong>and</strong> reliability will be needed.37
4.2 Storage of energyPower is proportional to velocity squared <strong>and</strong> the surface velocity of waves varieswith wave height <strong>and</strong> period of waves. Wave power subsequently is not steady <strong>and</strong>constant but varies significantly. This variation has an impact on the capital cost of awave power installation <strong>and</strong> its power losses. In general it is found that to facilitate theintegration of the system to the grid short-term energy storage is needed.For ocean waves systems the three main short-term energy storage are: the flywheel,pressure accumulators <strong>and</strong> water reservoirs.Flywheels provide energy storage in the form of rotational kinetic energy. They incursome losses. Found to be more efficient in large systems.Gas accumulators have been suggested <strong>and</strong> would use an inert gas contained in steelaccumulators to store energy in oil hydraulic systems. Gas is stored at high pressure <strong>and</strong>low volume <strong>and</strong> the energy is released as the gas exp<strong>and</strong>s to a greater volume <strong>and</strong> lowerpressure.Water reservoirs as in particular the Norwegian Tapchan systems could be used as ashort –term energy storage.Further details could be found in Edinburgh-Scopa-Laing 1979, Hotta 1996, Brook2003.There may also be the need to longer-term energy storage or energy transformationfor future use. Use of batteries <strong>and</strong> Hydrogen technology might then be included in theequation. This topic is beyond the scope of our discussion.4.3 Electric power generation <strong>and</strong> conversionPower generationElectrical generators are used to convert mechanical power at the shaft to electricalpower. For high conversion efficiency <strong>from</strong> wave energy to electrical energy withoutstorage large rotation differences are used in the turbine-generator system. Specialgenerators can be found to satisfy these requirements. Examples of these include multipolegenerators, linear generators <strong>and</strong> generators with reluctance changes. Lineargenerators are suitable for direct connection to the mechanical reciprocating motion ofwave energy systems. Research <strong>and</strong> Development in the field of linear generators <strong>and</strong>suitable electrical generation systems for the feasible applications here discussed areneeded.Power conversionTo get grid-quality power <strong>from</strong> ocean energy systems it might be required to convert<strong>from</strong> alternating current to direct current <strong>and</strong> vice-versa. A number of electric powerconversion methodology <strong>and</strong> designs have been put forward in projects, proposals <strong>and</strong>pilot schemes <strong>and</strong> cannot be extensively reviewed in the present report. The techniquesare based on previous developments in the electrical <strong>and</strong> electronics fields. This is anissue that must be addressed <strong>and</strong> reviewed by any future proposal <strong>and</strong> scheme.Agreements <strong>and</strong> discussions with hydro-power authorities <strong>and</strong> grid operators are also amust during the feasibility <strong>and</strong> development stages.38
See for example SEASUN (1988) <strong>and</strong> Beattie et al (2000) for detailed outlines <strong>and</strong>discussions of alternatives.Briefly we can classify the types of power conversion as follows: See Brooke (2003).i) Constant or nearly constant RPM power conversion<strong>and</strong> they are of two types: Synchronous generators <strong>and</strong> Asynchronous generators. SeeBrooke (2003).ii) Electronic power conversionHigh power electronics has been used to convert electrical power between AC <strong>and</strong> DC.AC systems of different frequencies can in general be connected. Configurations couldinclude a direct converter (AC/AC) or pass via a DC interconnection (AC/DC/AC).iii) Variable or free generator rpm power conversionLarge variations in RPM are possible through power electronics <strong>and</strong> using a DCinterconnection between the generator <strong>and</strong> the power grid. For low speeds or RPM agenerator is heavy <strong>and</strong> consequently expensive. The generator produces voltage thatwill be frequency <strong>and</strong> amplitude modulated by the r<strong>and</strong>om wave field <strong>and</strong> cannot bedirectly connected to the grid. The voltage variations are reduced in the DCinterconnection ig the DC voltage <strong>from</strong> several generators running at r<strong>and</strong>om RPM areadded in series.4.4 Power transmission to the gridThrough power collecting systems the converters are connected to the electrical gridon l<strong>and</strong>. Transmissions losses will have to be accounted for <strong>and</strong> are proportional to thedistance between the converters <strong>and</strong> the grid. The transmission to the grid is throughsea-floor cables. Hydraulic transfer may be possible depending on the distance notbeing large.Electrical transmissionElectrical transmission to the grid is a large topic <strong>and</strong> has been the object of study inelectrical engineering. Reviews could also be found for the application here discussedin SEASUN (1988). See also Brooke (2003) for more details. Also the reviews in Scott(2001) <strong>and</strong> Thorpe (1992) of the grid connection of large-scale ocean power projects<strong>and</strong> the transmission systems pertaining to UK specific projects are worth noting.Extensive experience exists in electrical cables laying in the sea using speciallydesigned vessels for this purpose. Power can be transmitted as AC or DC. The losses inthe cable transmission must be estimated <strong>and</strong> accounted for. Maintenance of the cablesare also issues to be studied. The need of electrical transformers to transfer powerbetween grids of different voltage levels might also arise. The design of the electricaltransmission system is a techno-economical problem of optimization, Brooke (2003).Ocean power generation <strong>and</strong> transmission would gain <strong>from</strong> the experience of windpower systems. In this case major short cuts in research <strong>and</strong> development could besaved <strong>and</strong> gained <strong>from</strong> cross-fertilization between the two applications. Worth checkingfor example the international company ABB <strong>and</strong> others for their experience <strong>and</strong>development of systems of power transmission for wind farms. See ABB (2002).39
Hydraulic transmissionIn some ocean energy schemes the secondary energy transformation is realized byeither water or hydraulic oil, Brooke (2003), CONA (2003). Hydraulic oil is normallyused internally in a wave power device while water can be pumped long distances inopen or closed systems. The Swedish hose-pump system is an example using sea waterin an open system The losses are proportional to velocity squared. Hence preference tolow flow velocities combined with high pressure.The point of the discussion is that those problems <strong>and</strong> issues of generation <strong>and</strong>conversion of the electrical power have to be discussed in the design <strong>and</strong> developmentstages of any project.5. Ocean (wave/current) Power Economics5.1 Factors affecting the evaluation of costs5.2 Capital <strong>and</strong> Operating costs of Ocean <strong>Energy</strong> systems5.3 Generation costs of wave <strong>and</strong> current energy5.4 Comparison with costs of other renewables <strong>and</strong> electricpower pricesThe commercial deployment of systems for harnessing wave energy is only justrecently tentatively beginning to happen. This is in spite of extensive work in research<strong>and</strong> development since the late seventies. In general it is considered that experience toenable the accurate assessment of the costing of such systems is lacking, Thorpe(1992), Brooke (2003). Hence an actual assessment of the degree of theircompetitiveness is difficult. No large-scale offshore ocean energy systems have beendeployed. Only prototypes have been installed giving also a much needed experience inmaking the economic evaluation. This chapter reviews some of the factors recognizedby industry to evaluate costs.5.1 Factors affecting the evaluation of costs of ocean energy systems.Usually developers of ocean energy systems define the cost of energy in cents perkilowatt-hour. The method for calculating this cost is, most of the time, not identified.Important financial assumptions are not reported. For example: rates of return, debt toequity ratio, discount rates if any, are not mentioned. Potential venture capital investorsfind it difficult to evaluate a project <strong>and</strong> viability in particular if no evaluation ofcompeting technologies or other appropriate benchmarks are available, Brooke (2003).A detailed analysis is beyond the scope of the present review. However the followingpoints are provided.The US Electric Power Research Institute in its Technical assessment Guide (EPRITAG), see Electric Power Institute 1987, 1993 <strong>and</strong> Hagerman 1995, provides what isbelieved, an accurate methodology for evaluating the costs of energy. They introducewhat is called a levelized cost of energy index that will allow also the comparisonbetween alternative designs or technologies.40
5.2 Capital <strong>and</strong> Operating costs of Ocean <strong>Energy</strong> systemsCapital costs usually include costs of construction, assembly <strong>and</strong> installation of theplant. Unfortunately no large-scale devices have been built. Currently available areprototypes <strong>and</strong> include all the additional costs involved in such a stage. Sources of costdata are hence difficult to find. Other similar or close to areas of activities in offshoreengineering could provide data that would help to calculate the capital costs of oceanenergy systems. Three approaches are found in that respect <strong>and</strong> are summarized below,see for example Brooke (2003) <strong>and</strong> Thorpe (1992).Costing by analogy: approximate costs estimates could be made <strong>from</strong> similarprojects. Adjustments must obviously be made to take care of relative sizes or othercharacteristics. Finding remotely related systems is more likely because of the scarcityof ocean energy systems.Conventional costing estimate: this is sometimes defined as a bottom-up costingmethod. In this case detailed information about the project are needed, <strong>from</strong> drawings<strong>and</strong> construction plans. Hence a complete work breakdown structure could bedeveloped with units rates for every component. In general some aspects of the systemusing st<strong>and</strong>ard current technology in civil <strong>and</strong> offshore engineering would be amenablefor such costing. Compatibility between costs for different systems <strong>and</strong> by differentevaluators would be difficult.Parametric costing estimate: this method is intermediate between the two describedabove. It relies on that some functional relationship between characteristics of an itemof the system <strong>and</strong> its cost. This direct dependency is generally derived <strong>from</strong> pastexperience <strong>and</strong>/or engineering practice. These relationships are similar to those usedalso in methodology ii) above. This means that it requires also outline drawings <strong>and</strong>specifications together with rates for materials, labor <strong>and</strong> transport. Information isavailable in general except perhaps for some aspects of the wave energy devicecomponents. Thorpe 1992 suggests that this is the method suitable for <strong>and</strong> employed tomake estimates of costing of ocean energy related projects.Table 5.1 Cost <strong>and</strong> Performance characteristics of generic wave energy systems(Source: Thorpe 2000)Cost <strong>and</strong> Performance Shoreline Near-shore OffshoreUnit Costs ($/kW) 1800-2100 1500-1800 1500-3000O&M & Insurance Costs ($/kW/year) 30-45 42-48 30-90Availability 94-96 93-96 90-95Annual Output (kWh/kW) 2000-2500 2200-2500 3000-400041
5.3 Generation costs of wave energyFor any application the determining factors are the cost per kW of the deliveredsystem or the cost per kW-hour of the delivered energy whether in the form of electricalenergy production or in kind, McCormick <strong>and</strong> Kraemer 2002. Thorpe (1998, 2000) hascompared the cost efficiencies of various wave energy conversion technologies. Asmentioned above he has divided the systems into shoreline, nearshore <strong>and</strong> offshoresystems. He found that the more recent designs both shoreline <strong>and</strong> offshore devices canproduce electricity at less than 0.1 US$ per kW. Figure 5.1 shows an unraveled designspiral as suggested by Thorpe. The figure demonstrates the cost cycling of the designprocess in time.Costestimates123456213456234561 Initial concept 2 Technical <strong>and</strong> Economic Feasibility Study3 Preliminary Design <strong>and</strong> Cost Analysis 4 Design Alterations5 Cost Analysis 6 Design AdoptionsFigure 5.1Unraveled Design-Cost Spiral for an Ocean <strong>Energy</strong> SystemSource: Thorpe 2000Also it shows the improvement in the cost estimates as time <strong>and</strong> more analysis isperformed. Table 5.1 shows the predicted costs <strong>and</strong> performance for generic types ofwave energy devices, Thorpe 2000. Thorpe 1998, also shows independently predictedelectricity generating costs of nearshore (including onshore) <strong>and</strong> offshore systemsagainst the year in which the device was designed. These costs are shown to be sitespecific <strong>and</strong> show reduction to approximately 7 cents/kWh in 2000 for both categories at8% discount rate over the lifetime of the scheme.time42
Evolution of electricity cost for onshore <strong>and</strong> nearshoresystems. Source: Thorpe (2000)NEL OWC Wavegen’s OSPREY Wavegen’s LIMPETCost of electricity (p/kWh)201510501980 1985 1990 1995 2000 2005Design yearFigure 5.2 Examples of Evolution of electricity cost for onshore <strong>and</strong> nearshore systems. SourceThorpe 2000.Evolution of electricity costs for offshore systems.Source: Thorpe (2000)Cost of electricity (p/kWh)1001011980198219851986199019921995199820002005Edinburgh DuckBristol CylinderSEA ClamPS FrogMcabe Wave PumpSloped IPS BuoyFigure 5.3 Examples of Evolution of electricity cost for offshore systems.Source Thorpe 2000.Apart <strong>from</strong> the schemes analyzed in Figure 5.2 <strong>and</strong> 5.3 there are also other systemsthat claim to be able to produce electricity at similar costs levels. This indicates thatwith a suitable climate generating costs of 3.5-8 c/kWh should be achievable. These43
systems have not been evaluated independently or else they are still in the early stagesof R&D. Therefore their costs <strong>and</strong> performance are subject to considerable uncertainty.Brooke (2003), Sjostrom et al 1996, Thorpe (1997).In Figure 5.4 below we present a plot of the resulting costs against the year in whichthe design of a device was completed. The graph is provided by the European ThematicNetwork on Wave <strong>Energy</strong>. See their report Wave <strong>Energy</strong> Utilization (2002). Itcomplements the information in Figures 5.2 <strong>and</strong> 5.3 above in that it shows forcomparison the average electricity price of wind generated electricity in the EU. At bestthe improvement in wave energy cost is similar to improvement of generating costs ofwind turbines.Figure 5.4 Predicted Electricity cost for Wave <strong>Energy</strong> Technologies (Source: European ThematicNetwork on Wave <strong>Energy</strong> <strong>and</strong> Wave <strong>Energy</strong> Utilization in Europe report 2002)In general, the economics of wave energy have shown a gradual improvement withtime. See Thorpe (1998), Brooke (2003) <strong>and</strong> the figures above. Developing moreunderst<strong>and</strong>ing due to continual R&D results in reduced capital costs. This trend is alsofound in other emerging technologies. Falnes (1996) shows that a funding for R&D isrequired to bring wave energy converters to a commercial level. When this level hasbeen achieved then the potential for selling ocean energy systems in a huge marketlargely increases.Recently there are systems that propose the utilization of wave energy in conjunctionwith wind energy. These systems will then be capable of harnessing two sources ofenergy giving more flexibility in the power production. Multi device approach to oceanenergy exploitation might be the way of the future. It must be noted that these are stillvery much site dependent. Generating costs estimates will have in this case to be higherthan individual devices.Figure 5.5 <strong>from</strong> Hagerman (1995), shows a sketch of a capital cost learning curve<strong>and</strong> how R&D <strong>and</strong> experience gained in successive developments affect in time capitalcosts reducing it to a mature plant cost level.44
Figure 5.5 Hagerman (1995) sketch of a capital cost learning curve.In general the capital costs of the first individual scheme will be much higherbecause: See Hagerman (1995), Brooke (2003).• of technical innovation <strong>and</strong> immaturity. However, following a learning curve<strong>and</strong> gaining the experience the benefits follow.• of the perception of initial risk. Again this perception will initially inflate thecosts.• of the large mobilization <strong>and</strong> demobilization costs. These are accounted for onthe costs of a single device. These costs would be defrayed over a number offollowing up schemes.• initially the economies of scale are lacking. Hagerman (1995)The generating costs could, for the above reasons, be as much as twice or more than thecosts mentioned in Figures 5.2, 5.3 <strong>and</strong> 5.4.5.4 Comparison with costs of other renewables <strong>and</strong> electricity pricesThe costs of electricity <strong>from</strong> renewable resources are function of many factorsincluding:• The type of energy source <strong>and</strong> its availability.• The type of device that harnesses the energy• The efficiency of the plant• The site location.45
Unless a particular plant or project <strong>and</strong> device are specified it is very difficult to havedefinitive costs for the electricity generation. Table 5.2 below presented at the 1993World <strong>Energy</strong> Congress (Brooke, 2003) is a representing of some estimates of costs perkWh for a number of alternative renewable energy resources. The installations thatcombine both wind <strong>and</strong> ocean energy whether <strong>from</strong> waves or currents should beeconomically competitive with systems harnessing only onshore wind.Table 5.2 Typical costs of electricity <strong>from</strong> some renewable sourcesSource: World <strong>Energy</strong> Congress 1993, Thorpe 1995, Brooke 2003.System Location Date Cost (c/kWh)Solar thermal;parabolic trough New Mexico, USA 2020 7.5-11Solar Thermal; parabolic dish New Mexico, USA 2020 6.0-10Solar thermal; Central receiver New Mexico, USA 2020 5.0-9.0Photovoltaic New Mexico, USA 2020 5.0-14Photovoltaic, thin film New Mexico, USA 2020 6.0-10Photovoltaic, multiple thin film New Mexico, USA 2020 4.0-7.0Wind turbine (6-9 m/s wind spd.) - 1995 3.6-6.5Wind turbine (6-9 m/s wind spd.) - 2000 3.0-5.5Wind turbine (6-9 m/s wind spd.) - 2010-2020 2.0-4.5Combined wind-wave system South Korea 1995 11.0-18.0Combined wind-wave system UK 1995-1999 6.0-9.0Comparison with electricity pricesAnother way of evaluating the economics <strong>and</strong> competitiveness of ocean energysystems is to compare the costs of electrical generation <strong>from</strong> ocean systems against theprices that customers pay for electricity. It might become increasingly relevantespecially that local communities might be interested to invest in small local systems.The location of such communities <strong>and</strong> the lack there off of grid hook up whileproximity of ocean energy resource might be a decisive factor. The ocean energy couldthen compete with diesel generation or might in the presence of the latter complementit.Table 5.3 shows some examples of electricity prices in the USA, Japan <strong>and</strong> the UK.They are representative of prices in the industrialized countries. Note the prices ofelectricity to households. These prices would be higher in remote communities. <strong>Energy</strong><strong>from</strong> the ocean might be competitive with electricity purchased by households.Table 5.3 Electricity prices in some industrialized countries. (Source: Brooke 2003)Country & Date Source reference Categories Cost (cent/kWh)USA – 1994 IEA 1994 Price to industry 4.7USA 1994 IEA 1994 Price to households 8.4Japan 1993 IEA 1994 Price to households 14-24UK 1995 DTI 1996 Price to industry 6.4UK 1995 DTI 1996 Price to households 8-13.446
6. R&D programmesR&D in ocean energy harnessing is ongoing in several countries around the world.See for example the International <strong>Energy</strong> Agency Annual Report (2003) onImplementing an Agreement on Ocean <strong>Energy</strong> Systems for further details. An overviewis here presented of some Canadian activities that came to the attention of the presentreviewer. This chapter should be upgraded for up to date information <strong>and</strong> the inclusionwhat other countries are specifically doing. Section 3.2 above lists related activitiesfound around the world.6.1 <strong>Canada</strong>Ocean Wave <strong>Energy</strong>As reported by the International <strong>Energy</strong> Agency (2003) <strong>Canada</strong>’s coastlines havefavourable wave energy resources. In 1995 Powertech Labs Inc. carried out a waveenergy resource assessment for the coast of BC based on the wave records obtained by<strong>Marine</strong> Environment data Services. See Bhuyan et al 1995. The result of the assessmentrecognizes that the most promising resources would be found in the Queen CharlotteSound <strong>and</strong> on the West Coast of Moresby <strong>and</strong> Graham Isl<strong>and</strong>. The "Green ElectricityResource Map" recently issued by BC Hydro shows an average wave power level of 33kW/m along the west coast of Vancouver Isl<strong>and</strong>. (International <strong>Energy</strong> Agency 2003)The total incident wave power for the west coast of Vancouver Isl<strong>and</strong> is estimated to be8.25 GW. A wave energy resource map for BC can be viewed at the CanadianCartographics Ltd. web site: http://www.canmap.com/index.htm.BC Hydro has initiated a pre-feasibility assessment of the potential for thedevelopment of wave energy resources in 2000. This has been done with theencouragement obtained by the rising electricity dem<strong>and</strong> <strong>and</strong> inline with a voluntarycommitment to meeting 10% of increased dem<strong>and</strong> through a variety of new greenenergy sources. Two specific sites in Ucluelet <strong>and</strong> Winter Harbour have been identifiedeach with over 200MW of potential wave power capacity. In 2001BC Hydro selectedUcluelet site as the initial as the initial site for the wave demonstration projects inVancouver Isl<strong>and</strong>. The International <strong>Energy</strong> Agency reports that presently waveparameters near the Ucluelet site are being monitored using a moored tri-axis buoy.Also in the report is that BC Hydro has signed memor<strong>and</strong>um of underst<strong>and</strong>ing withEnergetech of Australia <strong>and</strong> Ocean Power Delivery (UK) to build two demonstrationplants in 2004, both through joint ventures. Each of the plants will have installedcapacity of 2MW. It is intended that both of these demonstration plants be connected tothe existing grid of BC Hydro.The report goes on to say that on the east coast in the Maritimes, NS, the Wavemill<strong>Energy</strong> Corp is marketing a wave energy converter called "wavemill" with a patentedsuction chamber capable of being factory produced as an off the shelf unit. Seehttp://www.wavemill.com/products.htm .A series of performance trials of a wave mill device were conducted in 1998 at theHydraulic Laboratory of NRC.47
Presently at the NRC Institute for Ocean Technology computational tools are beingdeveloped for modelling the generation <strong>and</strong> propagation of non-linear, regular <strong>and</strong>irregular steep waves in infinite <strong>and</strong> finite depths. The computations also allow theaccurate calculation of wave energy flux in various sea states <strong>and</strong> the modeling of theinteractions between the component waves. See Appendix 3 for examples of recentpublications on that subject.<strong>Tidal</strong> current energyAs part of BC Hydro’s initiatives on green energy technologies, the feasibility ofexploiting tidal current as one of the energy resources has been examined by TritonConsultants in 2002. See Triton Consultants 2002. The report is available on BC hydroweb site. See http://www.bchydro.com/. A tidal resource map again could be found atCanadian Cartograhics Ltd. The resource assessment identified 55 sites with currentspeeds over 2m/s, which would yield a gross annual energy potential in the order of20,000 GWh. Twelve specific sites identified considering the deployment feasibilitywith a total energy production of 2,700 GWh per year.Blue <strong>Energy</strong> <strong>Canada</strong> a BC company is looking for financing for a tidal currentdemonstration project using heir technology particularly for a tidal fence concept. TheInternational <strong>Energy</strong> Agency report that they have through their previous associationwith another company undertaken some laboratory trials on Darrieus-type underwatervertical–axis turbines, often called Davis turbines.http://www.bluenergy.com/oceanenergy.htmlAnother BC company called Clean Current has undertaken numerical <strong>and</strong>experimental hydrodynamic design on the ducted horizontal axis turbines <strong>and</strong> hasdeveloped two innovative ideas related to electricity generation <strong>and</strong> turbine design. Amodel of the turbine has been tested.NRC's Institute for Ocean Technology (IOT) plans to develop a capability fortesting, performance evaluation <strong>and</strong> for R&D work on Ocean <strong>Energy</strong> Systems. TheDesign <strong>and</strong> Fabrication, testing facilities <strong>and</strong> numerical modeling capabilities makes ita one-stop shop for testing concepts <strong>and</strong> designs of such systems. http://www.nrccnrc.gc.ca/48
7. Timeline Proposal7.1 Ocean energy influential events7.2 A Timeline7.3 Scientific, technical, societal <strong>and</strong> economic challenges7.4 Constraints <strong>and</strong> opportunities7.1 Ocean energy influential events:• Kyoto 1997: to target to reduce GHG emissions.Agreement that set out those targets <strong>and</strong> the options available to countries to achievethem is known as the Kyoto Protocol: -6 percent goal below 1990 levels by the periodbetween 2008 <strong>and</strong> 2012.• Investment : <strong>Canada</strong> is investing $500M in Action Plan 2000. Plus $625M overfive years announced in Budget 2000 results a total commitment of $1.1Billion toaddress climate change over the next five years <strong>and</strong> builds on the $850M that <strong>Canada</strong>spent during the previous five years. Focus on climate change issues increases• Price of oil: Large increase in the price of oil <strong>and</strong> 9/11 syndrome• Environmental concerns: Societal changes <strong>and</strong> environmental concerns for thefuture are increasing. Awareness of related issues is increasing.49
7.2 A TimelineA T imelineNational Coordinator,E valuator & T es t Centre(NR C IOT )S horeline modelS horeline prototypedemons tratorNears hore modelNears hore prototypedemons trator20042005200620062009T echnology R es earch Programme& T echnology DevelopmentPhase IPhase IIHydrodynamicsHydrographic map: waves ,currents <strong>and</strong> iceHydrogen technologyDeployment, recoveryP ower technology: take offconvers ioncontroltrans mis s iontrans formationE conomicsF eas ibility <strong>and</strong> market analys isR eliability, MaintenancetechniquesNavigationA T imelineOffshore modelOffshore prototypedemonstrator20082010Phase IIINearshore <strong>and</strong> Offshore sitesprospectingWeather PredictionPower take off predictionPower storageMarket analysisSurvivabilityMooringCivil engineering, FoundationsSynergy with offshoreindustry…20yyT echnology Development50
NRC IOTIndustry, Government ,AcademiaNL WAVE POWER?Working Group onPolicy Statement onOcean <strong>Energy</strong> GenerationWorking Group onenvironmental issuesRefined Strategy onImpact AssessmentPublic Education <strong>and</strong>AcceptabilityMarket ExpansionOcean <strong>Energy</strong> T echnologyNetwork20042009Working Group on R&D & T echnologydevelopmentNational Coordinator, Evaluator & T estCentre (NRC IOT )Resource assessmentPrediction of wind, wave <strong>and</strong> currentresource; presence of iceL onger term weather forecast?Ocean energy prospecting.outputT echnologies neededData Acquisition T echniquesCable Network, Grid connectionSurface treatments, coatings, CorrosionNon-electrical outputs: hydrogenDesalination, others?Significant contribution to x% ofT otal <strong>Energy</strong> Generation20yyEnvironmental Impact ResearchThe above Timeline is a proposal for the development of an Ocean <strong>Energy</strong>Technology Network that would include Industry, Academia <strong>and</strong> Governmentdepartments in <strong>Canada</strong>. Of the latter it is proposed that the National Research Council<strong>and</strong> Industry <strong>Canada</strong> play a significant role. The Institute for Ocean Technology of theNational Research Council http://iot-ito.nrc-cnrc.gc.ca/about.html is well positioned tobe considered as the National Coordinator for the Evaluation <strong>and</strong> Testing of OceanSystems.Working groups should be developed to focus on the following tasks. The list is notintended to be exhaustive in any way <strong>and</strong> the list is not suggesting any priority. In factsome of the tasks will have to be worked upon in parallel. The following is adapted inpart <strong>from</strong> the Wave <strong>Energy</strong> Utilization report (2002) <strong>and</strong> the European Wave <strong>Energy</strong>Network on Wave <strong>Energy</strong>. See International <strong>Energy</strong> Agency Annual Report (2003).The purpose of the present exercise is to initiate discussions among the proponents ofsuch developments in <strong>Canada</strong> including industry, academia <strong>and</strong> government <strong>and</strong>regulatory departments.7.3 Scientific, Technical, Societal <strong>and</strong> Economic challenges of anOcean <strong>Energy</strong> Industry:The following list of issues to be addressed are necessary for the development ofOcean <strong>Energy</strong> harnessing activities. The following is adapted <strong>from</strong> the European51
Thematic Network on Wave <strong>Energy</strong> report: Wave <strong>Energy</strong> Utilization in Europe:Current Status <strong>and</strong> Perspective (2002). Included also is an exp<strong>and</strong>ed list of R&D issues<strong>and</strong> further comments on computational tools to complement any experimental physicalmodelling activities.1) R&D in Ocean <strong>Energy</strong> devices:- <strong>Waves</strong> <strong>and</strong> currents energy systems <strong>and</strong> devices status <strong>and</strong> R&Drequirements.- <strong>Tidal</strong> energy systems status <strong>and</strong> devices <strong>and</strong> R&D requirements.- Strategy <strong>and</strong> action plan for above.- Lessons learned <strong>from</strong> Offshore Industry (technology transfer) wouldbenefit ocean energy technology <strong>and</strong> its applications. Status <strong>and</strong>requirements. See also 2) below.- Scaled model <strong>and</strong>/or demonstration project developmentsrequirements.- Development of performance evaluation procedures.- Implement performance evaluation on specific concepts.2) Generic Technologies development:- Plant control <strong>and</strong> power output prediction- Plant monitoring <strong>and</strong> performance assessment- Loads <strong>and</strong> survivability studies- Maintenance <strong>and</strong> reliability studies- Modelling <strong>and</strong> st<strong>and</strong>ardised design methods <strong>and</strong> calculations- Experimental <strong>and</strong> mathematical modelling of systems <strong>and</strong> resourceestimation- Hydrographic analysis <strong>and</strong> mapping- Harsh environment in the ocean studies: waves, currents, tides <strong>and</strong>ice- Data base development <strong>and</strong> power prospecting- Experimental <strong>and</strong>/or numerical work of testing concepts modeling ofarrays of multiple wave <strong>and</strong> other energy devices, wave <strong>and</strong> energygeneration <strong>and</strong> propagation simulation.– Wave focusing <strong>and</strong> rogue wave simulation.– Real-time wave behavior forecasting– Mooring <strong>and</strong> long term fatigue of lines <strong>and</strong> connections– Cable construction, production, testing <strong>and</strong> laying offshore– Couplings for quick release <strong>and</strong> reattachment of mooring <strong>and</strong>cables– Flexible electrical connectors– Environmentally acceptable fluid for hydraulic systems– Power smoothing systems- Follow the advancement in hydrogen technology- International collaboration: attract prototype models to our shores,responding to Canadian-specific environment (ice).- Electrical power storage technology.52
- Control <strong>and</strong> transmission systems- Flexible electrical connectors- Environmentally acceptable fluid for hydraulic systems- Development of more efficient power generation units- Power conversion- Offshore control systems- Maintenance-free systems. Is it attainable?3) Cooperation with the Power Generation <strong>and</strong> Distribution Industry:- Development of safety st<strong>and</strong>ards.- Assessment of procedures, costs <strong>and</strong> facilities for power generation<strong>and</strong> transmission.- Development of power quality st<strong>and</strong>ards.- New regulatory <strong>and</strong> energy transfer regimes.4) Financing <strong>and</strong> Economic Issues:- Market status of ocean energy: feasibility <strong>and</strong> market analysis.- Economics of Ocean <strong>Energy</strong> whether <strong>from</strong> waves, wind or currents.- Financing of ocean energy projects issues.- Economic impact on environment <strong>and</strong> local communities.5) Social, institutional <strong>and</strong> environmental impact:- Planning considerations.- Environmental impact studies.- Institutional barriers studies <strong>and</strong> regulatory regimes.- Industrial benefit <strong>and</strong> job creation studies.6) Promotion of Ocean <strong>Energy</strong>:- Support for Ocean <strong>Energy</strong> events <strong>and</strong> meetings.- Publications in International Journals.- Dissemination of information <strong>and</strong> relevant material- Development of relevant web site.- Involvement with education curricula in schools, promotion ofrenewables in general <strong>and</strong> Ocean <strong>Energy</strong> in particular.Below are some comments on the need of accurate <strong>and</strong> robust computational modelsfor the optimization of the structural configurations <strong>and</strong> designs of Ocean energySystems. The need for resource estimation techniques was discussed in Sections 2 <strong>and</strong>3 of this report.The optimal structural configuration of an ocean energy system could be studied <strong>and</strong>is achievable by taking into consideration the complex interaction of the structure withthe environmental effects. These should include the effects in extreme <strong>and</strong> harshconditions of waves, currents, winds <strong>and</strong> ice (if present) as well as the seabed. Thisobjective can be achieved with good information on those environmental effects <strong>and</strong>robust analytical/computational techniques. Synergy with offshore engineering <strong>and</strong> thevast experience gained by this industry are critical. Fatigue of structural components<strong>and</strong> of the foundations/anchoring as well as the ultimate capacities are some of theissues. The dynamic excitation forces will have to consider the environmental loadingeffects due the wind, waves, currents, <strong>and</strong> possibly ice on the structure, the interaction53
etween the devices, their dynamic loading <strong>and</strong> the structure supporting it <strong>and</strong> the soilor seabed. Computational techniques of offshore or onshore structures in generalrequire the modeling of the structural responses, including dynamics of the structure,the evaluation <strong>and</strong> modeling of the environment <strong>and</strong> the accurate modeling of theinteraction of the structure with the soil through the foundation, whether it is gravitybased or flexibly moored. These are presently issues in offshore engineering R&D.7.4 Constraints <strong>and</strong> opportunities:Technological:In general the technology for wave energy <strong>and</strong> stream systems has yet to bedeveloped <strong>and</strong> proven at full size, particularly for the offshore wave systems<strong>and</strong> the variable-pitch vertical axis turbine tidal stream systems. There are noinsurmountable technological barriers to the deployment of such systems.Opportunities abound for innovation, R&D <strong>and</strong> synergy with the offshoreengineering industry.Financial, economical:There is a need for proven economics <strong>and</strong> resource assessment methodologies.Opportunities for investors are infinite <strong>and</strong> the market for renewables in general<strong>and</strong> the ocean energy resource in particular, will keep increasing.Institutional:A number of statutory bodies are involved in our coastline <strong>and</strong> surroundingwaters. The development of an Ocean <strong>Energy</strong> Industry will require an extensiveconsultation process.54
8. References[1] ABB (2002) http://www.abb.se (in Swedish)[2] Baddour, R.E. <strong>and</strong> Song, S.W. (1998). The rotational flow of finite amplitudeperiodic water waves on shear currents. Applied Ocean Research, 20, 163-171.[3] Baddour, R. E. <strong>and</strong> Song, S. (1990). On the interaction between waves <strong>and</strong>currents. Ocean Engineering, 17, 1-21.[4] Baddour, R. E. <strong>and</strong> Song, S. (1990). Interaction of higher order water waves withuniform currents. Ocean Engineering, 17, 551-568.[5] Bascom , W. (1980) <strong>Waves</strong> <strong>and</strong> beaches. Anchor Books, New York.[6] Beattie, W.C. et al (2000) Producing acceptable electrical supply quality <strong>from</strong> awave-power station. Proc. Third European Wave Power Conf., Patras, Greece,252-257.[7] Bernshtein, L.B., Wilson, E.M. <strong>and</strong> Song, W.O. (1997); <strong>Tidal</strong> Power Plants,Revised Edition; Korea Ocean Research <strong>and</strong> Development Institute, Korea.[8] Blue <strong>Energy</strong> <strong>Canada</strong> Inc. (2000); http://www.bluenergy.com ; <strong>Canada</strong>.[9] British Oceanographic Data Centre (1992) Wave Data Catalogue for EuropeanWater.[10] Brooke, J. (2003) Wave <strong>Energy</strong> Conversion. Elsevier Ocean Engineering, NewYork.[11] Budal, K <strong>and</strong> Falnes, J. (1975). A resonant point absorber of ocean wave power.Nature, 256, 478-479.[12] Bhuyan et al (1994). Powertech Inc. Assessment of Wave <strong>Energy</strong> Resources forthe West Coast of <strong>Canada</strong>, June 1994. Also http://www.powertech.bc.ca[13] Clancy, E.P. (1968) The tides: Pulse of the Earth, Doubleday <strong>and</strong> Co. New York.[14] Clement, A.H. et al (2002) Wave <strong>Energy</strong> in Europe- Current status <strong>and</strong>perspectives, Renewable <strong>and</strong> Sustainable <strong>Energy</strong> reviews, 6, 405-431.[15] Craton, W. (1992). Oceanography html site, Brock University[16] Department of Trade <strong>and</strong> Industry (1999); New <strong>and</strong> Renewable <strong>Energy</strong>: Prospectsin the UK for the 21 st Century: Supporting Analysis; ETSU R-122, UnitedKingdom; www.dti.gov.uk/renewable/index.html.55
[17] EECA <strong>and</strong> CAE (1996); New <strong>and</strong> Emerging Renewable <strong>Energy</strong> Opportunities inNew Zeal<strong>and</strong>; Christchurch, New Zeal<strong>and</strong>; www.eeca.govt.nz/default.asp;www.cae.canterbury.ac.nz/cae.htm.[18] E&PDC (Engineering & Power Development Consultants Ltd) (1993); <strong>Tidal</strong>Stream <strong>Energy</strong> Review; ETSU T/05/00155/REP, United Kingdom.[19] European <strong>Energy</strong> Conferences Proceedings. (1998) <strong>and</strong> subsequent.[20] European Thematic Network on Wave <strong>Energy</strong> (2002) Wave energy utilization inEurope report: current status <strong>and</strong> perspective, Centre for Renewable <strong>Energy</strong>Sources (CRES).[21] Eshan, M. et al. (1996). Simulation <strong>and</strong> dynamic response of computer controlleddigital hydraulic pump/motor use in wave power conversions. Proc. Sec.European Wave Power Conf., Lisbon, Portugal, 305-311.[22] FMP (Foresight <strong>Marine</strong> Panel) (1999); Energies <strong>from</strong> the Sea – Towards 2020; A<strong>Marine</strong> Foresight Report, United Kingdom.[23] Falnes. J. (1996). A crude estimate of benefit-cost ratio for utilization of the waveenrgy of the world’s oceans. Proc. Sec. European Wave Power Confernece,Lisbon, Portugal, 102-104.[24] Falnes, J. (2000) Optimum control of oscillation of wave-energy converters. Int. J.Offshore & Polar Engineering, 12, 147-155.[25] Falnes, J. <strong>and</strong> Budal, K. (1982) Wave power absorption by parallel rows ofinteracting oscillating bodies. Applied Ocean Research, 4, 194-207.[26] Fraenkel, P.L. (1999); <strong>Tidal</strong> <strong>Currents</strong>: A Major New Source of <strong>Energy</strong> for theMillennium; Sustainable Developments International, United Kingdom.[27] Gato, L.M.C. et al (1996). Performance of a high-solidity Wells turbinefor OWCpower plant. Trans. ASME, J. <strong>Energy</strong> ResourcesTechnology, 118, 263-268.[28] Gato, L.M.C. <strong>and</strong> Curren, R. (1997). The energy conservation performance ofseveral types of Wells turbine designs. Proc. I. Mech. E. Part A, J. PowerEngineering, 211, 133-145.[29] Gorlov, A. <strong>and</strong> Rogers, K. (1997); Helical Turbine as Undersea Power Source;Sea Technology, United States.[30] Hagerman, G. (1992) Wave resource assessment review <strong>and</strong> evaluation. Incomprehensive review <strong>and</strong> analysis of Hawaii’s renewable <strong>Energy</strong> assessments.State of Hawaii Department of Business, Economic Development <strong>and</strong> Tourism,Honolulu, Hawaii.56
[31] Hagerman, G. (1995) A st<strong>and</strong>ard economic assessment methodology forrenewable ocean energy projects. Proceedings of the Interantional Symposium onCoastal Ocean Space Utilization, COSU 1995,129-138.[32] Hagerman,G. (1996) Wave power: an overview of recent internationaldevelopment <strong>and</strong> potential US projects. Proceedings of the 1996 AnnualConference, American Solar <strong>Energy</strong> Society, North Carolina, 195-200.[33] International <strong>Energy</strong> Agency (2002) <strong>Renewables</strong> in Global <strong>Energy</strong> Supply.[34] International <strong>Energy</strong> Agency (2003) Implementing Agreement on Ocean <strong>Energy</strong>Systems, Annual Report .[35] Institute for Ocean Technology, National research Council <strong>Canada</strong>, 2004,http://iot-ito.nrc-cnrc.gc.ca/about.html[36] Kinsman, B. (1984) Wind <strong>Waves</strong>, Their generation <strong>and</strong> propagation on the OceanSurface, Dover Publications, New York.[37] Korde, U.A. (2002). Active control in wave energy conversion. Sea Technology,43, 47-52.[38] Leishman, J.M. <strong>and</strong> Scobie, G. (1976) The development of wave power – a technoeconomical study. Department of Industry, NEL report EAU M25.[39] Lewis, T. (1985) Wave energy Evaluation for C.E.C., EUR982EN.[40] Mellor,G.L.(1996) Introduction to Physical Oceanography. Springer Verlag,NewYork.[41] MCT (<strong>Marine</strong> Current Turbines Ltd) (2000); www.marineturbines.com; UnitedKingdom.[42] Nebel, P.(1992) Maximizing the efficiency of wave energy plants using complexconjugatecontrol. Proc. I. Mech E. Journal of Systems <strong>and</strong> Control, 206, 225-236.[43] Open University (1989); <strong>Waves</strong>, Tides <strong>and</strong> shallow water processes; PergamonPress, United Kingdom.[44] Preliminary Actions in Wave <strong>Energy</strong> (1993). Wave studies <strong>and</strong> deevlopemnt ofresource evaluation methodology, The European Economic Communities, DGXII, Final report.[45] Rebello, L. et al (1996). 1996 Project OLASS 1000-experiences, modelling <strong>and</strong>results. Proc. Second European Wave power Conference, Lisbon, Portugal, 312-319.[46] Retzler, C.H. (1996). The wave rotor.57
Proc. Second European Wave power Conference, Lisbon, Portugal, 312-319.[47] Rudkin, E.J. <strong>and</strong> Loughman, G.L. (2001). Vortec – the marine enrgy solution.<strong>Marine</strong> Renewable <strong>Energy</strong> Conference 2001; Newcastle, United Kingdom.[48] Russel, A. <strong>and</strong> Diamantaras, K. (1996) The European Commission Wave <strong>Energy</strong>R&D Programme. Proc. Second European Wave Power Conference, Lisbon,Portugal, 8-11. G. Elliot <strong>and</strong> Diamantaras, K. editors.[49] SEASUN Power Systems (1988). Power conditioning <strong>and</strong> transmission, waveenergy resource <strong>and</strong> technology assessment for coastal North Carolina. FinalReport. North Carolina Alternative <strong>Energy</strong> Corporation & Virginia Power.[50] Scott, N.C. (2001) Grid connection of large-scale wave energy projects. Proc.Fourth European Wave Power Conf., Aalborg, Danemark. 88-92.[51] Southgate, H.N. (1987) Wave prediction in deepwater <strong>and</strong> at the coastline, HRreport #SR114.[52] Southgate, H.N. (1993) The use of wave transformation models to evaluateinshore wave energy resource. Proc. First European Symposium on Wave <strong>Energy</strong>,Edinburgh, UK.[53] Thorpe, T.W. (1999) An overview of wave enrgy technologies: status,performance <strong>and</strong> costs. Proceedings, International One day Seminar, Institution ofMechanical Engineers, London UK.[54] Thorpe, T.W. (1999) A brief overview of wave energy. ETSU report R-120.Department of Trade <strong>and</strong> Industry, UK.[55] Thorpe, T.W. (1992) A review of wave energy. ETSU Report R-72, 1, Departmentof Trade <strong>and</strong> Industry, UK.[56] Thorpe, T.W. (1999) A brief overview of wave energy. ETSU Report R-120.Department of Trade <strong>and</strong> Industry, UK.[57] Thorpe, T.W. (1999) An evaluation of wave energy. ETSU Report AEAT/R0400. Dpartment of Trade <strong>and</strong> Industry, UK[58] University of Edinburgh, Wave Power Group. 2000.www.mech.ed.ac.uk/research/wavepower/[59] Various authors. 1993 Preliminary design <strong>and</strong> model test of a wave powerconverter: Budal 1978 Design type E. Technical reports compiled by Falnes, J.,Department of Physics, NTSU, Trondheim, Norway.58
[60] WATTS (2003, 2004). Wave <strong>and</strong> <strong>Tidal</strong> Technology Symposium Proceedings.[61] Wavegen. (2000) [62] Wave Mill <strong>Energy</strong> Corp (2004) http://www.wavemill.com/products.htm[63] World <strong>Energy</strong> Council (2004) http://www.worldenergy.org/wec-geis[64] World <strong>Energy</strong> Council (2000) http://www.worldenergy.org/wecgeis/publications/reports/etwan/execsummary/exec-summary.asp9. Recent scientific <strong>and</strong> technical research bibliographyTheme: Ocean <strong>Energy</strong> related topicsOcean Engineering - From 1995-2004D. C. Hong, S. Y. Hong <strong>and</strong> S. W. Hong, Numerical study of the motions <strong>and</strong> drift force of a floatingOWC device, Ocean Engineering, Volume 31, Issue 2, February 2004, Pages 139-164.E. Vijayakrishna Rapaka, R. Natarajan <strong>and</strong> S. Neelamani, Experimental investigation on the dynamicresponse of a moored wave energy device under regular sea waves, Ocean Engineering, In Press,Corrected Proof, Available online 2 December 2003.Y. M. C. Delauré <strong>and</strong> A. Lewis, 3D hydrodynamic modelling of fixed oscillating water column wavepower plant by a boundary element methods, Ocean Engineering, Volume 30, Issue 3, February 2003,Pages 309-330.Paolo Boccotti, On a new wave energy absorber, Ocean Engineering, Volume 30, Issue 9, June 2003,Pages 1191-1200.Umesh A. Korde, Latching control of deep water wave energy devices using an active reference, OceanEngineering, Volume 29, Issue 11, September 2002, Pages 1343-1355.W. E. Rogers, J. M. Kaihatu, H. A. H. Petit, N. Booij <strong>and</strong> L. H. Holthuijsen, Diffusion reduction in anarbitrary scale third generation wind wave model, Ocean Engineering, Volume 29, Issue 11, September2002, Pages 1357-1390.A. Brito-Melo, L. M. C. Gato <strong>and</strong> A. J. N. A. Sarmento, Analysis of Wells turbine design parameters bynumerical simulation of the OWC performance, Ocean Engineering, Volume 29, Issue 12, September2002, Pages 1463-1477.A. F. de O. Falcão, Wave-power absorption by a periodic linear array of oscillating water columns,Ocean Engineering, Volume 29, Issue 10, August 2002, Pages 1163-1186.D. J. Wang, M. Katory <strong>and</strong> Y. S. Li, Analytical <strong>and</strong> experimental investigation on the hydrodynamicperformance of onshore wave-power devices, Ocean Engineering, Volume 29, Issue 8, July 2002, Pages871-885.59
S. Neelamani <strong>and</strong> M. Vedagiri, Wave interaction with partially immersed twin vertical barriers, OceanEngineering, Volume 29, Issue 2, February 2002, Pages 215-238.Ruo-Shan Tseng, Rui-Hsiang Wu <strong>and</strong> Chai-Cheng Huang, Model study of a shoreline wave-powersystem, Ocean Engineering, Volume 27, Issue 8, August 2000, Pages 801-821.A. F. de O. Falcão <strong>and</strong> P. A. P. Justino, OWC wave energy devices with air flow control, OceanEngineering, Volume 26, Issue 12, December 1999, Pages 1275-1295.U. A. Korde, Efficient primary energy conversion in irregular waves, Ocean Engineering, Volume 26,Issue 7, July 1999, Pages 625-651.Applied Ocean Research - 1995-2004José Perdigão <strong>and</strong> António Sarmento, Overall-efficiency optimisation in OWC devices, Applied OceanResearch, Volume 25, Issue 3, June 2003, Pages 157-166.Umesh A. Korde, Systems of reactively loaded coupled oscillating bodies in wave energy conversion,Applied Ocean Research, Volume 25, Issue 2, April 2003, Pages 79-91.A. F. de O. Falcão <strong>and</strong> R. J. A. Rodrigues, Stochastic modelling of OWC wave power plant performance,Applied Ocean Research, Volume 24, Issue 2, April 2002, Pages 59-71.A. F. de O. Falcão, Control of an oscillating-water-column wave power plant for maximum energyproduction, Applied Ocean Research, Volume 24, Issue 2, April 2002, Pages 73-82.U. A. Korde, On providing a reaction for efficient wave energy absorption by floating devices, AppliedOcean Research, Volume 21, Issue 5, October 1999, Pages 235-248.H. Eidsmoen, Tight-moored amplitude-limited heaving-buoy wave-energy converter with phase control,Applied Ocean Research, Volume 20, Issue 3, June 1998, Pages 157-161.M. Greenhow <strong>and</strong> S. P. White, Optimal heave motion of some axisymmetric wave energy devices insinusoidal waves, Applied Ocean Research, Volume 19, Issues 3-4, June-August 1997, Pages 141-159.Umesh A. Korde, Performance of a wave energy device in shallow-water nonlinear waves: part I,Applied Ocean Research, Volume 19, Issue 1, February 1997, Pages 1-11.Umesh A. Korde, Performance of a wave energy device in shallow-water nonlinear waves: part II,Applied Ocean Research, Volume 19, Issue 1, February 1997, Pages 13-20.K. Thiruvenkatasamy <strong>and</strong> S. Neelamani, On the efficiency of wave energy caissons in array, AppliedOcean Research, Volume 19, Issue 1, February 1997, Pages 61-72.S. A. Mavrakos <strong>and</strong> P. McIver, Comparison of methods for computing hydrodynamic characteristics ofarrays of wave power devices, Applied Ocean Research, Volume 19, Issues 5-6, October-December1997, Pages 283-291.J. R. Chaplin <strong>and</strong> C. H. Retzler, Predictions of the hydrodynamic performance of the wave rotor waveenergy device, Applied Ocean Research, Volume 17, Issue 6, December 1995, Pages 343-347.P. McIver <strong>and</strong> M. McIver, Wave-power absorption by a line of submerged horizontal cylinders, AppliedOcean Research, Volume 17, Issue 2, 1995, Pages 117-126.60
Coastal Engineering - 1995-2004Jaak Monbaliu, Roberto Padilla-Hernández,Julia C. Hargreaves, Juan Carlos Carretero Albiach, WeiminLuo, Mauro Sclavo <strong>and</strong> Heinz Günther, The spectral wave model, WAM, adapted for applications withhigh spatial resolution, Coastal Engineering, Volume 41, Issues 1-3, September 2000, Pages 41-62.T. C. Lippmann, A. H. Brookins <strong>and</strong> E. B. Thornton, Wave energy transformation on natural profiles,Coastal Engineering, Volume 27, Issues 1-2, May 1996, Pages 1-20.Renewable <strong>Energy</strong> - 1995-2004A. Thakker <strong>and</strong> T. S. Dhanasekaran, Computed effects of tip clearance on performance of impulseturbine for wave energy conversion, Renewable <strong>Energy</strong>, Volume 29, Issue 4, April 2004, Pages 529-547.Ajit Thakker <strong>and</strong> Fergal Hourigan, Modeling <strong>and</strong> scaling of the impulse turbine for wave powerapplications, Renewable <strong>Energy</strong>, Volume 29, Issue 3, March 2004, Pages 305-317.T. Setoguchi, Y. Kinoue, T. H. Kim, K. Kaneko <strong>and</strong> M. Inoue, Hysteretic characteristics of Wells turbinefor wave power conversion, Renewable <strong>Energy</strong>, Volume 28, Issue 13, October 2003, Pages 2113-2127.A. S. Bahaj <strong>and</strong> L. E. Myers, Fundamentals applicable to the utilisation of marine current turbines forenergy production, Renewable <strong>Energy</strong>, Volume 28, Issue 14, November 2003, Pages 2205-2211.Mats Leijon, Hans Bernhoff, Marcus Berg <strong>and</strong> Olov Ågren, Economical considerations of renewableelectric energy production--especially development of wave energy, Renewable <strong>Energy</strong>, Volume 28,Issue 8, July 2003, Pages 1201-1209.T. Setoguchi, S. Santhakumar, M. Takao, T. H. Kim <strong>and</strong> K. Kaneko, A modified Wells turbine for waveenergy conversion, Renewable <strong>Energy</strong>, Volume 28, Issue 1, January 2003, Pages 79-91.Wibisono Hartono, A floating tied platform for generating energy <strong>from</strong> ocean current, Renewable<strong>Energy</strong>, Volume 25, Issue 1, January 2002, Pages 15-20.T. Setoguchi, S. Santhakumar, H. Maeda, M. Takao <strong>and</strong> K. Kaneko, A review of impulse turbines forwave energy conversion, Renewable <strong>Energy</strong>, Volume 23, Issue 2, June 2001, Pages 261-292.Fern<strong>and</strong>o Ponta <strong>and</strong> Gautam Shankar Dutt, An improved vertical-axis water-current turbineincorporating a channelling device, Renewable <strong>Energy</strong>, Volume 20, Issue 2, June 2000, Pages 223-241Apparatus for dissipating wave energy : Dorrell Donald E Rarotonga 01, Cook Isl<strong>and</strong>, Renewable<strong>Energy</strong>, Volume 11, Issue 2, June 1997, Page 273.V. S. Raju <strong>and</strong> M. Ravindran, Wave energy : potential <strong>and</strong> programme in India, Renewable <strong>Energy</strong>,Volume 10, Issues 2-3, 3 February 1997, Pages 339-345.P. R. S. White, The European programme to develop the Wells air turbine for applications in waveenergy, Renewable <strong>Energy</strong>, Volume 9, Issues 1-4, September-December 1996, Pages 1207-1212.F. Peter Lockett, Mathematical modelling of wave energy systems, Renewable <strong>Energy</strong>, Volume 9, Issues1-4, September-December 1996, Pages 1213-1217.Kunal Ghosh, Cascade wind turbines for the oscillating water column wave energy device: Part 1,Renewable <strong>Energy</strong>, Volume 9, Issues 1-4, September-December 1996, Pages 1219-1222.61
Hitoshi Hotta, Yukihisa Washio, Hitoshi Yokozawa <strong>and</strong> Takeaki Miyazaki, R&D on wave power device"Mighty Whale", Renewable <strong>Energy</strong>, Volume 9, Issues 1-4, September-December 1996, Pages 1223-1226.Wibisono Hartono, A floating tied platform for generating energy <strong>from</strong> ocean current, Renewable<strong>Energy</strong>, Volume 25, Issue 1, January 2002, Pages 15-20.R. C. McGregor <strong>and</strong> W. E. R. Desouza, On the analysis of tidal energy schemes with large diurnalvariations with application to Singapore, Renewable <strong>Energy</strong>, Volume 10, Issues 2-3, 3 February 1997,Pages 331-334.H. Maeda, S. Santhakumar, T. Setoguchi, M. Takao, Y. Kinoue <strong>and</strong> K. Kaneko, Performance of animpulse turbine with fixed guide vanesfn2 for wave power conversion, Renewable <strong>Energy</strong>, Volume 17,Issue 4, 1 August 1999, Pages 533-547.V. N. M. R. Lakkoju, Combined power generation with wind <strong>and</strong> ocean waves, Renewable <strong>Energy</strong>,Volume 9, Issues 1-4, September-December 1996, Pages 870-874.Renewable <strong>and</strong> Sustainable <strong>Energy</strong> Reviews - 1997-2004Alain Clément, Pat McCullen, António Falcão, Antonio Fiorentino, Fred Gardner, Karin Hammarlund,George Lemonis, Tony Lewis, Kim Nielsen, Simona Petroncini et al., Wave energy in Europe: currentstatus <strong>and</strong> perspectives, Renewable <strong>and</strong> Sustainable <strong>Energy</strong> Reviews, Volume 6, Issue 5, October 2002,Pages 405-431.Roger H. Charlier, A "sleeper" awakes: tidal current power, Renewable <strong>and</strong> Sustainable <strong>Energy</strong> Reviews,Volume 7, Issue 6, December 2003, Pages 515-529.Roger H. Charlier, Re-invention or aggorniamento? <strong>Tidal</strong> power at 30 years, Renewable <strong>and</strong> Sustainable<strong>Energy</strong> Reviews, Volume 1, Issue 4, December 1997, Pages 271-289.Journal of <strong>Energy</strong> Engineering - 1995-2004Performance Prediction of Contrarotating Wells Turbines for Wave <strong>Energy</strong> Converter Design. R. Curran,T. J. T. Whittaker, S. Raghunathan, <strong>and</strong> W. C. Beattie, J. <strong>Energy</strong> Engrg. 124, 35 (1998)Productivity of Ocean-Wave-<strong>Energy</strong> Converters: Turbine Design R. Curran, J. <strong>Energy</strong> Engrg. 128, 13(2002)62
AppendicesAppendix 1: Mathematical formulation <strong>and</strong> computation ofwave power/energy in irregular seasThe local behaviour of waves is determined by what is defined as the spectrum of theVHDVWDWH7KLVLVJLYHQPDWKHPDWLFDOO\E\WKHIXQFWLRQ6I WKDWVSHFLILHVKRZWKHZDYHHQHUJ\LVGLVWULEXWHGLQWHUPVRIIUHTXHQF\IDQGGLUHFWLRQ 6HHIRr exampleKinsman (1984) for further details on this topic.The spectrum is usually summarized by a small number of wave parameters. They areWKHZDYHKHLJKW+PWKHSHULRG7VHFWKHIUHTXHQF\I 7+]DQGGLUHFWLRQ (rad).For the wave height the most widely used parameter is the significant wave heightwhich can be computed <strong>from</strong> the wave directional spectrum as follows:1/ 2H s= 4m 0where m0is the zero-th spectral moment, the n-th moment being defined asm02∫ ∫ ∞= π nf S( f , θ ) df dθ0 0The convention of considering S as the distribution of the variance of the sea surfaceelevation has been used. Thus the total variance is m0(m 2 ) <strong>and</strong> the actual energy perunit area is ρ gm0. Also the significant wave height is defined (followed convention) as1/ 2H s= 4m 0. (See Mollison 1986 or other references)The energy mean period is defined asm−1T e=m0<strong>and</strong> the peak period Tpis the inverse of the peak frequency fpwhich corresponds tothe highest spectral density. For sea states with only one wave system Tpis useful inproviding a measure of the period of the waves with the highest energy density. Thesignificant wave period Tswhich is the average period of the highest one third of thewaves is generally less used. The wave power level or flux of energy per unit wavefront can be computed <strong>from</strong>2π∫0 ∫ ∞0P = ρgcg( f , h)S(f , θ ) dfdθwhere ρ is the water density. In deep water the group velocity which is the velocity atwhich the energy propagates is given byc g=g4πf63
Thus the wave power is given byPρg4πρg4π222π∞−1= ∫ ( , ) =−10 ∫ f S f θ df dθm0which can be expressed in terms ofHs<strong>and</strong> TeasP ≅20.5 H sT eWhenHsis expressed in meters <strong>and</strong> Tein seconds the power level is given in kW/m.Appendix 2: Useful wave & tidal power linksUniversities, National <strong>and</strong> Government sitesAustralian <strong>Renewables</strong> including Wave <strong>Energy</strong> :http://www.greenhouse.gov.au/renewable/index.htmlCaddet renewable energy website : http://www.caddet.org/index.phpDanish Wave <strong>Energy</strong> : http://www.waveenergy.dk/DTI <strong>Renewables</strong> (UK Government) : http://www.dti.gov.uk/energy/renewables/European Commission ’Thermie’ wave energy site :http://europa.eu.int/comm/energy_transport/atlas/htmlu/wave.htmlEuropean <strong>Marine</strong> <strong>Energy</strong> Centre, Orkney (test centre for marine energy) :http://www.emec.org.uk/European Wave <strong>Energy</strong> Research Network (EWERN) :http://www.ucc.ie/ucc/research/hmrc/ewern.htmEuropean Wave <strong>Energy</strong> Thematic Network : http://www.wave-energy.net/Japan <strong>Marine</strong> Science & Technology Center, JAMSTEC :http://www.jamstec.go.jp/jamstec/MTD/Whale/<strong>Marine</strong> Institute, Cork Irel<strong>and</strong>: http://www.marine.ie/rnd+projects/index.htmNorwegian Wave <strong>Energy</strong> Site :http://www.phys.ntnu.no/instdef/prosjekter/bolgeenergi/index-e.htmlOpen University, UK : http://www.openuniversity.edu/Scottish Executive <strong>Energy</strong> website:http://www.scotl<strong>and</strong>.gov.uk/about/ELLD/EN-CS/00017058/energyhome.aspxWorld Wave Atlas : http://seawatch.mg.uoa.gr/ZZZPHFKHGDFXNUHVHDUFKZDYHSRZHU64
Device Developers <strong>and</strong> Data ProvidersAqua<strong>Energy</strong> Group Ltd (USA) :http://www.aquaenergygroup.com/home.htmDaedalus Informatics Greece: Hybrid wave <strong>and</strong> wind system :http://www.daedalus.gr/DAEI/PRODUCTS/RET/General/What%20is%20Wave%20PowerEMU Consult, Denmark (Wave Dragon) :http://www.spok.dk/consult/waves.shtmlEnergetech Australia Pty Ltd (includes Denniss-Auld Turbine) :http://www.energetech.com.au/The Engineering Business Ltd (Stingray tidal stream device) :http://www.engb.com/Interproject Service AB (IPS OWEC Buoy): http://www.ips-ab.com/<strong>Marine</strong> Current Turbines Ltd : http://www.marineturbines.com/home.htmOceanor, Norway (Wave data) : http://www.oceanor.no/Ocean Power Delivery Ltd., Scotl<strong>and</strong> (Pelamis) :http://www.oceanpd.com/Ocean Power Technologies, USA :http://www.oceanpowertechnologies.com/Sea Power International AB, Sweden :http://www.seapower.se/indexeng.htmlSeaVolt Technologies, USA (Wave Rider) under constructionStrom AS (<strong>Tidal</strong> Stream generator at Hammerfest in Norway) :http://www.tidevannsenergi.com/Teamwork Technology Bv (Archemides Wave Swing):http://www.waveswing.com/Verdant Power (tidal current demonstration in NYC):http://www.verdantpower.com/Initiatives/eastriver.shtmlWave Dragon ApS (Danish) : http://www.wavedragon.net/Wavegen, Scotl<strong>and</strong> (Limpet) : http://www.wavegen.co.uk/Wavemill <strong>Energy</strong> Corporation (Cape Breton, Nova Scotia) :http://www.wavemill.com/Lobbying, Promotional & Trade OrganisationsPractical Ocean <strong>Energy</strong> Management Systems (US) :http://www.poemsinc.org/Renewable Power Association (UK) : http://www.r-p-a.org.uk/home.fcmSeapower - <strong>Marine</strong> Renewable <strong>Energy</strong> Association (UK):http://www.bwea.com/marine/resource.htmlScottish Coastal Forum :http://www.scotl<strong>and</strong>.gov.uk/environment/coastalforum/Scottish <strong>Energy</strong> Environment Foundation :http://www.mecheng.strath.ac.uk/feature-seef.htmScottish <strong>Renewables</strong> Forum: http://www.ipa-scotl<strong>and</strong>.org.uk/65
National Review documentsA brief review of Wave <strong>Energy</strong> : http://www.researchinnovation.ed.ac.uk/expertise/physical-sciences/energy.pdfAlso see http://www.research-innovation.ed.ac.uk/flashindex.htmlOptions for the development of wave energy in Irel<strong>and</strong> : http://www.irishenergy.ie/uploads/documents/upload/publications/wave.pdfOther LinksEdinburgh Designs Ltd (Test tanks <strong>and</strong> absorbing wave maker systems):http://www.edesign.co.uk/http://www.edesign.co.uk/McGraw-Hill Higher Education virtual wave tank :http://www.mhhe.com/physsci/physical/giambattista/wave_tank/wave_tank.htmlAppendix 3: Recent publications <strong>from</strong> IOT66
Proceedings of OMAE ’ 0423 rd International Conference on Offshore Mechanics<strong>and</strong> Arctic EngineeringJune 20-25, 2004, Vancouver, <strong>Canada</strong>OMAE2004-51044THE NONLINEAR INTERACTION AND RESONANCE OF STEEP LONG-CRESTEDBICHROMATIC SURFACE WAVES IN A NUMERICAL WAVE TANKR. E. BaddourNational Research Council -<strong>Canada</strong>Institute for Ocean TechnologyP.O.Box 12093, A1B 3T5St John’s, NL, CANADAW. ParsonsCollege of the North AtlanticRidge road,Box 1150, A1C 6L8St John’s, NL, CANADAABSTRACTWe are studying numerically the problem of generation <strong>and</strong>propagation of long-crested gravity waves in a tank containingan incompressible inviscid homogeneous fluid initially at restwith a horizontal free surface of finite extent <strong>and</strong> of infinitedepth. A non-orthogonal curvilinear coordinate system, whichfollows the free surface is constructed which gives a realistic’’continuity condition’’, since it tracks the entire fluid domain atall times. A depth profile is assumed <strong>and</strong> employed to perform awaveform relaxation algorithm to decouple the discreteLaplacian along dimensional lines, thereby reducing itscomputation over this total fluid domain. In addition, the fullnonlinear kinematic <strong>and</strong> dynamic free surface conditions areutilized in the algorithm. A bichromatic deterministic wavemaker using a Dirichlet type boundary condition <strong>and</strong> a suitablytuned numerical beach is utilized. This paper pays specialattention to satisfying the full nonlinear free surface conditions<strong>and</strong> presents the nonlinear interaction of the higher ordercomponents, especially near resonance.INTRODUCTIONA two-dimensional rectangular basin containing anincompressible inviscid homogeneous fluid initially at rest witha horizontal free surface of finite extent is considered togenerate <strong>and</strong> propagate long-crested waves. On the left verticalboundary a wavemaker is positioned while at the right h<strong>and</strong> sideis the radiation boundary. By this we mean, the right h<strong>and</strong> sideboundary is designed to avoid reflections, which complicatesthe flow field. This can be accomplished by implementing aradiation condition, hence the name, which allows the waves topass through the boundary, or by placing a numerical beach nearthis boundary. We choose the latter. As in Parsons <strong>and</strong> Baddour(2002), a depth profile for the potential is assumed, giving us awaveform relaxation method, <strong>and</strong> thereby drastically reducingthe computational cost of solving Laplace’s equation. Anumerical beach is also used to absorb the wave energy at theradiation boundary. A bichromatic wavemaker is employedusing a Dirichlet type boundary condition, a non-orthogonalcurvilinear coordinate system, which follows the free surface,<strong>and</strong> the full nonlinear kinematic <strong>and</strong> dynamic free surfaceboundary conditions are employed; see Parsons <strong>and</strong> Baddour(2003). Although, these ideas can be extended to finite depthtanks, we presently restrict our attention to the infinite depthcase.This method is a volume-discretization method, which useswaveform relaxation to reduce the “computational dimension”of the problem. As such, it compares favorably with theboundary-discretization method that reduces the dimension ofthe problem by solving it only on the boundary. See the reviewby Tsai <strong>and</strong> Yue (1996).Concerning the phenomenon of resonance in surface gravitywaves, see Debnath (1994) for some of the classical results <strong>and</strong>the references there in. Note that these methods usually involveseries methods where a number of high order terms are includedin the expansion of the equations. We point out that our modelutilizes the full nonlinear model, <strong>and</strong> therefore should containthese results, as special cases. In fact it should be rememberedthat resonance is a purely nonlinear effect, <strong>and</strong> thereforerequires a nonlinear model to be seen. Also, the results can bequite dramatic, so it is important to be aware of them whensolving ocean engineering problems.PROBLEM FORMULATIONConsider a two-dimensional rectangular basin containing anincompressible inviscid homogeneous fluid of constantdensity ρ , in a Cartesian coordinate system ( x , z), with the1 Copyright © 2004 by ASME
origin at the still water level, the positive z-axis pointingupwards. The horizontal extent of the basin is 0 ≤ x ≤ L , soL > 0 is the length of the tank. The depth of the basin isinfinite. See Figure 1 for the coordinate system configuration.This is an initial-value problem, since the surface is initially atrest for time, t < 0 <strong>and</strong> is disturbed at t ≥ 0 giving rise tosurface waves. See Debnath (1994). If the Φ ( x,z,t)is thevelocity potential <strong>and</strong> η( x,t)is the free surface elevation, theproblem is defined by the following equations, where g is theacceleration due to gravity. The conservation of mass equationis Laplace's equation:22∂ Φ ∂ Φ+ = 02 2∂x∂z−∞ ≤ z ≤η ( x,t),0 ≤ x ≤ L,t ≥ 0 (1)For t ≥ 0,the full nonlinear kinematic <strong>and</strong> dynamic free surfaceboundary conditions are given, respectively, by:∂η∂η∂Φ ∂Φ+ − = 0∂t∂x∂x∂z(2)<strong>and</strong>∂Φ 1 ∂Φ 2 ∂Φ+ [( ) + ( )] + gη = 0∂t2 ∂x∂z(3)on z = η( x,t), <strong>and</strong>∂Φ→ 0 as z → −∞(4)∂zIntroducing the following function:χ( x,t)= Φ(x,η(x,t),t)(5)which represents the potential on the free surface, we have:∂χ∂Φ ∂Φ ∂η= +(6)∂t∂t∂z∂timplying:∂Φ∂χ∂Φ ∂η= −(7)∂t∂t∂z∂tAlso, we have that∂χ∂Φ ∂Φ ∂η= + .(8)∂x∂x∂z∂xSee Wehausen <strong>and</strong> Laitone (1960).The initial conditions are given by:(••0 00 x•Φ x,0,0)= (1/ ρ ) Φ ( x);Φ(x,0,0)= (1/ ρ)Φ (x); η(x,0)= η ( )where ( 1/ ρ ) Φ 0(x ) <strong>and</strong> ( 1/ ρ ) Φ 0 ( x)represent the given freesurface impulse <strong>and</strong> η 0 ( x ) the initial displacement, where the“dot” represents a time derivative. Since we are considering afluid in which the initial velocities are zero <strong>and</strong> the initial freesurface is at rest at z = 0 , we take•Φ 0 ( x)= 0; Φ 0 ( x)= 0; η 0 ( x)= 0 for 0 ≤ x ≤ L (9)Therefore we are left with two lateral boundary conditions fort ≥ 0 at x = 0 <strong>and</strong> x = L , which we call the LHS lateralboundary condition <strong>and</strong> the RHS lateral boundary condition,respectively.The LHS boundary condition involves a wavemaker, which weassume is the sum of two sinusoid waves, each of the generalformη ( x,t)= A cos( k x −ωt),- ∞ < x ≤ 0, - ∞ < t < ∞ (10)iiiiwhere, A i = H i / 2 is the amplitude of each wave, kiis thewavenumber <strong>and</strong> ωiis the angular frequency of each wave;i = 1,2 . The steepness of the wave is S i = kiAi/ π . Usingst<strong>and</strong>ard water wave mechanics, the associated linear velocitypotential gives the LHS boundary condition, <strong>and</strong> is the sum oftwo terms of the general formA i g k i zΦ i ( x , z , t ) = e sin( k i x − ω it),(11)ωfor x = 0, t ≥ 0, - ∞ < z ≤ 0,where the linear dispersion relation isiω g , i = 1, 2 . (12)i =k iNote that in the implementation of the wavemaker algorithmwe assume the validity of (11) over the range −∞ < z ≤ η( 0, t)i.e.up to the free surface.It is prudent to point that it is not necessary, but only aconvenience <strong>and</strong> for completeness to make the assumption ofthe existence of the sinusoids in Equation (10), since we areonly inputting the potential given by Equation (11). Thereforeconditions outside the interval [ 0 ,L]have no effect on thesolution. This progressive wave at x = 0 <strong>and</strong> t ≥ 0 is the solesource of the disturbance that gives rise to water waves in theinitially calm basin.If we assume a wall at x = L so the RHS lateral boundarycondition becomes∂Φ(L,z,t)= 0, - ∞ < z ≤ η,t ≥ 0,(13)∂xwe will get reflections <strong>from</strong> waves going <strong>from</strong> the wavemakerat x = 0 toward the RHS wall. To absorb these waves we placea “numerical beach” on the RHS. This is accomplished byincluding a damping term µ in the dynamic free surfaceboundary condition equation applied at the damping zone. Thisis accomplished by adding a damping term µχ to the righth<strong>and</strong> side of the dynamic free surface boundary condition; seeEquation (33).However, an abrupt introduction of this damping term causessome reflection at the boundary between the damping zone <strong>and</strong>the non-damping zone. The following third-order polynomialdistribution of the damping coefficient ensures a smoothtransition between these two zones:⎛ 2 33ˆ x 2xˆ⎞µ ( xˆ)=ν ⎜ − ⎟ kg , where L⎜ 2 3L1L ⎟1 is the length of the⎝1 ⎠damping zone, k is the representative wave number, which willbe discussed later, <strong>and</strong> ν is the normalized damping coefficient.Note that xˆ is a local variable where, x ˆ = 0,when x = L − L1,<strong>and</strong> x ˆ = L1, when x = L .This numerical beach is found to be most effective when,0.8≤ν ≤1.0.Clearly, setting ν = 0 is equivalent to removing the beach.Also, L 1 is usually taken to be about two representativewavelengths, L 1 ≈ 2λ, where λ is the wavelength associated2 Copyright © 2004 by ASME
¡with the representative wavenumber, <strong>and</strong> is given byλ = 2π / k . See Parsons <strong>and</strong> Baddour (2002).THE LAPLACIAN ON THE FREE SURFACECOORDINATE SYSTEMWe define the Free Surface Coordinate System (FSCS), ( s , w),where s ≥ 0 is the arclength along the free surfacez = η( x,t)<strong>and</strong> w ≤ 0 is the vertical depth to any point in thefluid <strong>from</strong> the free surface. This is a non-orthogonal movingcoordinate system that follows the free surface. Clearly, thecoordinates satisfy the following equations (over the completefluid domain),2⎛ ∂ ( , ) ⎞= ∫ x η τ ts 1 + ⎜ ⎟ dτ, 0 ≤ x ≤ L , (14)0 ⎝ ∂τ⎠w = z −η ( x,t),0 ≤ x ≤ L, w ≤ 0.(15)If we define the unit vector ŝ along the arclength, <strong>and</strong> thereforetangent to the free surface z = η( x,t), thens ˆ = cosθ î + sinθkˆ(16)i ˆ = secθŝ - tanθkˆ(17)where−tan 1 ⎛ ∂η⎞θ = ⎜ ⎟ .⎝ ∂x⎠(18)The arclength along the coordinate curve s is given by2ds =⎛ ∂η⎞1+⎜ ⎟⎝ ∂x⎠dx(19)ords = secθ dx . (20)Clearly we have the following differential operator formulasthat allow us to transform easily between rectangularcoordinates ( x , z)<strong>and</strong> free surface coordinate system ( s , w):¢£∂ ∂ ∂= secθ- tanθ∂x∂s∂w(21)∂ ∂ ∂= cosθ+ sinθ∂ s ∂ x ∂z(22)∂ ∂= .∂z ∂w(23)The Laplacian for this non-orthogonal coordinate system can beconstructed <strong>from</strong> the second-order covariant fundamental metrictensorJ⎛1sinθ⎞=⎜⎟⎝sinθ 1 ⎠(24)where its associated second-order contravariant tensor is givenby⎛2sectan sec ⎞⎜θ − θ θ⎟J =⎜2tan secsec ⎟⎝−θ θθ ⎠(25)where clearly¤¥ = GHWJ) = cos2θJ .The Laplacian is given by the following tensor equation1 ∂ ⎛ αλ ∂Φ ⎞∆Φ = ⎜ JJ ⎟,α,λ = 1,2λαJ ∂x⎝ ∂x⎠12where x = s,x = w.See Kaplan (1993). We get∆Φ = secθ∂ ⎛ ∂Φ ∂Φ ⎞[ ⎜secθ− tanθ⎟ +∂s⎝ ∂s∂w⎠∂ ⎛ ∂Φ ∂Φ ⎞+ ⎜−tanθ+ secθ⎟]∂w⎝ ∂s∂w⎠(26)(27)THE DYNAMIC AND KINEMATIC BOUNDARYCONDITIONS ON THE FREE SURFACE COORDINATESYSTEMUsing equation (8) <strong>and</strong> equation (18), the kinematic free surfaceboundary condition (KFSBC) given by equation (2), becomes∂η∂χ2 ∂Φ+ tanθ− sec θ = 0 . (28)∂t∂x∂zThe dynamic free surface boundary condition (DFSBC), givenby equation (3), can be rewritten using equations (7) <strong>and</strong>equation (8). After some algebra <strong>and</strong> using equation (18) <strong>and</strong>the KFSCB, equation (28), we get the following final form:22∂χ1 ⎡⎛∂χ⎞ 2 ⎛ ∂Φ ⎞ ⎤+ ⎢⎜⎟ − sec θ ⎜ ⎟ ⎥ + gη= 0.(29)∂t2 ⎢⎣⎝ ∂x⎠ ⎝ ∂z⎠ ⎥⎦where all values in (28) <strong>and</strong> (29) are evaluated on the freesurface. Since the free surface coordinate system tracks the freesurface, these values are readily obtained <strong>and</strong> allow for theintegration in time t .SPATIAL APPROXIMATION AND WAVEFORMRELAXATIONIn this paper, we employ a curvilinear grid that follows the freesurface. In light of equation (18), this grid is taken to be{( s w ),i = 0,1, , M ; j = 0,1, ,N },(30)i , jLwheresi = −si−1 + secθ i 1∆x, <strong>and</strong>⎡2 ⎤⎢ ⎛ ∂η⎞secθ ⎥i = 1+⎜ ⎟ ,⎢ ⎝ ∂x⎠ ⎥⎣ ⎦where we take s 0 = 0 , <strong>and</strong> w j = − j ∆ w , where ∆ x = L / M , sox i = i∆x,<strong>and</strong> ∆ w = h / N L , where h is the depth to which wesolve Laplace’s equation, taken to be greater than or equal toone wavelength of the wavemaker. We allow the possibility that∆ w ≠ ∆x; see equation (23). We must solve Laplace’s equation,(27) over this grid.The semi-discretized approximation of this potentialΦ ( s , w , t)is written as Φ ( ) i = 0,1,,M ;iji, j tj = 0,1,,N L ; t ≥ 0.To implement the wavemaker, we assume the sum of the twosinusoids in (10), for x ≤ 0 , −∞ < t < ∞ , <strong>and</strong> their associated(linear) velocity potentials, (11) <strong>and</strong> dispersion relation (12).The LHS boundary condition is implemented as a Dirichletboundary condition.x=x i3 Copyright © 2004 by ASME
The Dirichlet wavemaker:Φ0, j− A2where,( t)= −Ag[ ek21k2wjgk1k1wj[ e ]]sin( ki2sin( k c t)c t)211gc i = is the velocity of each wave, i = 1, 2k(31)., <strong>and</strong>j = 0,1,,N L ; t ≥ 0 . The horizontal bottom boundarycondition, given by (4), will be automatically satisfied by therelaxation method, as we shall soon see. The boundarycondition at the free surface, z = η( x,t),{ Φ t): i = 1,2, , M −1;t 0}i (32)is given by the kinematic <strong>and</strong> dynamic boundary conditions,(28) <strong>and</strong> (29), respectively, <strong>and</strong> involve integration over time.This will be discussed in the next section. The RHS boundarycondition for the numerical beach is incorporated in thecalculation of the free surface potential over the damping zone,<strong>and</strong> involves modification of equation (29) to,, 0 (≥∂χ1 ⎡ ∂χ2 2 ∂Φ( ) sec ( )2 ⎤++ + = 0.2⎢ − θ∂⎥ µχ gη(33)t ⎣ ∂x∂z⎦Therefore, the potential should vanish everywhere at the wall,<strong>and</strong> as a convenience, we may employ equation (13) to get theRHS boundary condition; that is,t)= Φ ( t),j = 0,1, , N ; t 0. (34)Φ M , j ( ( M −1),jL ≥Even with a uniform ∆ x , the curvilinear grid will have nonconstant∆ s.Therefore, to apply finite difference formulas todiscretize Laplace's equation (27), we will need appropriatefinite difference operators. Clearly, applying these discreteoperators to Laplace's equation (27), is best done usingcomputer algebra, <strong>and</strong> the authors utilized Maple. We refer tothe resulting equation, as the "semi-discretized Laplaceequation". The details are to be given elsewhere.Consider its application over any s -coordinate curve for fixedw in the interior of the domain. That is, we evaluate the semidiscretizedLaplacian at s , w ) , to calculate( i jΦ i, j ( t)i = 1,2, , M −1;j = 1,2, , N L −1(fixed); t ≥ 0.Thiswill involve nine potentials, namely:s j−1 -coordinate curve: Φ i−1,j−1(t)Φi, j−1(t)Φ i+1,j−1 ( t)s -coordinate curve: Φ ( ) Φ ( ) Φ ( )ji−1,j ti, jti+ 1,j ts j+1 -coordinate curve: Φ i −1,j+1( t)Φi , j+1( t)Φ i + 1,j+1 ( t)See Figure 1. The idea behind waveform relaxation is to followthe lead of separation of variables methods <strong>and</strong> assume that thepotential can be written as,~Φ ( t)χ ( t)φ i = 0,1,,M , j = 0 ,1, , N t 0 (35)i, j =ijL; ≥where χ i (t)is the potential at z = η( x,t)(i.e. the free surfacepotential) <strong>and</strong> therefore satisfies Equations (28) <strong>and</strong> (33), <strong>and</strong>since we are considering the infinite depth basin,~ kw jφ = e , j = 0,1,2, ,N(36)jLwhere k is a representative wavenumber, which we take“based” of the wavenumbers of the wavemaker given inEquation (11). For example k can be taken to be the average ofk 1, kthe two wavenumbers,2. Therefore the nine potentials thatoccur in the discretized Laplace equation become,s j−1 -coord.curve: χ i−1( t)φ χ ( )~j−1i t φ j −1~χ~i+ 1( t)φ j −1sj-coord.curve: Φ i−1,j ( t)Φi, j( t)Φ i + 1,j ( t )~s -coord.curve: χ i−1( t)φ~~j+1 i ( t)φ j + 1 χ i+ 1 t)φ jj+1χ ( + 1So clearly the only "unknowns" are the three potentials alongthe s -coordinate curve, <strong>and</strong> we have successfully decoupledjthe system along dimensional lines, by "relaxing" the wdependence. Note that, in light of equation (36), the bottomboundary condition (4) is automatically satisfied. Since the~χ i ( t φ j , i = 0,1, , M ; j = 1,2, ,N L ; t ≥ 0 areknown <strong>and</strong> become incorporated into the vector b &fs , this givesterms { ), }rise to the iterated matrix equation& q + 1 & qA Φ ( t ) = b ( t )&( ) ( ) + b ( t )j= where ( ) 0fswm, (37)for q 0,1 ,...,qMaxb & fs is obtained <strong>from</strong> equation (36)<strong>and</strong> all subsequent ( b & ) qfs , q = 0,1 ,..., are obtained <strong>from</strong>( Φ &) qj . We refer to this equation as the semi-discretizedLaplace equation, since Φ ( ) is discrete over space buti, j tcontinuous over time. In general, two types of iteration schemesare possible, Gauss-Jacobi in which "new values" are used onlyafter a complete iteration has been completed <strong>and</strong> Gauss-Seidelin which "new values" are used as soon as they are available.Clearly, the Gauss-Jacobi method is fully parallel, but presentlywe employ the Gauss-Seidel method, since it generallyconverges faster.The matrix A is a square sparse tridiagonal matrix ofdimension ( M −1)× ( M −1)<strong>and</strong>&TΦ t)= Φ ( t),Φ ( t),,Φ ( t)[ ] ,j ( 1, j 2, jM −1,jwhere j = 1,2, , N L ; t ≥ 0 .Note that the matrix A does not depend on the iterationparameter q , <strong>and</strong> therefore must be inverted only once per timestep.The terms { Φ ( )},where j = 0,1,2,,N ; t ≥ 0 are known0,j tsince they are given by the wavemaker condition (31)&incorporated into the vector b wm (t).The inversion of the completeM − 1)( N −1)× ( M −1)(N −1)system reduces to ( N −1)( LLinversions of the ( M −1)× ( M −1)linear system given by (37).Furthermore, if ∆wis a constant, then the matrix A is identicalfor any s -coordinate curve, <strong>and</strong> the Gaussian eliminationLL4 Copyright © 2004 by ASME
operations necessary to invert each system, using LUdecomposition,need be performed only once. This effectivelyreduces the dimension of the problem by one. Such reduction incomputation is essential, since the matrix A changes at eachtime-step, <strong>and</strong> therefore the system must be inverted at eachtime-step.TIME INTEGRATIONEquation (37) must be fully discretized to complete thenumerical model. For T a positive finite real number, we solveour initial-value problem over the time interval [ 0 ,T]. For anatural number N T , we let ∆ t = T / NT, which gives thesequence of time steps t }, where n∆t,n = 0,1,,N .{ n t n = Ti, j ( n i nThe approximation of Φ t ), χ ( t ) <strong>and</strong> the free surfaceelevation η x i , t ) is denoted by Φ , χ( nni,jni<strong>and</strong>nη i ,respectively, for i = 0,1,,M , j = 0,1,,N L , n = 0,1,,N T .To solve this linear system we require the vector b &) whichfs ( t ncontains the terms { χ in }, i = 1,2, , M −1,n = 1,2,,NT,which involve integration over time. The differential Equations(28) <strong>and</strong> (33) are used to generate the approximations { η in } <strong>and</strong>{ χ in }, respectively for i = 1,2, , M −1,n = 1,2,,NT. Inboth cases, we use a four-point one-sided finite difference to∂Φnapproximate . To calculate∂z( ∂η∂x ) ni <strong>and</strong> ( ∂χ∂x ) i , we spline{ ηin } <strong>and</strong> { χ in }, respectively, with a piecewise polynomial ofdegree three, <strong>and</strong> then calculate it's derivative in closed form.n −1 ∂ηnThis also allows us to evaluate { θ i = tan ( ) i } .∂xSince the fluid in the basin is initially at rest, we have the initialconditions, η 0 = 0 , 0 0χ = 0,<strong>and</strong> 0,whereiiΦ i , j =i = 1,2, , M −1,j 1,2, , N −1.A fourth-order (explicit)= LRunge-Kutta method gets the additional starting values { η in } ,{ n iχ }, where n = 1,2, 3 <strong>and</strong> i = 1,2, , M −1.At each of thesetime-steps, the current value for { χ in } <strong>and</strong> the fully discretizedn{ i,jversion of equation (37) is used to get Φ } n = 1,2,3,i = 1,2,,M −1<strong>and</strong> j 1,2, , N −1.After this initial phase, for= Ln = 4,5,6,,N , i = 1,2, , M −1,j = 1,2, , N L −1,an Adams fourth-order predictor-correctormethod is used. Using the starting values <strong>from</strong> the Runge-Kuttamethod, a fourth-order Adams-Bashford method is used as thepredictor to advance { χ in }. Then, using this current value <strong>and</strong>the fully discretized version of equation (37), we advancenΦ } . Next a fourth-order Adams-Moulton corrector method{ i,jis used, with these values for { χ in } <strong>and</strong> { Φ i,j } , to advance{ η in } . This is followed by another application of the Adams-TnMoulton corrector method to advance { χ in } using this“corrected” value of { η in } . See Baddour <strong>and</strong> Parsons (2003).TEST PROBLEMS AND CONCLUSIONSMonochromatic WavemakerTo test <strong>and</strong> illustrate the “high order” of nonlinearity of themodel in the monochromatic case, we consider the followingtest problem:Starting <strong>from</strong> “calm water”, we input a monochromatic sinusoidat x = 0 , with moderately high steepness, S = 0. 06 . Thehorizontal extent of the tank is L = 1.0(m), <strong>and</strong> we input a totalof 4 waves including a damping zone of 2 wavelengths. Thissets the wavelength of the wavemaker λ = 0.25(m), withcorresponding wavenumber k = 25.1(1/m), <strong>and</strong> by using thelinear dispersion relation, Equation (12), the angular frequencyω = 15.7(1/s). The discretization parameters are∆x = λ / 25, ∆z= λ/15, with h λ , q = 10 , <strong>and</strong>= Max∆ t = T / 40 .In Figure (2), we plot the free surface elevation at a fixedlocation in the tank, namely η ( 0.1L)after 38 periods, afterwhich the model became unstable. Note that the instability isnot visible in the “generation” over time at a fixed location inspace. It is the “propagation” over space that is subject to thisinstability. See Baddour <strong>and</strong> Parsons (2003). Figure (3) givesthe spectrum of this time series using the Matlab “fft”, <strong>and</strong>employing a Gaussian window to minimize leakage. In fact allthe spectrum plots we present in this paper utilizes thiswindowing technique. See Briggs <strong>and</strong> Henson (1995).Note that the model is generating (at least) the first five ordersin the classical Stokes expansion.Bichromatic WavemakerIn this test, we employ a bichromatic wavemaker, again, starting<strong>from</strong> “calm water”, with steepness, S = .015, S 0. 03 . The1 0 2 =horizontal extent of the tank is L = 1.0(m), <strong>and</strong> the wavelengthsof the wavemaker are λ = 0.25( ) <strong>and</strong> λ = 0.125( ) , where1 m2 mthe damping zone is 2λ 2 . This sets the wavenumbers of thewavemaker, to be k 1 = 25.1(1/ m), <strong>and</strong> k 2 = 50.3(1/ m),respectively, <strong>and</strong> using the linear dispersion relation Equation(12), the corresponding angular frequencies are ω = 15.7(1/ ) ,1 s<strong>and</strong> ω = 22.3(1/ ) , respectively. The discretization parameters2 sare ∆x = λ / 40, ∆z= λ/20, with h λ , q = 10 , <strong>and</strong>= Max∆ t = T / 50 . Figure (4) shows the spectrum after 100 periods ofsimulation, relative to the second frequency, ω 2 . There are “atleast 25 interactions” visible in the plot. This is further evidenceof the nonlinear interactions generated by the model. Since thewavemakers are simple linear sinusoids, all these nonlinearinteractions are the result of nonlinearities in the problem; recallthat we are solving the full nonlinear problem. Clearly, it isthese interactions that can give rise to resonance.5 Copyright © 2004 by ASME
Resonance in the Bichromatic Wavemaker CaseWe are interested in showing resonance in the “generation overtime” at a fixed location in the tank, namely at x = 0. 1L.ω1Therefore, for these tests, we define r = , where ω 1 <strong>and</strong> ω 2ω2are the angular frequencies of the bichromatic wavemakeremployed, <strong>and</strong> the corresponding wavenumbers can becalculated using the linear dispersion relation, given byEquation (12). The resonant interactions occur when r ≈ 2 ,since the interactions given by ω + ω = ω r 1)<strong>and</strong>1 2 2 ( +2ω1 −ω2= ω2 (2 r −1), coincide.For the first test we take r = 1. 5 , <strong>and</strong> show that the solutiondoes not show resonance. Let L = 1.0(m), <strong>and</strong>∆x = λ / 20, ∆z= λ/10, with h λ , q = 10 , <strong>and</strong> ∆ t = T / 30 .= MaxWe choose ω 1 = 15. 7 ω 2 = 10. 5 , <strong>and</strong> we set the steepnessS1 = 0.03 <strong>and</strong> S 2 = 0. 009 , respectively. Figure (5) shows thespectrum after 50 periods of simulation, relative to the firstfrequency, ω 1 . Note that the components given byω 1 + ω 2 = 26.2 , <strong>and</strong> 2ω1 − ω 2 = 20. 9 are generated, but ofcourse, do not coincide, <strong>and</strong> therefore both are significantlysmaller than ω 1 <strong>and</strong> ω 2 . This represents a non-resonantsolution.In the second test, we set r = 2. 0 , <strong>and</strong> show that we getresonance. In particular, the setup is identical to the first test,above, except ω 1 = 15. 7 ω 2 = 7. 9 , <strong>and</strong> we set the steepnessS1 = 0.03 <strong>and</strong> S 2 = 0. 015 , respectively. To add emphasis to theresonance phenomenon, we give the spectrum of the freesurface elevation of the wavemaker (at x = 0 ) in Figure (6).The spectrum of the free surface elevation generated by themodel at (at x = 0. 1L), is shown in Figure (7). Note that we geta very significant resonant effect atωr= ω1 + ω2= 23.6= 2ω1−ω2. In fact the amplitude of thisresonant wave is slightly greater than the amplitude generatedfor ω 1 , <strong>and</strong> slightly less than the amplitude generated for ω 2 .Comparing these amplitudes with the corresponding amplitudesfor the wavemaker, given in Figure (6), it is clear that most ofthe “energy” that goes into creating this resonant componentcomes <strong>from</strong> the energy associated with ω 2 , since the amplitudegenerated by the model for ω 2 is significantly less than theamplitude corresponding to ω 2 in the wavemaker. Thecorresponding comparison for ω 1 shows that the resonant effecton this component is much smaller, but nonzero, nonetheless.We can calculate an “effective steepness” for this resonantwave, using the linear dispersion relation, given by Equation(12). We calculate the wavenumber of this resonant wave to bek r = 56.8(1/m), <strong>and</strong> measure its amplitude to beA r = 0.00368(m), giving a steepness of S r = 0. 067 , which ismore than twice the maximum steepness of the componentwaves in the wavemaker, S 1 = 0. 03 . This warns us of aninstability, which we call “resonance induced instability” causedby the increase of steepness of the resonant wave, relative to thesteepness of the waves in the wavemaker. In fact, in the nexttest, it was necessary to choose the steepness of one of thewaves in the wavemaker, very small. An initial attempt at thisrun with a larger steepness wavemaker resulted in almostimmediate overflow.The final test shows that resonance decreases, but is not lost, ifwe increase the value of r to r = 3. 0 . As before, the setup isidentical to the first test, above, except ω 1 = 15. 7 ω 2 = 5. 24 ,<strong>and</strong> we set the steepnesses S1 = 0. 03 <strong>and</strong> S 2 = 0. 003 ,respectively. See Figure (8) for the spectrum of the free surfaceelevation (at x = 0. 1L), after 50 periods. Note that we get astrong interaction at ω −ω 26. 05 , which does not coincide2 1 2 =with a weaker interaction at ω +ω 20. 94 .1 2 =We conclude with a general observation of the value of usingthe full nonlinear model over the simpler linear model.Although, the higher order components are smaller than the firstorder linear component, for each wave generated by the model,for example, see Figure (4), the nonlinear interaction of thesecomponents can be quite significant. In this paper, we haveconsidered cases in which the discrepancies between the linear<strong>and</strong> nonlinear models were extreme. Clearly, in any of theseruns, the difference between a linear <strong>and</strong> our nonlinear model isquite significant. In fact it should be remembered that thisresonance is a purely nonlinear effect, <strong>and</strong> does not occur in apurely linear solution. Since these resonance effects can be quitedramatic, it is important to be aware of them when solvingocean engineering problems. They can be a nuisance in somecases, <strong>and</strong> a hazard in other cases, but they should never beblindly ignored. This requires a fully nonlinear approach to themodeling.REFERENCESBaddour, RE <strong>and</strong> Parsons, W (2003) A comparison of Dirichlet<strong>and</strong> Neumann wavemakers for the numerical generation <strong>and</strong>propagation of transient long-crested surface waves, Proc 22ndInt. Conf. on Offshore Mechanics <strong>and</strong> Arctic Engineering,OMAE, Cancun, Mexico, paper 37281. See also Jour. OMAE,accepted for publication.Briggs, WL <strong>and</strong> Henson, VE (1995). The DFT, An owner’smanual for the discrete Fourier transform, SIAM, Philadelphia.Debnath, L. (1994) Nonlinear water waves, AcademicPress, New York.Kaplan, W (1993).Advanced calculus, Fourth Edition, Addison-Wesley, Reading, Massachusetts.Parsons, W. <strong>and</strong> Baddour, R. E. (2002), The generation <strong>and</strong>propagation of transient long-crested surface waves using awaveform relaxation method, Proceedings Advances in FluidMechanics 2002, Wessex Institute of Technology Press.Parsons, W. <strong>and</strong> Baddour, R. E. (2003), A numerical wave tankfor the generation <strong>and</strong> propagation of bi-chromatic nonlinearlong-crested surface waves, Proceedings Fluid StructureInteraction 2003, Wessex Institute of Technology Press.6 Copyright © 2004 by ASME
Tsai, W. <strong>and</strong> Yue, D. K. (1996), Computation of nonlinear freesurfaceflows, Annual Review of Fluid Mechanics, Vol. 28,Annual Reviews Inc., Ca.The MathWorks Inc. (1996), MATLAB 5.2 user’s guide,Natick, Mass.zFSz = η ( x,t)s 0j = 0j − 1xWehausen, J.V. <strong>and</strong> Laitone, E.V. (1960) Surface <strong>Waves</strong>. InH<strong>and</strong>buch der Physik Ed. S. Flugge, Vol. IX, Fluid DynamicsIII, Springer-Verlag, Berlin.w j −1w ji = 0∆ zj∆ zj +1i − 1i i + 1sjjj + 1w j +1ACKNOWLEDGMENTSTo College of the North Atlantic, Newfoundl<strong>and</strong>, <strong>Canada</strong>, forgiving Wade Parsons a one year sabbatical.To Natural Sciences <strong>and</strong> Engineering Research Council of<strong>Canada</strong> <strong>and</strong> the National Research Council’s Institute for<strong>Marine</strong> Dynamics, Newfoundl<strong>and</strong>, <strong>Canada</strong>, for awarding WadeParsons a Visiting Fellowship.Nzxi −1∆ x i∆ x i + 1x xi i + 1N LFigure 1. Free surface coordinate systemFigure 2. Free surface elevation at x=0.1L as a function oftime in (s), for a monochromatic wavemaker at x=0.0.Figure 3. Spectrum of the time series of the surfaceelevation given in Figure 2 at x=0.1L7 Copyright © 2004 by ASME
Figure 4. Spectrum of free surface elevation at x=0.1L after100 periods of simulation relative toω 2 , with a bichromaticwavemaker: ω = 15.7(1/ ) <strong>and</strong> ω = 22.3(1/ )1 s2 sFigure 6. Spectrum of the free surface elevation of thewavemaker at x=0 : ω 1 = 15.7(1/ s)<strong>and</strong> ω 2 = 7.9(1/ s),r = 2.0Figure 5. Spectrum of the free surface elevation at x=0.1Lafter 50 periods of simulation relative to ω 1, for abichromatic wavemaker: ω = 15.7(1/ ) <strong>and</strong>ω = 10.5(1/ ) , r = 1. 52 s1 sFigure 7. Spectrum of the free surface elevation at x=0.1Lgenerated by the model : ω 1 = 15.7(1/ s)<strong>and</strong> ω 2 = 7.9(1/ s),r = 2.08 Copyright © 2004 by ASME
Figure 8. Spectrum of the free surface elevation at x=0.1Lafter 50 periods of simulation : ω = 15.7(1/ ) <strong>and</strong>ω = 5.24(1/ ) ; r = 3. 02 s1 s9 Copyright © 2004 by ASME
The Generation <strong>and</strong> Propagation of Deep Water Multichromatic Nonlinear Long-crested Surface <strong>Waves</strong>W . Parsons 1 <strong>and</strong> R. E. Baddour 21College of the North Atlantic, Box 1150,Ridge Road, St John’s, NF, A1C 6L8, <strong>Canada</strong>.2National research Council - <strong>Canada</strong>Institute for Ocean technologySt. John’s, NL, <strong>Canada</strong>ABSTRACT.A two dimensional rectangular basin containing an incompressibleinviscid homogeneous fluid, initially at rest with a horizontal freesurface of finite extent is considered to generate <strong>and</strong> propagatenonlinear, long-crested waves. A depth profile for the potential isassumed, giving us a waveform relaxation method, thereby drasticallyreducing the computational cost of solving Laplace’s equation. Amultichromatic stochastic wavemaker employing a Dirichlet typeboundary condition is applied, with the latter following a st<strong>and</strong>ard waveenergy spectrum. Laplace's equation is solved using a non-orthogonalboundary fitted curvilinear coordinate system, which follows the freesurface, <strong>and</strong> the full nonlinear kinematic <strong>and</strong> dynamic free surfaceboundary conditions are employed. The behavior of this model isstudied using st<strong>and</strong>ard signal processing tools <strong>and</strong> a discussion of theresults is given. In addition, statistical properties of the output of themodel are related to the corresponding statistical properties of the input.KEY WORDS: Nonlinear-waves; regular; irregular waves; nonlinearfree surface conditions; multichromatic; non-orthogonal coordinates;waveform relaxation.INTRODUCTIONA two-dimensional rectangular basin containing an incompressibleinviscid homogeneous fluid initially at rest with a horizontal freesurface of finite extent is considered to generate <strong>and</strong> propagate longcrestedwaves. On the left vertical boundary a wavemaker is positionedwhile at the right h<strong>and</strong> side is the radiation boundary. The samenumerical beach is used as in Parsons <strong>and</strong> Baddour (2002), <strong>and</strong> a depthprofile for the potential is assumed, giving us a waveform relaxationmethod, <strong>and</strong> thereby drastically reducing the computational cost ofsolving Laplace's equation. A multichromatic deterministic <strong>and</strong>stochastic wavemaker employing a Dirichlet type boundary condition isapplied, see Baddour <strong>and</strong> Parsons (2003) for a comparison of Dirichlet<strong>and</strong> Neumann monochromatic wavemakers <strong>and</strong> Parsons <strong>and</strong> Baddour(2003) for the bichromatic Dirichlet wavemaker model. This methodcan easily be extended to the case of a wavemaker utilizing a Neumanntype boundary condition. Laplace's equation is solved using a nonorthogonalboundary fitted curvilinear coordinate system, whichfollows the free surface. This gives a more realistic "continuitycondition", since it involves the entire fluid domain. Also, the fullnonlinear kinematic <strong>and</strong> dynamic free surface boundary conditions areemployed. Although, these ideas can be extended to finite depth tanks,this requires a rewriting of the coordinate system, so we restrict ourattention to the infinite depth case. The extension of these ideas to thefinite depth case will be presented elsewhere.To place our work in perspective, see the review by Tsai <strong>and</strong> Yue(1996) "of the recent advances in computations of incompressible flowsinvolving a fully nonlinear free surface". The present work advancesthe field of volume-discretization methods, using finite differences, byapplying the relatively new method of waveform relaxation to reducethe "computational dimension" of the problem. This puts volumediscretizationmethods on a similar footing with boundarydiscretizationmethods, which reduce the dimension of the problem bysolving it on the boundary.The purpose of the present paper is to show that the method presentedcould be applied to the multichromatic case of excitation with bothdeterministic <strong>and</strong> statistical wavemakers. A complete review of theliterature concerning sea-states reproduction is outside the scope of thepresent objective.PROBLEM FORMULATIONConsider a two-dimensional rectangular basin containing anincompressible inviscid homogenHRXV IOXLG RI FRQVWDQW GHQVLW\ LQ DCartesian coordinate system (x,z), with the origin at the still waterlevel, the positive z-axis pointing upwards. The horizontal extent of thebasin is 0 ≤ x ≤ L , so L > 0 is the length of the tank. The depth of thebasin is infinite. See Figure 1 for a diagram of the numerical wave tank<strong>and</strong> the rectangular coordinate system configuration. This is an initialvalueproblem, since the surface is initially at rest for time, t < 0 <strong>and</strong>is disturbed at t = 0 giving rise to surface waves. See Debnath (1994).If Φ ( x,z,t)is the velocity potential <strong>and</strong> η ( x,t)is the free surfaceelevation, the problem is defined by the following equations, where g isthe acceleration due to gravity. The conservation of mass equation isLaplace's equation:2 2∂ Φ ∂ Φ+ = 0 − ∞ ≤ z ≤η ( x,t),0 ≤ x ≤ L,t ≥ 0 (1)2 2∂x∂zFor t ≥ 0 , the full nonlinear kinematic <strong>and</strong> dynamic free surface
oundary conditions are given, respectively, by:∂η∂η∂Φ ∂Φ+ − = 0∂t∂x∂x∂z∂Φ<strong>and</strong> 1 ∂Φ 2 ∂Φ+ [( ) + ( )2 ] + gη = 0∂t2 ∂x∂zon z = η( x,t), <strong>and</strong>∂Φ→ 0 as z → −∞(4)∂zIntroducing the following function:χ( x,t)= Φ(x,η(x,t),t)(5)which represents the potential on the free surface, we have:∂χ∂Φ ∂Φ ∂η= +(6)∂t∂t∂z∂timplying:∂Φ∂χ∂Φ ∂η= −(7)∂t∂t∂z∂tAlso, we have that∂χ∂Φ ∂Φ ∂η= + .(8)∂x∂x∂z∂xSee Wehausen <strong>and</strong> Laitone (1960).The initial conditions are given by:••( 0 00 xΦ x,0,0)= (1/ ρ ) Φ ( x);Φ(x,0,0)= (1/ ρ)Φ (x); η(x,0)= η ( )where ( 1/ ρ ) Φ 0(x ) <strong>and</strong> ( 1/ )•ρ Φ 0 ( x)represent the given freesurface impulse <strong>and</strong> η 0 ( x ) the initial displacement, where the “dot”represents a time derivative. Since we are considering a fluid in whichthe initial velocities are zero <strong>and</strong> the initial free surface is at rest atz = 0 , we take•(2)(3)Φ 0 ( x)= 0; Φ 0 ( x)= 0; η 0 ( x)= 0 for 0 ≤ x ≤ L (9)Therefore we are left with two lateral boundary conditions for t ≥ 0 atx = 0 <strong>and</strong> x = L , which we call the LHS lateral boundary condition<strong>and</strong> the RHS lateral boundary condition, respectively.The LHS boundary condition involves a wavemaker, which we assumeis the superposition of a finite number of sinusoid waves as follows:( , )∑ Ω η x t = { Ancos( knx− ωnt)− Bnsin( knx−ωnt)},(10)n=1- ∞ < x ≤ 0, - ∞ < t < ∞ ; where An<strong>and</strong> Bnis the amplitude, k thenwave number <strong>and</strong> ωnthe angukar frequency of each wave, forn = 1,2,...,Ω.. Using st<strong>and</strong>ard water wave mechanics, the associatedvelocity linear potential is given by⎧ Ang k⎫∑ Ω nz⎪ e sin( k n x −ωnt)⎪ω nΦ(x,z,t)= ⎨⎬(11)n=1 ⎪ Bng knz+ e cos( k − ) ⎪n x ω nt⎪⎩ ω⎪n⎭for - ∞ < x ≤ 0, t ≥ 0 <strong>and</strong> −∞ < z ≤ η( 0, t), where the dispersionrelation isω k n g(12)n =The free surface elevation is at the wavemaker is then given by∑ Ω (0, t)=n=1{ A cos( ω t)+ B sin( ω t)}η (13)<strong>and</strong> its associated potential isnnn∑ Ω ⎧ AΦ(0,, ) = ⎨−ngk z Bsin( ) + ngk zz tenωntencos( ωnt)= ⎩⎭ ⎬⎫ (14)ωn 1nωnIt is prudent to point that it is not necessary, but only a convenience <strong>and</strong>for completeness to make the assumption of the existence of thesinusoids in Equation (10), since we are only inputting the potentialgiven by Equation (14). Therefore conditions outside the interval [ 0 ,L]have no effect on the solution. This progressive wave at x = 0 <strong>and</strong>t ≥ 0 is the sole source of the disturbance that gives rise to waterwaves in the initially calm basin.If we assume a wall at x=L so the RHS lateral boundary conditionbecomes∂Φ(L,z,t)= 0 for −∞ < z ≤ η , t ≥ 0(15)∂xwe will get reflections <strong>from</strong> waves going <strong>from</strong> the wavemaker at x = 0toward the wall. This distracts <strong>from</strong> the objective of the present model<strong>and</strong> is to be avoided. To absorb these waves we place a "numericalbeach" on the RHS. This is accomplished by including a damping termLQWKHG\QDPLFIUHHVXUIDFHERXQGDU\FRQGLWLRQHTXDWion. See Parsons<strong>and</strong> Baddour (2002) for details.THE LAPLACIAN ON THE FREE SURFACE COORDINATESYSTEMWe define the free surface coordinate system (FSCS), ( s , w), wheres ≥ 0 is the arclength along the free surface z = η( x,t)<strong>and</strong> w ≤ 0 isthe vertical depth to any point in the fluid <strong>from</strong> the free surface. This isa non-orthogonal moving coordinate system that follows the freesurface. Clearly, the coordinates satisfy the following equations (overthe complete fluid domain),2⎛ ∂ ( , ) ⎞= ∫ x η τ ts 1 + ⎜ ⎟ dτ, 0 ≤ x ≤ L , (16)0 ⎝ ∂τ⎠w = z −η ( x,t),0 ≤ x ≤ L, w ≤ 0.(17)If we define the unit vector ŝ along the arclength, <strong>and</strong> therefore tangentto the free surface z = η( x,t), thens ˆ = cosθ î + sinθkˆ(18)i ˆ = secθŝ - tanθkˆ(19)where−tan 1 ⎛ ∂η⎞θ = ⎜ ⎟ .⎝ ∂x⎠(20)The arclength along the coordinate curve s is given by2ds =⎛ ∂η⎞1+⎜ ⎟⎝ ∂x⎠dx(21)ords = secθ dx . (22)Clearly we have the following differential operator formulas that allowus to transform easily between rectangular coordinates ( x , z)<strong>and</strong> freesurface coordinate system ( s , w):n
¡¢£∂ ∂ ∂= secθ- tanθ∂x∂s∂w(23)∂ ∂ ∂= cosθ+ sinθ∂ s ∂ x ∂z(24)∂ ∂= .∂z ∂w(25)The Laplacian for this non-orthogonal coordinate system can beconstructed <strong>from</strong> the second-order covariant fundamental metric tensorJ⎛1sinθ⎞=⎜⎟⎝sinθ 1 ⎠(26)where its associated second-order contravariant tensor is given by⎛2sectan sec ⎞⎜θ − θ θ⎟J =⎜2tan secsec ⎟⎝−θ θθ ⎠(27)where clearly¤¥ = GHWJ) = cos2θJ .The Laplacian is given by the following tensor equation1 ∂ ⎛ αλ ∂Φ ⎞∆Φ = ⎜ JJ ⎟,α,λ = 1,2 (28)λαJ ∂x⎝ ∂x⎠12where x = s,x = w.See Kaplan (1993). We get∂ ⎛ ∂Φ ∂Φ ⎞∆Φ = secθ[ ⎜secθ− tanθ⎟ +∂s⎝ ∂s∂w⎠(29)∂ ⎛ ∂Φ ∂Φ ⎞+ ⎜−tanθ+ secθ⎟]∂w⎝ ∂s∂w⎠We note that equation (29) can be derived directly, by carrying out thedifferentiations in (1), using the differential operators (23) <strong>and</strong> (24) <strong>and</strong>recalling that the unit vector (19) is non-constant <strong>and</strong> must bedifferentiated.THE DYNAMIC AND KINEMATIC BOUNDARY CONDITIONSON THE FREE SURFACE COORDINATE SYSTEMUsing equation (8) <strong>and</strong> equation (20), the kinematic free surfaceboundary condition (KFSBC) given by equation (2), becomes∂η∂χ2 ∂Φ+ tanθ− sec θ = 0 . (30)∂t∂x∂zThe dynamic free surface boundary condition (DFSBC), given byequation (3), can be rewritten using equations (7) <strong>and</strong> equation (8).After some algebra <strong>and</strong> using equation (20) <strong>and</strong> the KFSCB, equation(30), we get the following final form:22∂χ1 ⎡⎛∂χ⎞ 2 ⎛ ∂Φ ⎞ ⎤+ ⎢⎜⎟ − sec θ ⎜ ⎟ ⎥ + gη= 0.(31)∂t2 ⎢⎣⎝ ∂x⎠ ⎝ ∂z⎠ ⎥⎦where all values in (30) <strong>and</strong> (31) are evaluated on the free surface.Since the free surface coordinate system tracks the free surface, thesevalues are readily obtained. The above derivatives allow for theintegration in time t .SPATIAL APPROXIMATION AND WAVEFORM RELAXATIONIn this paper, we employ a curvilinear grid that follows the free surface.In light of equation (23), this grid is taken to be{( si, w j ),i = 0,1, , M ; j = 0,1, ,N L},(32)wheresi = −si−1 + secθ i 1∆x, <strong>and</strong>⎡2 ⎤⎢ ⎛ ∂η⎞secθ ⎥i = 1+⎜ ⎟ ,⎢ ⎝ ∂x⎠ ⎥⎣ ⎦where we take s 0 = 0 , <strong>and</strong> w j = − j ∆ w , where ∆ x = L / M ,so x i = i∆x,<strong>and</strong> ∆ w = h / N L , where h is the depth to which wesolve Laplace’s equation, taken to be greater than or equal to onewavelength of the wavemaker. We allow the possibility that ∆ w ≠ ∆x;see equation (25). We must solve Laplace's equation, (29) over thisgrid.The semi-discretized approximation of this potential Φ ( si, w j , t)iswritten as Φ i, j ( t)i = 0,1,,M ; j = 0,1,,N L ; t ≥ 0.To implement the wavemaker, we assume the sinusoid (10), for x ≤ 0 ,−∞ < t < ∞ , <strong>and</strong> associated (linear) velocity potential, (11) <strong>and</strong>dispersion relation (12). The LHS boundary condition can beimplemented as a Dirichlet or Neumann condition. We refer to these asthe Dirichlet wavemaker <strong>and</strong> Neumann wavemaker, respectively; seeBaddour <strong>and</strong> Parsons (2003).In this paper we restrict our attention to the Dirichlet condition, <strong>and</strong>assure the reader that the extension to the Neumann wavemaker isstright forward. In light of Equation (14) the Dirichlet wavemaker isthen given by:The Dirichlet wavemaker:⎧ A+⎫∑ Ω ⎪−ng⎡ kn( η(0,t)w j )e ⎤sin(ωnt)⎪ωn⎢⎣⎥⎦Φ0,j ( t)= ⎨⎬(33)+= 1 ⎪ B+ ⎡ k ( (0, t)w )nngn η je ⎤cos(ω ) ⎪⎪nt⎩ ω ⎢⎣⎥⎦ ⎪n⎭for j = 0,1,,N L ; t ≥ 0 <strong>and</strong> where An<strong>and</strong> B n is the amplitude, k nthe wave number <strong>and</strong> ω the angular frequency of each componentnwave, n = 1,2,...,Ω , <strong>and</strong> we recall the linear dispersion relation (12).There is no limitation in the present model that precludes modeling aphysical wavemaker. The present choice given in (33) is a convenientway that would allow us to compare with the st<strong>and</strong>ard linear theory <strong>and</strong>to the Stokes expansion expression for a nonlinear free surface. SeeBaddour <strong>and</strong> Parsons (2003) <strong>and</strong> Parsons <strong>and</strong> Baddour (2003). Theconstruction of a coordinate system with a moving left boundary is inprogress. Together with (33) a ramping function over two meanperiods is utilized to satisfy the initial conditions of the problem as wellas to minimize any initial transient impulses in the free surfaceelevation <strong>and</strong> velocities.The horizontal bottom boundary condition, given by (4), will beautomatically satisfied by the relaxation method, as we shall soon see.The boundary condition at the free surface, z = η( x,t),{ Φ t): i = 1,2, , M −1;t 0}i (34)is given by the kinematic <strong>and</strong> dynamic boundary conditions, (30) <strong>and</strong>(31), respectively, <strong>and</strong> involve integration over time. This will bediscussed in the next section.The RHS boundary condition for the numerical beach is incorporated inthe calculation of the free surface potential over the damping zone, <strong>and</strong>involves modification of equation (31) to,∂χ⎡ ∂χ∂Φ ⎤, 0 (≥1 2 2 2+ ( ) sec ( ) + + = 0.2⎢ − θ ⎥ µχ gη(35)∂t⎣ ∂x∂z⎦see Parsons <strong>and</strong> Baddour (2002). Therefore, the potential should vanisheverywhere at the wall, <strong>and</strong> as a convenience, we may employ equation(15) to get the RHS boundary condition; that is,Φ M , j ( ( M −1),jL ≥x=t)= Φ ( t),j = 0,1, , N ; t 0. (36)x i
(YHQZLWKDXQLIRUP [WKHFXUYLOLQHar grid will have non-FRQVWDQW VTherefore, to apply finite difference formulas to discretize Laplace’sequation (29), we will need appropriate finite difference operators.Clearly, applying these discrete operators to Laplace’s equation (29), isbest done using computer algebra, <strong>and</strong> the authors utilized Maple. Werefer to the resulting equation, as the "semi-discretized Laplaceequation". The details are to be given elsewhere.Consider it’s application over any s -coordinate curve for fixed w inthe interior of the domain. That is, we evaluate the semi-discretizedLaplacian at ( s i , w j ) , to calculate Φ i, j ( t)i = 1,2, , M −1;j = 1,2, , N L −1(fixed); t ≥ 0.This will involve nine potentials,namely:s j−1 -coordinate curve: Φ i−1,j−1(t)Φi, j−1(t)Φ i+1,j−1(t)s -coordinate curve: Φ ( ) Φ ( ) Φ i+ 1,j ( t)ji−1,j ti, jts j+1 -coordinate curve: Φ i −1,j+1( t)Φi , j+1( t)Φ i + 1,j+1( t)See Baddour <strong>and</strong> Parsons (2003). The idea behind waveform relaxation(WR) is to follow the lead of separation of variables methods <strong>and</strong>assume that the potential can be written as,~Φ i, j ( t)= χi(t)φi,j ( t¦) i = 1,2,, M , j = 0 ,1, , N L; t ≥ 0 (37)where χ i (t)is the potential at z = η( x,t)(i.e. the free surfacepotential) <strong>and</strong> therefore satisfies equations (30) <strong>and</strong> (35), <strong>and</strong> since weare considering the infinite depth basin,~*k w j§φ = e , i = 1,2,, M , j = 0 ,1, , N t 0 (38)i,jL; ≥*where k is the representative wavenumber, which for themonochromatic case we take as the wavenumber of the wavemaker; seeequation (10) <strong>and</strong> Baddour <strong>and</strong> Parsons (2003). In the multichromaticcase, however, there are many wavenumbers to choose <strong>from</strong>. In this*case we use an iterative approach <strong>and</strong> choose some ’’reasonable’’ k ,[ ]*k ∈ min{ k , k2,...,kΩ} ,max{ k1,k2,...,kΩ}where1 <strong>and</strong> use equation (38)as a ’’first guess’’ only. We then iterate to converge on the depth profile~φ ( t)= γ ( x , ), i = 1,2,...,M , j = 0 ,1, , N t 0 (39)i, j j i tL; ≥where γ , t)= 1, i = 1,2,..., M , t 0.Therefore the nine potentialsi , 0 ( x i≥that occur in the discretized Laplace equation become,~~s j−1 -coord.curve: χ i−1( t)φ i −1,j−1χ i( t)φ i , j−1χ i+ 1( t)φ i + 1, j−1sj-coord.curve: Φ i−1,j ( t)Φ i, j ( t)Φ i+ 1,j ( t)~s -coord.curve: χ i−1( t)φ ~~i −1,j+1 i ( t)φ j + 1 χ i 1 t)φ ij+1~χ + ( + 1, j+1Clearly the ’’unknowns’’ are the three potentials along the s j -coordinatecurve <strong>and</strong> we have successfully decoupled the system alongdimensional lines, by ’’relaxing’’ the w -dependence. Note that, in lightof equations (38) <strong>and</strong> (39), the bottom boundary condition (4) is~automatically satisfied. Since the terms { χ i( t),φ i , j ( t)}, i = 1,2,...,M ,j = 0 ,1, , N L; t ≥ 0 are known <strong>and</strong> become incorporated into thevector b &fs this semi-discretized Laplace equation gives rise to theiterated matrix equation& q( ) 1 & q &A Φ + j ( t)= ( bfs) ( t)+ bwm(t), (40)for q = 0,1,...,where ( b &) 0fs is obtained <strong>from</strong> equation (38) <strong>and</strong> allsubsequent ( b & ) qfs , q = 0,1,...,are obtained ( Φ &) qj . IN general, twotypes of iteration schemes are possible, Gauss-Jacobi in which "newvalues" are used only after a complete iteration has been completed <strong>and</strong>Gauss-Seidel in which "new values" are used as soon as they areavailable. Clearly, the Gauss-Jacobi method is fully parallel, butpresently we employ the Gauss-Seidel method, since it generallyconverges faster. The matrix A is a square sparse tri-diagonal matrixof dimension ( M −1)× ( M −1), <strong>and</strong>[ Φ ( t),Φ ( t),...,Φ ( t ] TΦ & t ) , where j 1,2, , N −1;j ( ) = 1,j 2, j M −1,j= Lt ≥ 0. Note that the matrix A does not depend on the iterationparameter q , <strong>and</strong> therefore must be inverted only once per time step.Φ ( ) where j 1,2, , N −1, t ≥ 0.are knownThe terms { }0,j t= Lsince they are given by the wavemaker condition (33) <strong>and</strong> are&incorporated into the vector b wm (t).The inversion of the complete ( M −1)(N −1)× ( M −1)(N −1)systemreduces to ( N −1)inversions of the ( M −1)× ( M −1)linear systemLgiven by (40). Furthermore, if ∆wis a constant, then the matrix A isidentical for any s -coordinate curve, <strong>and</strong> the Gaussian eliminationjoperations necessary to invert each system, using LU-decompositionneed be performed only once. This effectively reduces the dimension ofthe problem by one. Concerning speed our method belongs to the classof very efficient iterative methods for solving large systems. Thisbecomes very significant when we move to 3-D. There is a vastliterature on techniques for accelerating these schemes in the area ofiterative matrix methods <strong>and</strong> are not discussed here.TIME INTEGRATIONEquation (40) must be fully discretized to complete the numericalmodel. For T a positive finite real number, we solve our initial-valueproblem over the time interval [ 0 ,T ]. For a natural number N T , we lett = Tt , whereN Tt n = n∆t, n 0,1,...,NT∆ , which gives the sequence of time steps { }L= . The approximation of Φ ( t ) , χ ) <strong>and</strong>i, j nLni ( t nn nthe frees surface η ( x i , tn)is denoted by Φ i , j , χ i ( t n ) <strong>and</strong> η i ,respectively, for i = 0,1,,M , j = 0,1,,N L , n = 0,1,,N T .To solve this linear system we require the vector b &) whichfs ( t ncontains the terms { χ in } , i = 1,2, , M −1,n = 1,2,,NT, whichinvolve integration over time. The differential equations (30) <strong>and</strong> (35)are used to generate the approximations { η in } <strong>and</strong> { χ in } , respectivelyfor i = 1,2, , M −1,n = 1,2,,NT. In both cases, we use a fourpointone-sided finite difference to approximate . To calculate∂Φ∂z( ∂η n∂x ) ni <strong>and</strong> ( ∂χ∂x ) i , we spline { ηin } <strong>and</strong> { χ in } , respectively, with apiecewise polynomial of degree three, <strong>and</strong> then calculate it’s derivativen −1 ∂ηnin closed form. This also allows us to evaluate { θ i = tan ( ) i } .∂xSince the fluid in the basin is initially at rest, we have the initialconditions, η i0 = 0 , 0 0χ i = 0,<strong>and</strong> Φ i , j = 0,where
= Li = 1,2, , M −1,j 1,2, , N −1.A fourth-order (explicit)Runge-Kutta method gets the additional starting values { η in } , { χ in } ,where n = 1,2, 3 <strong>and</strong> i = 1,2, , M −1.At each of these time-steps,the current value for { χ in } <strong>and</strong> the fully discretized version ofn{ i,jequation (41) is used to get Φ } n = 1,2,3,i = 1,2,,M −1<strong>and</strong>= Lj 1,2, , N −1.After this initial phase, forn = 4,5,6,,N , i = 1,2, , M −1,j = 1,2, , N L −1,an Adams fourth-order predictor-correctormethod is used. Using the starting values <strong>from</strong> the Runge-Kuttamethod, a fourth-order Adams-Bashford method is used as thepredictor to advance { χ in } . Then, using this current value <strong>and</strong> thefully discretized version of equation (40), we advance Φ } . Next aTn{ i,jfourth-order Adams-Moulton corrector method is used, with thesevalues for { n nχ i } <strong>and</strong> { Φ i,j } , to advance { η in } . This is followed byanother application of the Adams-Moulton corrector method to advance{ χ in } using this “corrected” value of { η in } . See Baddour <strong>and</strong> Parsons(2003) for a flow chart.IRREGULAR WAVES AND OCEAN SPECTRAThe wavemaker (33), can be rewritten in terms of a sum of "phaseshifted cosine functions", as follows:∑ Ω Φ0 , j ( t)= n0cos( ωnt+ εn)n=1φ (41)where the coefficients are2 2−1⎛A ⎞φn0 = A n + Bn<strong>and</strong> the phase angles are ε = ⎜ nn tan ⎟, (42)⎝ Bn⎠n = 1,2,...,Ω..To analyze the irregular wave generated when n ≥ 2 in (41), we recallthe following results; see Goda (2000). An energy spectrumSη( ω n ) corresponding to any irregular time history can be defined,WKH DUHD RI HDFK UHFWDQJOH RI ZLGWK WKH IUHTXHQF\ LQWHUYDO LVproportional to the energy attributed to that frequency b<strong>and</strong> <strong>and</strong>represented by the corresponding single sinusoid wave component.The amplitude of each component sine wave in (41) is therefore givenbyφ = 2Sη ( ω ) δω (m) (43)n0 nIt is also necessary to specify the phase angles ε n , <strong>and</strong> we will choosethem r<strong>and</strong>omly. This will will give different time histories for different(otherwise identical) runs, but where the energy spectrum will be thesame. Note that if the spectrum is defined at equally spaced frequenciesit will be necessary to interpolate the spectral ordinates at the r<strong>and</strong>omlyspaced frequencies. It was found that the r<strong>and</strong>omly chosen frequenciescase does not reproduce the spectrum very well. We choose to use theuniform frequencies discretization of the spectrum with r<strong>and</strong>om phasesε n in equation (41). Note that the period of the simulation T 1 beforerepetition can be increased by choosing larger number of frequencies,i.e. larger Ω . The advantage of this is that the spectrum is wellpreserved as discussed below. In the test problem to follow, weconsider the multichromatic, uniform frequencies, r<strong>and</strong>om phases case<strong>and</strong> document how the model performs.Open Ocean Conditions:ITTC has adopted the Bretschneider spectrum as the st<strong>and</strong>ard waveenergy spectrum to represent the conditions which occur in the openocean. It is called the ITTC two-parameter spectrum, <strong>and</strong> is defined by( ) A ⎛ − ⎞= ⎜ ⎟5 exp BS B η ω4ω ⎝ ωm²/(rad/s) (44)⎠21 34Hwhere A = 172.752 / s 4691 −4m <strong>and</strong> B = s4TTClearly, the two parameters that are input to the wavemaker, (41), arethe significant wave height H 1 3 <strong>and</strong> the average period T , <strong>and</strong> we2πdefine ω = , (45)T<strong>and</strong> using the linear dispersion relation (12),2ωk = , (46)g2π<strong>and</strong> so λ = . (47)kIn analogy to regular waves, we can define the significant steepness:H13S 1 3 = . (48)λIn all cases, we choose a real number α > 1 , <strong>and</strong> setω Ω = αWM* ω(49)For the uniform frequencies case mentioned above, we chooseω − 1*1 = = Ω ω ω= Ω α ωω δω= WM. (50)Ω Ω + 1 Ω + 1We then define the period2π ⎛ Ω + 1 ⎞T1 = = ⎜⎟⎟ T , (51)ω1⎝ αWM ⎠<strong>and</strong> note that the resulting irregular wave will repeat with this period,since this is the lowest frequency in the spectrum <strong>and</strong> all thefrequencies are harmonically related. If we also choose the simulationtimeT S = N *T 1 , (51)for some natural number N , then all frequencies will be harmonicallyrelated to the "window" [ 0 ,T S ], used to evaluate the discrete Fouriertransform. One big advantage of this setup is that the problem of"leakage" in the discrete Fourier transform can be eliminated for thewavemaker. Clearly, this can never be strictly attained for the output<strong>from</strong> the model. However, even this inevitable leakage can be reducedby using special types of windows. This will be discussed in the nextsection concerning the tests. Also, see Briggs <strong>and</strong> Henson (1995).WMTEST PROBLEM AND CONCLUSIONSWe present the following tests designed to show that our model cangenerate <strong>and</strong> propagate multichromatic waves with reasonableaccuracy. This will be judged by comparing the mean period <strong>and</strong>significant waveheight, <strong>and</strong> the spectrum of the free surface elevation ata fixed point inside the tank, with that for the wavemaker.In our first test, we take Ω = 29 uniformly distributed frequencies,with α = 3 , <strong>and</strong> the parameters, T = 4. 0s<strong>and</strong> H1 3 = 0. 25minWMthe spectrum (44). Therefore, λ = 25.0m, <strong>and</strong> we set L = 250. 0m,with "10 waves" in the tank (not counting the beach), at steady-state,which gives the required mean wavelength, <strong>and</strong> significant steepness,S 0.01. The discretization parameters are ∆x = λ 40 ,1 3 =
∆z = λ 20 , <strong>and</strong> ∆ t = T 200 , <strong>and</strong> we plot the numericalapproximation of the free surface elevation { ( x,T S ) : 0 ≤ x ≤ L}T S 100T= 10.0T1η after= . See Figure (2). In Figure (2) the aboveparameters are shown in the figure for convenience. In Figures (3) <strong>and</strong>(6) we plot the free surface elevation of the wavemaker for this fullsimulation <strong>and</strong> it’s spectrum, respectively. Note that the wavemaker isperiodic with exactly 10 periods during the simulation <strong>and</strong> the spectrumgiven by (47) is well reproduced, see Figure (6). Recall the discussionabove on leakage of the Fourier transform. From Figure (3) themeasured mean period is 3.98 s with significant wave height 0.244 m.Again, we choose to generate periodic irregular waves to show that themodel was behaving as expected. To generate longer irregularnonperiodic waves we need to take more frequencies.Similarly, we plot the free surface elevationη ( 0.1* L , t ) : n = 1,2,...,generated by the model for this full{ }n N Tsimulation <strong>and</strong> it’s spectrum, respectively in Figures (4) <strong>and</strong> (7). Themeasured mean period is found to be 3.26 s with significant waveheight 0.246 m. Unlike the wavemaker which is exactly periodic, themodel is "almost periodic" with 10 "periods", as expected. Moreinterestingly, the spectrum given by (47) is reasonably well reproducedover most of the frequency range, with a couple of exceptions. We get alittle "overshoot" around the peak frequency, <strong>and</strong> the lower frequencymodes are lacking. This latter deficiency can be alleviated by taking alonger tank <strong>and</strong> a longer simulation time. The most importantdifference, however is that we get a bimodal spectrum, with theappearance of a second peak in the spectrum. We believe this is due tothe nonlinear generation of higher order modes <strong>and</strong> their interactions.See Parsons <strong>and</strong> Baddour (2003), where this is reported for the case ofa monochromatic <strong>and</strong> bichromatic wavemaker. Again, recalling thediscussion above on leakage, we point out that a "Gaussian" windowwas employed to reduce leakage. See Figure (5).In the second test, we take Ω = 299 uniformly distributed frequencieschosen for the above spectrum. Conditions are set such that thesimulation will not be periodic for 400 seconds. If a longer nonperiodicsimulation is required more frequencies may be chosen. The freesurface elevation at the wavemaker is shown in Figure (8) with theresulting free surface elevation generated by the model at the fixedlocation in the tank at x = 0. 1Lgiven in Figure (9). The spectrum ofthe wave maker is shown in Figure (10) along with the Bretschneiderspectrum. However, we purposely ran the model for more than anintegral number of periods to show the effect of leakage. The spectrumof the free surface elevation generated by the model again atx = 0. 1L is shown after 740 sec in Figure (11). Note that we still getthe "bimodal" spectrum as in the 29 frequencies case shown in Figure(7). Fig (12) shows the free surface elevation elevation after 1.85T 1 .FUTURE WORKWe showed in this paper that the waveform relaxation method that wesuccessfully applied to the generation <strong>and</strong> propagation ofmonochromatic transient long-crested nonlinear surface gravity waveson a two-dimensional rectangular basin of finite extent <strong>and</strong> infinitedepth containing an incompressible inviscid homogeneous fluidinitially at rest with a horizontal free surface can be extended to themultichromatic case. This involved the use of the full nonlineardynamic <strong>and</strong> kinematic boundary conditions, <strong>and</strong> the solution ofLaplace’s equation on a non-orthogonal curvilinear coordinate systemthat follows the free surface. Despite the fact that this required theLaplace matrix to be inverted at each time-step, we get an efficientaccurate method. Clearly, this efficiency becomes more significant forlarger problems. In particular for short-crested surface waves, ourproblem becomes fully three dimensional <strong>and</strong> such efficiency becomesessential. In addition, we can employ the dimensional decoupling ofwaveform relaxation methods to reduce the three dimensional problemto two iterated two dimensional problems, Parsons (1999).This dynamic Laplace solver permits us to generate <strong>and</strong> propagatetransient multichromatic waves, which are then completely absorbed bythe same numerical beach given in Parsons <strong>and</strong> Baddour (2002).Finally, we stated in the introduction of this paper, that these ideas canbe extended to the finite depth case as well as to physical wavemakersat the LHS boundary. In Parsons <strong>and</strong> Baddour (2002) we used theappropriate "hyperbolic profile" to facilitate the extension on aCartesian coordinate system for the linear proble. Using methods <strong>from</strong>Riemannian geometry, as extension of the free surface coordinatesystem used in this paper is being developed to construct a curvilinearcoordinate system for a domain with finite depth <strong>and</strong> irregular shapeddynamic bottom <strong>and</strong> side boundaries.ACKNOWLEDGEMENTSTo College of the North Atlantic, Newfoundl<strong>and</strong>, <strong>Canada</strong>, for givingWade Parsons a one year sabbatical.To Natural Sciences <strong>and</strong> Engineering Research Council of <strong>Canada</strong> <strong>and</strong>the National Research Council’s Institute for Ocean Technology,Newfoundl<strong>and</strong>, <strong>Canada</strong>, for awarding Wade Parsons a VisitingFellowship.REFERENCESBaddour, RE <strong>and</strong> Parsons, W (2003). ’’A comparison of Dirichlet <strong>and</strong>Neumann wavemakers for the numerical generation <strong>and</strong> propagationof transient long-crested surface waves,’’ Proc 22nd Int Conf onOffshore Mechanics <strong>and</strong> Arctic Engineering, OMAE, Cancun,Mexico, paper 37281. Also in Jour. of OMAE, accepted forpublication.Briggs, WL <strong>and</strong> Henson, VE (1995). The DFT, An owner’s manual forthe discrete Fourier transform, SIAM, Philadelphia.Debnath, L (1994). Nonlinear water waves, Academic Press, New YorkGoda, Y (2000). R<strong>and</strong>om seas <strong>and</strong> design of marine structures, WorldScientific, Singapore.Kaplan, W (1993). Advanced calculus, Fourth Edition, Addison-Wesley, Reading, Massachusetts.Parsons, W (1999). “Waveform relaxation methods for Volterraintegro-differential equations,” Ph.D. Thesis, MUN, St. John's, NL.Parsons, W <strong>and</strong> Baddour, RE (2003). “A numerical wavetank for thegeneration <strong>and</strong> propagation of bichromatic nonlinear long-crestedsurface waves”, Fluid Structure Interaction, Proc of Second IntConf, Wessex Institute of Technology Press, pp 407-420 .Parsons, W <strong>and</strong> Baddour, RE (2002). “The generation <strong>and</strong> propagationof transient long-crested surface waves using a waveform relaxationmethod, Advances in Fluid Mechanics, Proc Int Conf, WessexInstitute of Technology Press, pp 683-693.Tsai, W <strong>and</strong> Yue, DK (1996). Computation of free-surface flows,Annual Review of Fluid Mechanics, Vol. 28, Annual Reviews Inc.,Ca.Wehausen, JV <strong>and</strong> Laitone, EV (1960). Encyclopedia of Physics, Vol.IX, Fluid Dynamics III, Springer-Verlag, Berlin.
Figure 1 System configuration <strong>and</strong> coordinate systemχ( x,t)= Φ(x,η(x,t),t)∂η∂Φ ∂χ= sec 2 θ − tan θ∂t∂z∂x⎡ 22∂χ1 ⎛ ∂χ⎞ ⎛ ∂Φ ⎞⎥ ⎥ ⎤2= −gη− ⎢⎜⎟ − sec θ ⎜ ⎟∂t2 ⎢⎣⎝ ∂x⎠ ⎝ ∂z⎠ ⎦Figure 4 Free surface elevation in (m) at x=0.1L2∂ Φ2∂x2∂ Φ+2∂z= 0Figure 2 Free surface elevation after 100 periodsFigure5 Gaussian window of free surface elevation at x=0.1 LFigure 3 Free surface elevation in (m) of wavemaker at x=0Figure 6 FFT (eta at wavemaker x=0) with Guassian window
Figure 7 FFT (eta at x=0.1L) with Guassian windowFigure 10 Spectrum of surface elevation at x=0Figure 8 Free surface elevation at x=0Figure 11 Spectrum of Surface elevation at x=0.1LFigure 9 Free surface elevation at x=0.1LFigure 12 Free Surface Elevation after 1.85 T 1