ANNUAL REVIEW - Australian Centre For Financial Studies
ANNUAL REVIEW - Australian Centre For Financial Studies
ANNUAL REVIEW - Australian Centre For Financial Studies

You also want an ePaper? Increase the reach of your titles
YUMPU automatically turns print PDFs into web optimized ePapers that Google loves.
<strong>Australian</strong> Equities<br />
Database<br />
The Melbourne <strong>Centre</strong> for <strong>Financial</strong> <strong>Studies</strong>,<br />
together with ANZ Trustees, has developed a<br />
unique digital database of <strong>Australian</strong> Equities<br />
for the years 1966 to 1980. The database will<br />
present monthly pricing, capital, earnings,<br />
dividend, turnover, and related data for all<br />
listed industrial companies and major mining<br />
and oil companies.<br />
The database is designed to fill gaps<br />
which presently exist in available electronic<br />
databases of <strong>Australian</strong> shares as well as to<br />
provide a more comprehensive base for the<br />
analysis of portfolio formation strategies and<br />
capital asset pricing models.<br />
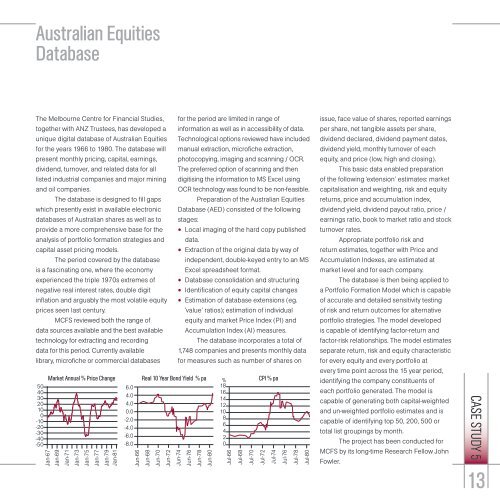
The period covered by the database<br />
is a fascinating one, where the economy<br />
experienced the triple 1970s extremes of<br />
negative real interest rates, double digit<br />
inflation and arguably the most volatile equity<br />
prices seen last century.<br />
MCFS reviewed both the range of<br />
data sources available and the best available<br />
technology for extracting and recording<br />
data for this period. Currently available<br />
library, microfiche or commercial databases<br />
50<br />
40<br />
30<br />
20<br />
100<br />
-10<br />
-20<br />
-30<br />
-40<br />
-50<br />
Jan-67<br />
Jan-69<br />
Jan-71<br />
Jan-73<br />
Jan-75<br />
Jan-77<br />
Jan-79<br />
Jan-81<br />
Jun-66<br />
Jun-68<br />
Jun-70<br />
Jun-72<br />
Jun-74<br />
Jun-76<br />
Jun-78<br />
Jun-80<br />
for the period are limited in range of<br />
information as well as in accessibility of data.<br />
Technological options reviewed have included<br />
manual extraction, microfiche extraction,<br />
photocopying, imaging and scanning / OCR.<br />
The preferred option of scanning and then<br />
digitising the information to MS Excel using<br />
OCR technology was found to be non-feasible.<br />
Preparation of the <strong>Australian</strong> Equities<br />
Database (AED) consisted of the following<br />
stages:<br />
• Local imaging of the hard copy published<br />
data.<br />
• Extraction of the original data by way of<br />
independent, double-keyed entry to an MS<br />
Excel spreadsheet format.<br />
• Database consolidation and structuring<br />
• Identification of equity capital changes<br />
• Estimation of database extensions (eg.<br />
‘value’ ratios); estimation of individual<br />
equity and market Price Index (PI) and<br />
Accumulation Index (AI) measures.<br />
The database incorporates a total of<br />
1,748 companies and presents monthly data<br />
for measures such as number of shares on<br />
Market Annual % Price Change Real 10 Year Bond Yield % pa CPI % pa<br />
6.0<br />
18 %<br />
16<br />
4.0<br />
14<br />
4.0<br />
12<br />
0.0<br />
10<br />
-2.0<br />
8<br />
6<br />
-4.0<br />
4<br />
-6.0<br />
2<br />
-8.0 0<br />
Jul-66<br />
Jul-68<br />
Jul-70<br />
Jul-72<br />
Jul-74<br />
Jul-76<br />
Jul-78<br />
Jul-80<br />
issue, face value of shares, reported earnings<br />
per share, net tangible assets per share,<br />
dividend declared, dividend payment dates,<br />
dividend yield, monthly turnover of each<br />
equity, and price (low, high and closing).<br />
This basic data enabled preparation<br />
of the following ‘extension’ estimates: market<br />
capitalisation and weighting, risk and equity<br />
returns, price and accumulation index,<br />
dividend yield, dividend payout ratio, price /<br />
earnings ratio, book to market ratio and stock<br />
turnover rates.<br />
Appropriate portfolio risk and<br />
return estimates, together with Price and<br />
Accumulation Indexes, are estimated at<br />
market level and for each company.<br />
The database is then being applied to<br />
a Portfolio <strong>For</strong>mation Model which is capable<br />
of accurate and detailed sensitivity testing<br />
of risk and return outcomes for alternative<br />
portfolio strategies. The model developed<br />
is capable of identifying factor-return and<br />
factor-risk relationships. The model estimates<br />
separate return, risk and equity characteristic<br />
for every equity and every portfolio at<br />
every time point across the 15 year period,<br />
identifying the company constituents of<br />
each portfolio generated. The model is<br />
capable of generating both capital-weighted<br />
and un-weighted portfolio estimates and is<br />
capable of identifying top 50, 200, 500 or<br />
total list groupings by month.<br />
The project has been conducted for<br />
MCFS by its long-time Research Fellow John<br />
Fowler.<br />
CASE STUDY 5<br />
13