Visualizing graphs and clusters as maps - Graphviz
Visualizing graphs and clusters as maps - Graphviz
Visualizing graphs and clusters as maps - Graphviz

You also want an ePaper? Increase the reach of your titles
YUMPU automatically turns print PDFs into web optimized ePapers that Google loves.
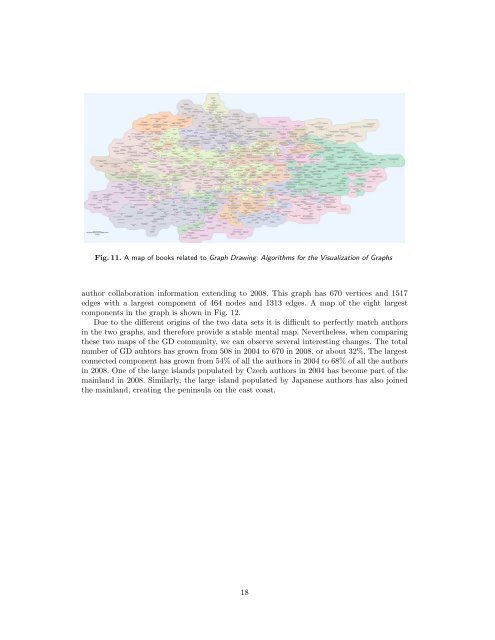
Fig. 11. A map of books related to Graph Drawing: Algorithms for the Visualization of Graphs<br />
author collaboration information extending to 2008. This graph h<strong>as</strong> 670 vertices <strong>and</strong> 1517<br />
edges with a largest component of 464 nodes <strong>and</strong> 1313 edges. A map of the eight largest<br />
components in the graph is shown in Fig. 12.<br />
Due to the different origins of the two data sets it is difficult to perfectly match authors<br />
in the two <strong>graphs</strong>, <strong>and</strong> therefore provide a stable mental map. Nevertheless, when comparing<br />
these two <strong>maps</strong> of the GD community, we can observe several interesting changes. The total<br />
number of GD auhtors h<strong>as</strong> grown from 508 in 2004 to 670 in 2008, or about 32%. The largest<br />
connected component h<strong>as</strong> grown from 54% of all the authors in 2004 to 68% of all the authors<br />
in 2008. One of the large isl<strong>and</strong>s populated by Czech authors in 2004 h<strong>as</strong> become part of the<br />
mainl<strong>and</strong> in 2008. Similarly, the large isl<strong>and</strong> populated by Japanese authors h<strong>as</strong> also joined<br />
the mainl<strong>and</strong>, creating the peninsula on the e<strong>as</strong>t co<strong>as</strong>t.<br />
18