
You also want an ePaper? Increase the reach of your titles
YUMPU automatically turns print PDFs into web optimized ePapers that Google loves.
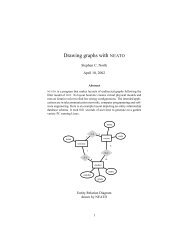
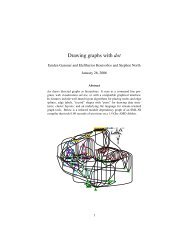
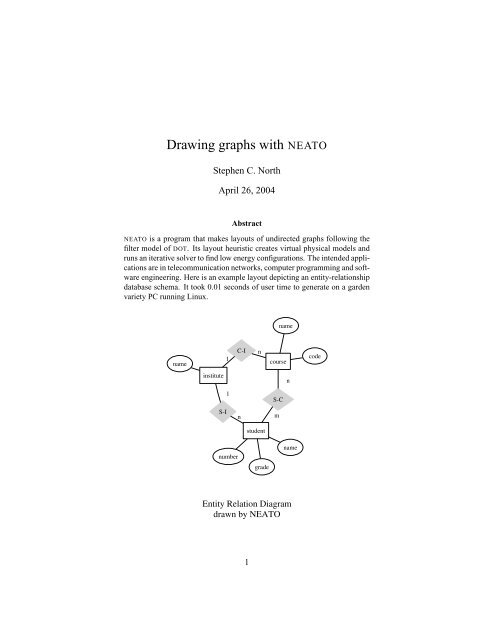
<strong>Drawing</strong> <strong>graphs</strong> <strong>with</strong> <strong>NEATO</strong>Stephen C. NorthApril 26, 2004Abstract<strong>NEATO</strong> is a program that makes layouts of undirected <strong>graphs</strong> following thefilter model of DOT. Its layout heuristic creates virtual physical models andruns an iterative solver to find low energy configurations. The intended applicationsare in telecommunication networks, computer programming and softwareengineering. Here is an example layout depicting an entity-relationshipdatabase schema. It took 0.01 seconds of user time to generate on a gardenvariety PC running Linux.namename1C-Incoursecodeinstituten1S-CS-InmstudentnumbergradenameEntity Relation Diagramdrawn by <strong>NEATO</strong>1
<strong>NEATO</strong> User’s Manual, April 26, 2004 21 Introduction<strong>NEATO</strong> is a utility that draws undirected <strong>graphs</strong>, which are common in telecommunicationsand computer programming. It draws a graph by constructing a virtualphysical model and running an iterative solver to find a low-energy configuration.Following an approach proposed by Kamada and Kawai [KK89], an ideal springis placed between every pair of nodes such that its length is set to the shortest pathdistance between the endpoints. The springs push the nodes so their geometric distancein the layout approximates their path distance in the graph. This often yieldsreasonable layouts [Ead84][FR91]. (In statistics, this algorithm is also known asmultidimensional scaling. Its application to graph drawing was noted by Kruskaland Seery in the late 1970s.)<strong>NEATO</strong> is compatible <strong>with</strong> the directed graph drawing program DOT in sharingthe same input file format and graphics drivers [KN91]. Since the file formatincludes both undirected and directed <strong>graphs</strong>, <strong>NEATO</strong> draws <strong>graphs</strong> prepared forDOT, and vice versa. Both programs have the same options for setting labels, colors,shapes, text fonts, and pagination, and for generating code in common graphicslanguages (PostScript, raster formats such as GIF and PNG, SVG, FrameMakerMIF, HPGL/2, and web click maps). Both work <strong>with</strong> DOTTY, an interactive graphviewer for X windows. (The lneato command script runs neato from an interactivewindow.)Figs. 1–4 are representative examples of <strong>NEATO</strong>’s output. The timings refer touser time on a 600 Mhz Pentium Linux server. Fig. 1 was derived from a handmadedrawing in an operating system tutorial. Fig. 2 shows the connectivity of acomputer network. Fig. 3 shows the sharing of programmer-defined types betweenprocedures in a C program. The program that was the source of this graph parses atext file into an internal data structure. The graph was extracted from a C programdatabase. Its drawing shows where interactions or conversions between types mayoccur. Finally, Fig. 4 shows relationships between IMRs (modification requests)in an externally released software product. 1 The labeled nodes are IMRs and thesmall circles encode many-to-many dependencies.1 Graph courtesy of J. Hoshen, Bell Labs.
<strong>NEATO</strong> User’s Manual, April 26, 2004 3graph G {run -- intr;intr -- runbl;runbl -- run;run -- kernel;kernel -- zombie;kernel -- sleep;kernel -- runmem;sleep -- swap;swap -- runswap;runswap -- new;runswap -- runmem;new -- runmem;sleep -- runmem;}zombierunblintrrunkernelsleeprunmemnew runswapswapFigure 1: Process States in an Operating System Kernel (0.03 seconds)FLLZDRANFJMVMTERALCWH1HO3HRMHHO1IH1IWIHPERCCBHVIH2IH4IHCMLMFigure 2: R&D Internet Backbone (0.08 seconds)
<strong>NEATO</strong> User’s Manual, April 26, 2004 4check_bufferprefixmaininit_spec_tableout_headingopen_sourceout_datarelspec_datafill_spec_tableout_relinfocheck_fclosespec_headingcheck_fopenmatchFigure 3: Type Sharing Between Procedures in a C Program (0.41 seconds)
<strong>NEATO</strong> User’s Manual, April 26, 2004 5354221375319377562 373300375134355080375499 377220354878355288 354785 358159 358584356741 360672355800358155 360144354546354771357538378108 356116360839 360104354757357793357340354766 371187357769 358157358471370510353506370509375024 375027354290379864358224379422 376956379339383039376529377801381710381775382574358900357430375557380448 377980372568380526380475370706379169379341380298379972378666378362379968377924377908 377971378656382928382103 375508374700 374741383174 374886375507375039 377763381211380571377719382161382827379848 381835381901371942382409 380604 381897375519 377380352010358930374300384096359471379126380285379212359100380963384909382528382566382436382572358866371943341411Figure 4: IMR Dependencies (6.75 seconds)
<strong>NEATO</strong> User’s Manual, April 26, 2004 6$ cat example.dotgraph G {n0 -- n1 -- n2 -- n3 -- n0;}$ neato -Tps example.dot -o example.psn0n1n2n3Figure 5: Example Graph <strong>Drawing</strong>2 Graph <strong>Drawing</strong>2.1 Basic CommandsThe remainder of this memo gives a synopsis of <strong>NEATO</strong> features. Many of theseshould be familiar to users of DOT. Fig. 5 shows a graph file, its drawing, and thecommand that was executed. A graph file has a short header and a body consistingof nodes, edges, and attribute assignments. By default, nodes are drawn as ellipseslabeled <strong>with</strong> node names. Undirected edges are created by the -- operator. Edgesare drawn as straight lines and tend to be all about the same length.2.2 <strong>Drawing</strong> OptionsTable 1 lists the graph, node and edge attributes that affect the layout. The optionsto set labels, shapes, fonts, and sizes are convenient for many kinds of layouts. Thedrawing in figure 6 illustrates some of these features. 2 Options to set the size of thedrawing, pagination, and output graphics language are also the same as in DOT.3 Adjusting LayoutsAlthough layouts made by <strong>NEATO</strong> are close to a local optimum as defined by theforces the springs exert on the nodes, fine tuning or generation of alternative layoutsmay improve readability. Because <strong>NEATO</strong> uses unconstrained optimization, it doesnot enforce minimum separation constraints between nodes or between edges and2 Graph courtesy of Hector Zamora, DEFINITY.
<strong>NEATO</strong> User’s Manual, April 26, 2004 7Fl #3Bl #2l #5l #1l #1EA1 l #6Al #8 l #7A2A3l #3l #4l #2l #1Cl #1graph G {node [shape=box,style=filled];{node [width=.3,height=.3,shape=octagon,style=filled,color=skyblue] A1 A2 A3}A -- A1 [label="l #6"];A -- A2 [label="l #7"];A -- A3 [label="l #8"];{edge [style=invis]; A1 -- A2 -- A3}D}edge [len=3]; /* applies to all following edges */A -- B [label="l #1"]; A -- C [label="l #2"]; A -- D [label="l #3"];A -- E [label="l #4"]; A -- F [label="l #5"]; B -- C [label="l #1"];B -- E [label="l #2"]; B -- F [label="l #3"]; C -- D [label="l #1"];D -- E [label="l #1"];Figure 6: Node and Edge Options
<strong>NEATO</strong> User’s Manual, April 26, 2004 8nonadjacent nodes, so in dense <strong>graphs</strong> nodes and edges can be too close or overlap.There are three ways of trying to correct these errors:1) change the initial configuration2) adjust the solver parameters3) edit the input edge lengths and weights.3.1 Initial ConfigurationIf no options are given, <strong>NEATO</strong> always makes the same drawing of a given graphfile, because its initial node placement and the solver are deterministic. Randominitial placement can yield different layouts. It is sometimes reasonable to makeat least several different trial layouts, and accept the best one. Random initialplacement is requested by setting the value of the graph attribute start. If thevalue is a number, it is taken as a seed for the random number generator. The layoutis different for each seed, but still deterministic. If the value is not a number, theprocess ID or current time is used. Each run potentially yields a different drawing.For example:$ neato -Tps -Gstart=rand file.dot > file.ps3.2 Termination ThresholdThe solver is a Newton-Raphson algorithm that moves a node <strong>with</strong> a maximal δe onevery iteration. The solver terminates when δe falls below some ɛ. The default (.1)is low enough that the layout is usually close to a local minimum, but not so lowthat the solver runs for a long time <strong>with</strong>out making significant progress. Smallervalues of ɛ allow the solver run longer and potentially give better layouts. Largervalues can decrease <strong>NEATO</strong>’s running time but <strong>with</strong> a reduction in layout quality.This may be a desirable tradeoff for large <strong>graphs</strong>. ɛ is set in the graph’s epsilonvariable. You can also directly limit the number of iterations. It is convenient to dothis on the command line:$ neato -Tps -Gepsilon=.001 small.dot -o small.ps$ neato -Tps -Gepsilon=1.5 big.dot -o big.ps$ neato -Tps -Gmaxiter=1000 big.dot -o big.ps3.3 Edge Lengths and WeightsSince the layout depends on the input edge lengths and their weights, these cansometimes be adjusted to good effect. The length of an edge is the preferred distancebetween the endpoint nodes. Its weight is the strength of the corresponding
<strong>NEATO</strong> User’s Manual, April 26, 2004 9n0n3graph G {n0 -- n1 [len=2, style=bold];n1 -- n2 -- n3 -- n0;}n1n2Figure 7: Example graph <strong>with</strong> an edge stretchedn2graph G {n0 [ pos = "0,0!" ];n1 [ pos = "2,0" ];n2 [ pos = "2,2!" ];n0 -- n1 -- n2 -- n3 -- n0;}n0n1n3Figure 8: Example graph <strong>with</strong> nodes pinnedspring, and affects the cost if it is stretched or compressed. Invisible edges can alsobe inserted to adjust node placement. In figure 6, the length of some edges was setto 3 to make them longer than the default. Also, the two invisible edges affect A1,A2, and A3.There is also a way to also give the initial or final coordinates of individualnodes. The initial position, formatted as two comma-separated numbers, is enteredin a node’s pos attribute. If ! is given as a suffix, the node is also pinned down.4 Eliminating OverlapsTo improve clarity, it is sometimes helpful to eliminate overlapping nodes or edges.One way to eliminate node overlaps is just to scale up the layout (in terms of the
<strong>NEATO</strong> User’s Manual, April 26, 2004 10Name Default ValuesNode Attributesshape ellipse ellipse, box, circle, doublecircle, diamond,plaintext, record, polygonheight,width .5,.75 height and width in incheslabel node name any stringfontsize 14 point size of labelfontname Times-Roman font family name, e.g. Courier, Helveticafontcolor black type face colorstylegraphics options, e.g. bold, dotted, filledcolor black node shape colorposinitial coordinates (append ! to pin node)Edge Attributesweight 1.0 strength of edge springlabellabel, if not emptyfontsize 14 point size of labelfontname Times-Roman font family namefontcolor black type face colorstylegraphics options, e.g. bold, dotted, dashedcolor black edge stroke colorlen 1.0 preferred length of edgedir none forward, back, both, or nonedecorateif set, draws a line connecting labels <strong>with</strong> their edgesidoptional value to distinguish multiple edgesGraph Attributesstartseed for random number generatorsizedrawing bounding box, in inchespage unit of pagination, e.g. 8.5,11margin .5,.5 margin included in pagelabelcaption for graph drawingfontsize 14 point size of labelfontname Times-Roman font family namefontcolor black type face colororientation portrait may be set to landscapecenterwhen set, centers drawing on pageoverlap true may be set to false or scalesplines false true makes edge splines if nodes don’t overlapsep 0 edge spline separation factor from nodes - try .1Table 1: <strong>Drawing</strong> attributes
<strong>NEATO</strong> User’s Manual, April 26, 2004 11center points of the nodes) as much as needed. This is enabled by setting the graphattribute overlap=scale. This transformation preserves the overall geometricrelationships in the layout, but in bad cases can require high scale factors. Anotherway to eliminate node overlaps employs an interative heuristic. On each iteration,a bounded Voronoi diagram of the node center points is computed, and each nodeis moved to the center of its Voronoi cell. This is repeated until all overlaps areeliminated. A side-effect (perhaps unwanted) is that the adjusted layout tends tofill the bounding rectangle of the Voronoi diagram. The heuristic is activated bysetting overlap=false.Edge overlaps (<strong>with</strong> nodes) can be prevented by drawing them <strong>with</strong> splinecurves (<strong>with</strong> splines=true). Note that the spline drawing heuristic is expensiveand probably should not be attempted on <strong>graphs</strong> that have more than a fewdozen nodes.Areas for future work include non-rectangular Voronoi boundaries, faster edgerouting heuristics, and techniques to prevent unnecessary edge intersections.5 Acknowledgments<strong>NEATO</strong>’s layout heuristic follows the work of Kamada and Kawai [KK89]. The implementationwas originally part of the SALEM 3D viewer for mathematical structureswritten <strong>with</strong> David Dobkin and Nathaniel Thurston. In converting <strong>NEATO</strong> toa more traditional tool, the graphics code generator was borrowed from DOT. Thisincludes code contributed by John Ellson and Emden Gansner. Steve Eick was anearly user and offered some good suggestions about ways to adjust layouts. EmdenGansner also contributed the heuristics for eliminating node overlaps, based on apaper by David Rappaport and Kelly Lyons.References[Ead84] Peter Eades. A Heuristic for Graph <strong>Drawing</strong>. In Congressus Numerantium, volume42, pages 149–160, 1984.[FR91]Thomas M. J. Fruchterman and Edward M. Reingold. Graph <strong>Drawing</strong> by ForcedirectedPlacement. Software– Practice and Experience, 21(11):1129–1164,November 1991.[KK89] T. Kamada and S. Kawai. An algorithm for drawing general undirected <strong>graphs</strong>.Information Processing Letters, 31(1):7–15, April 1989.[KN91] Eleftherios Koutsofios and Stephen North. <strong>Drawing</strong> <strong>graphs</strong> <strong>with</strong> dot. TechnicalReport 910904-59113-08TM, AT&T Bell Laboratories, Murray Hill, NJ,September 1991.