The Rural Water Livelihoods Index - FAO
The Rural Water Livelihoods Index - FAO
The Rural Water Livelihoods Index - FAO
Create successful ePaper yourself
Turn your PDF publications into a flip-book with our unique Google optimized e-Paper software.
26<br />
<strong>The</strong> <strong>Rural</strong> <strong>Water</strong> <strong>Livelihoods</strong> <strong>Index</strong><br />
5. Results<br />
<strong>The</strong> calculation of the RWLI in the manner described above resulted in a score for each country on both the components<br />
and subcomponents. <strong>The</strong>se scores are presented in detail in Appendix III, and the distribution of RWLI scores across all<br />
countries are shown in Figure 6:<br />
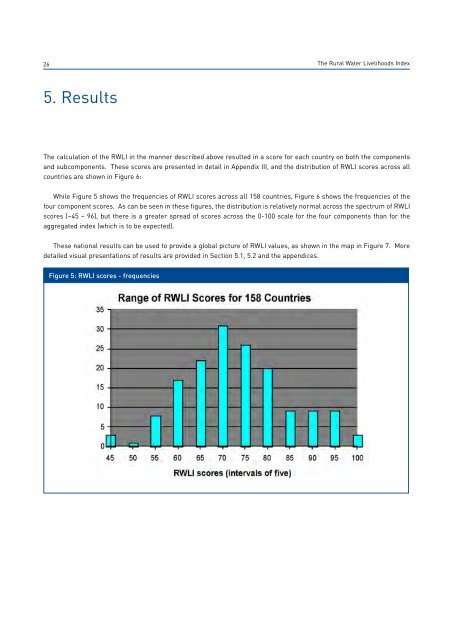
While Figure 5 shows the frequencies of RWLI scores across all 158 countries, Figure 6 shows the frequencies of the<br />
four component scores. As can be seen in these figures, the distribution is relatively normal across the spectrum of RWLI<br />
scores (~45 – 96), but there is a greater spread of scores across the 0-100 scale for the four components than for the<br />
aggregated index (which is to be expected).<br />
<strong>The</strong>se national results can be used to provide a global picture of RWLI values, as shown in the map in Figure 7. More<br />
detailed visual presentations of results are provided in Section 5.1, 5.2 and the appendices.<br />
Figure 5: RWLI scores - frequencies


