World Development Indicators 2013 - Open Knowledge Repository ...
World Development Indicators 2013 - Open Knowledge Repository ...
World Development Indicators 2013 - Open Knowledge Repository ...

You also want an ePaper? Increase the reach of your titles
YUMPU automatically turns print PDFs into web optimized ePapers that Google loves.
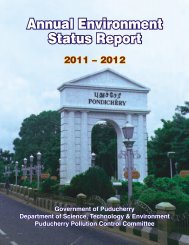
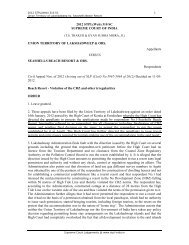
The world by incomeLow ($1,025 or less)Lower middle ($1,026–$4,035)Upper middle ($4,036–$12,475)Classified according to<strong>World</strong> Bank estimates of2011 GNI per capitaHigh ($12,476 or more)No dataGreenland(Den)FijiSamoaAmericanSamoa (US)TongaKiribatiFrench Polynesia (Fr)DominicanRepublicAruba (Neth)PuertoRico (US)U.S. VirginIslands (US)Curaçao (Neth)R.B. de VenezuelaMexicoSt. Kittsand NevisSt. Vincent andthe GrenadinesUnited StatesCayman Is.(UK)St. Martin (Fr)St. Maarten (Neth)Antigua and BarbudaGuadeloupe (Fr)DominicaMartinique (Fr)St. LuciaGrenadaCanadaCosta RicaTrinidadand TobagoCubaBelize JamaicaGuatemala HondurasEl Salvador NicaraguaPanamaEcuadorBarbadosThe BahamasHaitiColombiaPeruBermuda(UK)Turks and Caicos Is. (UK)R.B. deVenezuelaChileBoliviaGuyanaSurinameFrench Guiana (Fr)ParaguayArgentinaBrazilUruguayGermanyIcelandPolandCzech RepublicUkraineSlovak RepublicAustriaSloveniaCroatiaHungaryRomaniaBosnia andHerzegovina SerbiaSanMarinoKosovo BulgariaItaly Montenegro FYRMacedoniaVaticanAlbaniaCityGreeceFaeroe NorwayIslands(Den) Sweden FinlandThe NetherlandsEstoniaIsle of Man (UK)Denmark Russian LatviaFed. LithuaniaUnitedIreland Kingdom Germany Poland BelarusChannel Islands (UK)BelgiumUkraineLuxembourgMoldovaLiechtensteinFrance ItalyRomaniaSwitzerlandAndorraBulgaria GeorgiaPortugalSpainArmeniaTurkeyMonacoGreeceCyprus SyrianGibraltar (UK)TunisiaMalta LebanonArabRep.MoroccoIsraelIraqWest Bank and Gaza JordanAlgeriaLibya Arab Rep.of EgyptWesternSaharaMauritaniaOmanCape VerdeMaliNigerChadSenegalSudan Eritrea Rep. of YemenThe GambiaBurkinaGuinea-BissauFasoDjiboutiGuineaBeninSierra Leone Côted’Ivoire Ghana Nigeria CentralEthiopiaAfrican SouthLiberiaRepublic SudanCameroonTogoSomaliaEquatorial GuineaUgandaSão Tomé and PríncipeGabon CongoKenyaRwandaDem.Rep.of BurundiSeychellesCongoTanzaniaComorosAngolaNamibiaZambiaBotswanaSouthAfricaMalawiMozambiqueZimbabweMadagascarLesothoSwazilandAzerbaijanSaudiArabiaMayotte(Fr)Islamic Rep.of IranKuwaitBahrainQatarTurkmenistanUnited ArabEmiratesKazakhstanUzbekistanRéunion (Fr)AfghanistanMauritiusKyrgyzRep.TajikistanRussian FederationPakistanIndiaMaldivesBhutanNepalSriLankaMongoliaBangladeshChinaMyanmarLaoP.D.R.ThailandVietnamCambodiaBrunei DarussalamMalaysiaSingaporeDem.People’sRep.of KoreaRep.ofKoreaPhilippinesIndonesiaJapanN. Mariana Islands (US)Timor-LesteAustraliaGuam (US)PalauFederated States of MicronesiaPapua New GuineaNewZealandNauruSolomonIslandsVanuatuNewCaledonia(Fr)Marshall IslandsKiribatiTuvaluFijiAntarcticaIBRD 39817 MARCH <strong>2013</strong>Designed, edited, and produced byCommunications <strong>Development</strong> Incorporated,Washington, D.C.,with Peter Grundy Art & Design, London
<strong>2013</strong><strong>World</strong> <strong>Development</strong><strong>Indicators</strong>
© <strong>2013</strong> International Bank for Reconstruction and <strong>Development</strong> / The <strong>World</strong> Bank1818 H Street NW, Washington DC 20433Telephone: 202-473-1000; Internet: www.worldbank.orgSome rights reserved1 2 3 4 16 15 14 13This work is a product of the staff of The <strong>World</strong> Bank with external contributions. Note that The <strong>World</strong>Bank does not necessarily own each component of the content included in the work. The <strong>World</strong> Banktherefore does not warrant that the use of the content contained in the work will not infringe onthe rights of third parties. The risk of claims resulting from such infringement rests solely with you.The findings, interpretations, and conclusions expressed in this work do not necessarily reflect theviews of The <strong>World</strong> Bank, its Board of Executive Directors, or the governments they represent. The<strong>World</strong> Bank does not guarantee the accuracy of the data included in this work. The boundaries,colors, denominations, and other information shown on any map in this work do not imply any judgmenton the part of The <strong>World</strong> Bank concerning the legal status of any territory or the endorsementor acceptance of such boundaries.Nothing herein shall constitute or be considered to be a limitation upon or waiver of the privilegesand immunities of The <strong>World</strong> Bank, all of which are specifically reserved.Rights and PermissionsThis work is available under the Creative Commons Attribution 3.0 Unported license (CC BY 3.0)http://creativecommons.org/licenses/by/3.0. Under the Creative Commons Attribution license,you are free to copy, distribute, transmit, and adapt this work, including for commercial purposes,under the following conditions:Attribution—Please cite the work as follows: <strong>World</strong> Bank. <strong>2013</strong>. <strong>World</strong> <strong>Development</strong> <strong>Indicators</strong><strong>2013</strong>. Washington, DC: <strong>World</strong> Bank. doi: 10.1596/978-0-8213-9824-1. License: CreativeCommons Attribution CC BY 3.0Translations—If you create a translation of this work, please add the following disclaimer alongwith the attribution: This translation was not created by The <strong>World</strong> Bank and should not beconsidered an official <strong>World</strong> Bank translation. The <strong>World</strong> Bank shall not be liable for anycontent or error in this translation.All queries on rights and licenses should be addressed to the Office of the Publisher, The <strong>World</strong>Bank, 1818 H Street NW, Washington, DC 20433, USA; fax: 202-522-2625; e-mail: pubrights@worldbank.org.ISBN (paper): 978-0-8213-9824-1ISBN (electronic): 978-0-8213-9825-8DOI: 10.1596/978-0-8213-9824-1Cover photo: Arne Hoel/<strong>World</strong> Bank; Cover design: Communications <strong>Development</strong> Incorporated.Other photos: page xviii, Arne Hoel/<strong>World</strong> Bank; page 34, Kim Eun Yeul/<strong>World</strong> Bank; page 50, CurtCarnemark/<strong>World</strong> Bank; page 64, Gerardo Pesantez/ <strong>World</strong> Bank; page 78, Maria Fleischmann/<strong>World</strong> Bank; page 92, Curt Carnemark/<strong>World</strong> Bank.
PrefaceWelcome to <strong>World</strong> <strong>Development</strong> <strong>Indicators</strong> <strong>2013</strong>, the<strong>World</strong> Bank’s premier compilation of relevant, highquality,and internationally comparable statisticsabout global development.The first edition of <strong>World</strong> <strong>Development</strong> <strong>Indicators</strong>in 1997 included this forecast: “The global economyis undergoing an information revolution that will beas significant in effect as the industrial revolution ofthe nineteenth century.” At that time the number ofmobile phones worldwide was estimated to be lessthan 2 per 100 people, with eight times as manytelephone mainlines. <strong>World</strong> <strong>Development</strong> <strong>Indicators</strong>has tracked the revolution: this edition reports thatmobile phone subscriptions in 2011 grew to 85 per100 people—a more than fortyfold increase.This is just one example of how people were communicatingand acquiring knowledge and how informationwas changing. But in addition to measuringthe change, <strong>World</strong> <strong>Development</strong> <strong>Indicators</strong> has felt itdirectly. Use of the online database and the toolsthat access it—particularly the <strong>Open</strong> Data website(http://data.worldbank.org), the web-based DataBankquery application (http://databank.worldbank.org),and applications for mobile devices—has increaseddramatically.And so we have refined and improved the presentationof this 17th edition. Our aim is to find thebest way to put data in the hands of policymakers,development specialists, students, and the public,so that they may use the data to reduce poverty andsolve the world’s most pressing development challenges.The biggest change is that the data tablespreviously published in the book are now availableonline (http://wdi.worldbank.org/tables). This hasmany advantages: The tables will reflect the latestadditions and revisions to the data. They will be availableto a far greater audience. And they will be freefor everyone.<strong>World</strong> <strong>Development</strong> <strong>Indicators</strong> <strong>2013</strong> is organizedaround six themes—world view, people, environment,economy, states and markets, and global links. Eachsection includes an introduction, a set of six storieshighlighting regional trends, a table of the most relevantand popular indicators, and an index to the fullset of tables and indicators available online. <strong>World</strong>view also reviews progress toward the Millennium<strong>Development</strong> Goals.Other companion products include The Little DataBook <strong>2013</strong>, which provides an at-a-glance view of indicatorsfor each economy, and a new version of theDataFinder mobile application, available in Chinese,English, French, and Spanish and designed to reflectthe structure and tables of <strong>World</strong> <strong>Development</strong> <strong>Indicators</strong><strong>2013</strong>, for both tablet and handheld devices andfor all major mobile platforms (http://data.worldbank.org/apps).<strong>World</strong> <strong>Development</strong> <strong>Indicators</strong> is the result of acollaborative effort of many partners: the UnitedNations family, the International Monetary Fund, theInternational Telecommunication Union, the Organisationfor Economic Co-operation and <strong>Development</strong>,the statistical offices of more than 200 economies,and countless others. I extend my gratitude to themall—and especially to government statisticians aroundthe world. Without their hard work, professionalism,and dedication, measuring and monitoring trends inglobal development would not be possible.We hope you will find the new <strong>World</strong> <strong>Development</strong><strong>Indicators</strong> a useful resource, and we welcome any suggestionsto improve it at data@worldbank.org.Shaida BadieeDirector<strong>Development</strong> Economics Data GroupEconomy States and markets Global links Back<strong>World</strong> <strong>Development</strong> <strong>Indicators</strong> <strong>2013</strong> iii
AcknowledgmentsThis book was prepared by a team led by Soong SupLee under the management of Neil Fantom and comprisingAzita Amjadi, Liu Cui, Federico Escaler, MahyarEshragh-Tabary, Juan Feng, Masako Hiraga, WendyVen-dee Huang, Bala Bhaskar Naidu Kalimili, BuyantKhaltarkhuu, Elysee Kiti, Alison Kwong, Ibrahim Levent,Hiroko Maeda, Johan Mistiaen, Vanessa Moreirada Silva, Maurice Nsabimana, Beatriz Prieto-Oramas,William Prince, Evis Rucaj, Rubena Sukaj, Emi Suzuki,Eric Swanson, Jomo Tariku, Rasiel Victor Vellos, andOlga Victorovna Vybornaia, working closely with otherteams in the <strong>Development</strong> Economics Vice Presidency’s<strong>Development</strong> Data Group.<strong>World</strong> <strong>Development</strong> <strong>Indicators</strong> electronic productswere prepared by a team led by Reza Farivari and comprisingYing Chi, Jean‐Pierre Djomalieu, Ramgopal Erabelly,Shelley Fu, Gytis Kanchas, Siddhesh Kaushik,Ugendran Machakkalai, Nacer Megherbi, ShanmugamNatarajan, Parastoo Oloumi, Manish Rathore, AshishShah, Atsushi Shimo, Malarvizhi Veerappan, andVera Wen.All work was carried out under the direction ofShaida Badiee. Valuable advice was provided byTito Cordella, Doerte Doemeland, Zia M. Qureshi, andDavid Rosenblatt.The choice of indicators and text content was shapedthrough close consultation with and substantial contributionsfrom staff in the <strong>World</strong> Bank’s four thematicnetworks—Sustainable <strong>Development</strong>, Human <strong>Development</strong>,Poverty Reduction and Economic Management,and Financial and Private Sector <strong>Development</strong>—andstaff of the International Finance Corporation and theMultilateral Investment Guarantee Agency. Most important,the team received substantial help, guidance, anddata from external partners. For individual acknowledgmentsof contributions to the book’s content, seeCredits. For a listing of our key partners, see Partners.Communications <strong>Development</strong> Incorporated providedoverall design direction, editing, and layout,led by Meta de Coquereaumont, Jack Harlow, BruceRoss-Larson, and Christopher Trott. Elaine Wilson createdthe cover and graphics and typeset the book.Peter Grundy, of Peter Grundy Art & Design, and DianeBroadley, of Broadley Design, designed the report.Staff from The <strong>World</strong> Bank’s Office of the Publisheroversaw printing and dissemination of the book.iv <strong>World</strong> <strong>Development</strong> <strong>Indicators</strong> <strong>2013</strong> Front ? User guide <strong>World</strong> view People Environment
Table of contentsPrefaceiiiAcknowledgmentsivPartnersviUser guidexii1. <strong>World</strong> view12. People353. Environment51IntroductionGoal 1 Eradicate extreme povertyGoal 2 Achieve universal primary educationGoal 3 Promote gender equality andempower womenGoal 4 Reduce child mortalityGoal 5 Improve maternal healthGoal 6 Combat HIV/AIDS, malaria, andother diseasesGoal 7 Ensure environmental sustainabilityGoal 8 Develop a global partnership fordevelopmentTargets and indicators for each goal<strong>World</strong> view indicatorsAbout the dataOnline tables and indicatorsPoverty indicators NEW!About the data4. Economy655. States and markets796. Global links93IntroductionHighlightsTable of indicatorsAbout the dataOnline tables and indicatorsPrimary data documentation 107Statistical methods 118Credits121Economy States and markets Global links Back<strong>World</strong> <strong>Development</strong> <strong>Indicators</strong> <strong>2013</strong> v
PartnersDefining, gathering, and disseminating internationalstatistics is a collective effort of many people andorganizations. The indicators presented in <strong>World</strong> <strong>Development</strong><strong>Indicators</strong> are the fruit of decades of work atmany levels, from the field workers who administercensuses and household surveys to the committeesand working parties of the national and internationalstatistical agencies that develop the nomenclature,classifications, and standards fundamental to aninternational statistical system. Nongovernmentalorganizations and the private sector have also madeimportant contributions, both in gathering primarydata and in organizing and publishing their results.And academic researchers have played a crucial rolein developing statistical methods and carrying on acontinuing dialogue about the quality and interpretationof statistical indicators. All these contributorshave a strong belief that available, accurate data willimprove the quality of public and private decisionmaking.The organizations listed here have made <strong>World</strong><strong>Development</strong> <strong>Indicators</strong> possible by sharing their dataand their expertise with us. More important, their collaborationcontributes to the <strong>World</strong> Bank’s efforts, andto those of many others, to improve the quality of lifeof the world’s people. We acknowledge our debt andgratitude to all who have helped to build a base ofcomprehensive, quantitative information about theworld and its people.For easy reference, web addresses are included foreach listed organization. The addresses shown wereactive on March 1, <strong>2013</strong>.vi <strong>World</strong> <strong>Development</strong> <strong>Indicators</strong> <strong>2013</strong> Front ? User guide <strong>World</strong> view People Environment
International and government agenciesCarbon Dioxide InformationAnalysis CenterInternationalDiabetes Federationhttp://cdiac.ornl.govCentre for Research on theEpidemiology of Disasterswww.idf.orgInternationalEnergy Agencywww.emdat.beDeutsche Gesellschaft fürInternationale Zusammenarbeitwww.iea.orgInternationalLabour Organizationwww.giz.deFood and AgricultureOrganizationwww.ilo.orgInternationalMonetary Fundwww.fao.orgInternal DisplacementMonitoring Centrewww.imf.orgInternational TelecommunicationUnionwww.internal-displacement.org/International CivilAviation Organizationwww.itu.intJoint United Programmeon HIV/AIDSwww.icao.intwww.unaids.orgEconomy States and markets Global links Back<strong>World</strong> <strong>Development</strong> <strong>Indicators</strong> <strong>2013</strong> vii
PartnersNational ScienceFoundationUnited Nations Centre for HumanSettlements, Global Urban Observatorywww.nsf.govThe Office of U.S. ForeignDisaster Assistancewww.unhabitat.orgUnited NationsChildren’s Fundwww.globalcorps.com/ofda.htmlOrganisation for EconomicCo-operation and <strong>Development</strong>www.unicef.orgUnited Nations Conference onTrade and <strong>Development</strong>www.oecd.orgStockholm InternationalPeace Research Institutewww.unctad.orgUnited Nations Department ofEconomic and Social Affairs,Population Divisionwww.sipri.orgUnderstandingChildren’s Workwww.un.org/esa/populationUnited Nations Department ofPeacekeeping Operationswww.ucw-project.orgUnited Nationswww.un.org/en/peacekeepingUnited Nations Educational,Scientific, and Cultural Organization,Institute for Statisticswww.un.orgwww.uis.unesco.orgviii <strong>World</strong> <strong>Development</strong> <strong>Indicators</strong> <strong>2013</strong> Front ? User guide <strong>World</strong> view People Environment
United NationsEnvironment ProgrammeUpsalla ConflictData Programwww.unep.orgUnited Nations Industrial<strong>Development</strong> Organizationwww.pcr.uu.se/research/UCDP<strong>World</strong> Bankwww.unido.orgUnited NationsInternational Strategyfor Disaster Reductionhttp://data.worldbank.org<strong>World</strong> Health Organizationwww.unisdr.orgUnited Nations Office onDrugs and Crimewww.who.int<strong>World</strong> IntellectualProperty Organizationwww.unodc.orgUnited Nations Officeof the High Commissionerfor Refugeeswww.wipo.int<strong>World</strong> TourismOrganizationwww.unhcr.orgUnited NationsPopulation Fundwww.unwto.org<strong>World</strong> TradeOrganizationwww.unfpa.orgwww.wto.orgEconomy States and markets Global links Back<strong>World</strong> <strong>Development</strong> <strong>Indicators</strong> <strong>2013</strong> ix
PartnersPrivate and nongovernmental organizationsCenter for International EarthScience Information NetworkInternational Institute forStrategic Studieswww.ciesin.orgContainerisationInternationalwww.iiss.orgInternationalRoad Federationwww.ci-online.co.ukDHLwww.irfnet.orgNetcraftwww.dhl.comhttp://news.netcraft.comx <strong>World</strong> <strong>Development</strong> <strong>Indicators</strong> <strong>2013</strong> Front ? User guide <strong>World</strong> view People Environment
PwC<strong>World</strong> EconomicForumwww.pwc.comStandard &Poor’swww.weforum.org<strong>World</strong> ResourcesInstitutewww.standardandpoors.comwww.wri.org<strong>World</strong> ConservationMonitoring Centrewww.unep-wcmc.orgEconomy States and markets Global links Back<strong>World</strong> <strong>Development</strong> <strong>Indicators</strong> <strong>2013</strong> xi
User guide to tables<strong>World</strong> <strong>Development</strong> <strong>Indicators</strong> is the <strong>World</strong> Bank’s premiercompilation of cross-country comparable data on development.The database contains more than 1,200 time seriesindicators for 214 economies and more than 30 countrygroups, with data for many indicators going back morethan 50 years.The <strong>2013</strong> edition of <strong>World</strong> <strong>Development</strong> <strong>Indicators</strong> hasbeen reconfigured to offer a more condensed presentationof the principal indicators, arranged in their traditional sections,along with regional and topical highlights.3 EnvironmentDeforestation Nationally Internal Access to Access to Urban Particulate Carbon Energy use Electricityprotected renewable improved improved population matter dioxideproductionareas freshwater water sanitationconcentration emissionsresources b source facilitiesTerrestrial andurban-populationweightedmarine areasaveragePM10Per capita billionaverage % of total Per capita % of total % of total annual micrograms per million kilograms of kilowattannual % territorial area cubic meters population population % growth cubic meter metric tons oil equivalent hours2000–10 2011 2011 2010 2010 1990–2011 2010 2009 2010 20100.00 0.4 1,335 50 37 4.0 30 6.3 .. Afghanistan ..Albania –0.10 8.4 8,364 95 94 2.4 38 3.0 648 7.6Algeria 0.57 6.2 313 83 95 2.6 69 121.3 1,138 45.6American Samoa 0.19 16.7 .. .. .. 1.9 .. .. .. ..Andorra 0.00 6.1 3,663 100 100 0.9 18 0.5 .. ..Angola 0.21 12.1 7,544 51 58 4.1 58 26.7 716 5.3Antigua and Barbuda 0.20 1.0 580 .. .. 1.0 13 0.5 .. ..Argentina 0.81 5.3 6,771 .. .. 1.0 57 174.7 1,847 125.3Armenia 1.48 8.0 2,212 98 90 0.3 45 4.5 791 6.5Aruba 0.00 0.0 .. 100 .. 0.8 .. 2.3 .. ..Australia 0.37 12.5 22,039 100 100 1.3 13 400.2 5,653 241.5Austria –0.13 22.9 6,529 100 100 0.7 27 62.3 4,034 67.9<strong>World</strong> view People EnvironmentAzerbaijan 0.00 7.1 885 80 82 1.8 27 49.1 1,307 18.7Bahamas, The 0.00 1.0 58 .. 100 1.5 .. 2.6 .. ..Bahrain –3.55 0.7 3 .. .. 4.9 44 24.2 7,754 13.2Bangladesh 0.18 1.6 698 81 56 3.0 115 51.0 209 42.3Barbados 0.00 0.1 292 100 100 1.4 35 1.6 .. ..Belarus –0.43 7.2 3,927 100 93 0.4 6 60.3 2,922 34.9Economy States and markets Global linksBelgium –0.16 13.2 1,089 100 100 1.2 21 103.6 5,586 93.8Belize 0.67 20.6 44,868 98 90 3.0 12 0.4 .. ..Benin 1.04 23.3 1,132 75 13 4.2 48 4.9 413 0.2Bermuda 0.00 5.1 .. .. .. 0.7 .. 0.5 .. ..Bhutan –0.34 28.3 105,653 96 44 3.9 20 0.4 .. ..Bolivia 0.50 18.5 30,085 88 27 2.2 57 14.5 737 6.9Bosnia and Herzegovina 0.00 0.6 9,461 99 95 0.9 21 30.1 1,703 17.1Botswana 0.99 30.9 1,182 96 62 2.2 64 4.4 1,128 0.5TablesThe tables include all <strong>World</strong> Bank member countries (188),and all other economies with populations of more than30,000 (214 total). Countries and economies are listedalphabetically (except for Hong Kong SAR, China, andMacao SAR, China, which appear after China).The term country, used interchangeably with economy,does not imply political independence but refers to any territoryfor which authorities report separate social or economicstatistics. When available, aggregate measures for incomeand regional groups appear at the end of each table.Brazil 0.50 26.0 27,551 98 79 1.2 18 367.1 1,363 515.7Brunei Darussalam 0.44 29.6 20,939 .. .. 2.2 44 9.3 8,308 3.9Bulgaria –1.53 8.9 2,858 100 100 –1.7 40 42.8 2,370 46.0Burkina Faso 1.01 14.2 737 79 17 6.2 65 1.7 .. ..Burundi 1.40 4.8 1,173 72 46 4.9 24 0.2 .. ..Cambodia 1.34 23.4 8,431 64 31 2.1 42 4.6 355 1.0Cameroon 1.05 9.0 13,629 77 49 3.3 59 6.7 363 5.9Canada 0.00 6.2 82,647 100 100 1.2 15 513.9 7,380 607.8Cape Verde –0.36 0.2 599 88 61 2.1 .. 0.3 .. ..Cayman Islands 0.00 1.5 .. 96 96 0.9 .. 0.5 .. ..Central African Republic 0.13 17.7 31,425 67 34 2.6 35 0.2 .. ..Chad 0.66 9.4 1,301 51 13 3.0 83 0.4 .. ..Channel Islands .. 0.5 .. .. .. 0.8 .. .. .. ..Chile –0.25 13.3 51,188 96 96 1.1 46 66.7 1,807 60.4China –1.57 16.0 2,093 91 64 3.0 59 7,687.1 1,807 4,208.3Hong Kong SAR, China .. 41.8 .. .. .. 0.1 .. 37.0 1,951 38.3Macao SAR, China .. .. .. .. .. 2.2 .. 1.5 .. ..Colombia 0.17 20.5 45,006 92 77 1.7 19 71.2 696 56.8Comoros 9.34 .. 1,592 95 36 2.9 30 0.1 .. ..Congo, Dem. Rep. 0.20 10.0 13,283 45 24 4.3 35 2.7 360 7.9Congo, Rep. 0.07 9.7 53,626 71 18 3.0 57 1.9 363 0.646 <strong>World</strong> <strong>Development</strong> <strong>Indicators</strong> <strong>2013</strong> Front Users guide <strong>World</strong> view People EnvironmentAggregate measures for income groupsAggregate measures for income groups include the 214economies listed in the tables, plus Taiwan, China, wheneverdata are available. To maintain consistency in theaggregate measures over time and between tables, missingdata are imputed where possible.Aggregate measures for regionsThe aggregate measures for regions cover only low- andmiddle-income economies.The country composition of regions is based on the<strong>World</strong> Bank’s analytical regions and may differ from commongeographic usage. For regional classifications, seethe map on the inside back cover and the list on the backcover flap. For further discussion of aggregation methods,see Statistical methods.Data presentation conventions• A blank means not applicable or, for an aggregate, notanalytically meaningful.• A billion is 1,000 million.• A trillion is 1,000 billion.• Figures in orange italics refer to years or periods otherthan those specified or to growth rates calculated forless than the full period specified.• Data for years that are more than three years from therange shown are footnoted.• The cutoff date for data is February 1, <strong>2013</strong>.xii <strong>World</strong> <strong>Development</strong> <strong>Indicators</strong> <strong>2013</strong> Front ? User guide <strong>World</strong> view People Environment
Environment 3Deforestation Nationally Internal Access to Access to Urban Particulate Carbon Energy use Electricityprotected renewable improved improved population matter dioxideproductionareas freshwater water sanitationconcentration emissionsTerrestrial and resources b source facilitiesurban-populationweightedPM10Per capita billionmarine areasaverageaverage % of total Per capita % of total % of total annual micrograms per million kilograms of kilowattannual % territorial area cubic meters population population % growth cubic meter metric tons oil equivalent hours2000–10 2011 2011 2010 2010 1990–2011 2010 2009 2010 2010Costa Rica –0.93 17.6 23,780 97 95 2.2 27 8.3 998 9.6Côte d’Ivoire –0.15 21.8 3,813 80 24 3.5 30 6.6 485 6.0Croatia –0.19 9.5 8,562 99 99 0.2 22 21.5 1,932 14.0Cuba –1.66 5.3 3,387 94 91 –0.1 15 31.6 975 17.4Curacao .. .. .. .. .. .. .. .. .. ..Cyprus –0.09 4.5 699 100 100 1.4 27 8.2 2,215 5.4Czech Republic –0.08 15.1 1,253 100 98 –0.3 16 108.1 4,193 85.3Denmark –1.14 4.1 1,077 100 100 0.6 15 45.7 3,470 38.8Djibouti 0.00 0.0 331 88 50 2.0 28 0.5 .. ..Dominica 0.58 3.7 .. .. .. 0.1 20 0.1 .. ..Dominican Republic 0.00 24.1 2,088 86 83 2.1 14 20.3 840 15.9Ecuador 1.81 38.0 29,456 94 92 2.2 19 30.1 836 17.7Egypt, Arab Rep. –1.73 6.1 22 99 95 2.1 78 216.1 903 146.8El Salvador 1.45 1.4 2,850 88 87 1.3 28 6.3 677 6.0Equatorial Guinea 0.69 14.0 36,100 .. .. 3.2 6 4.8 .. ..Eritrea 0.28 3.8 517 61 14 5.2 61 0.5 142 0.3Estonia 0.12 22.6 9,486 98 95 0.1 9 16.0 4,155 13.0Ethiopia 1.08 18.4 1,440 44 21 3.7 47 7.9 400 5.0Faeroe Islands 0.00 .. .. .. .. 0.8 11 0.7 .. ..Fiji –0.34 0.2 32,876 98 83 1.7 20 0.8 .. ..Finland 0.14 8.5 19,858 100 100 0.6 15 53.6 6,787 80.7France –0.39 17.1 3,057 100 100 1.2 12 363.4 4,031 564.3French Polynesia –3.97 0.1 .. 100 98 1.1 .. 0.9 .. ..Gabon 0.00 14.6 106,892 87 33 2.3 7 1.6 1,418 1.8Gambia, The –0.41 1.3 1,689 89 68 3.7 60 0.4 .. ..Georgia 0.09 3.4 12,958 98 95 1.0 49 5.8 700 10.1Germany 0.00 42.3 1,308 100 100 0.2 16 734.6 4,003 622.1Ghana 2.08 14.0 1,214 86 14 3.6 22 7.4 382 8.4Greece –0.81 9.9 5,133 100 98 0.3 27 94.9 2,440 57.4Greenland 0.00 40.1 .. 100 100 0.2 .. 0.6 .. ..Grenada 0.00 0.1 .. .. 97 1.3 19 0.2 .. ..Guam 0.00 3.6 .. 100 99 1.3 .. .. .. ..Guatemala 1.40 29.5 7,400 92 78 3.4 51 15.2 713 8.8Guinea 0.54 6.4 22,110 74 18 3.8 55 1.2 .. ..Guinea-Bissau 0.48 26.9 10,342 64 20 3.6 48 0.3 .. ..Guyana 0.00 4.8 318,766 94 84 0.5 20 1.6 .. ..Haiti 0.76 0.1 1,285 69 17 3.8 35 2.3 229 0.6Honduras 2.06 13.9 12,371 87 77 3.1 34 7.7 601 6.7Hungary –0.62 5.1 602 100 100 0.4 15 48.7 2,567 37.4Classification of economiesFor operational and analytical purposes the <strong>World</strong> Bank’smain criterion for classifying economies is gross nationalincome (GNI) per capita (calculated using the <strong>World</strong> BankAtlas method). Because GNI per capita changes over time,the country composition of income groups may changefrom one edition of <strong>World</strong> <strong>Development</strong> <strong>Indicators</strong> to thenext. Once the classification is fixed for an edition, basedon GNI per capita in the most recent year for which dataare available (2011 in this edition), all historical data presentedare based on the same country grouping.Low-income economies are those with a GNI per capitaof $1,025 or less in 2011. Middle-income economies arethose with a GNI per capita of more than $1,025 but lessthan $12,475. Lower middle-income and upper middleincomeeconomies are separated at a GNI per capita of$4,036. High-income economies are those with a GNI percapita of $12,476 or more. The 17 participating membercountries of the euro area are presented as a subgroupunder high income economies.Iceland –4.99 13.2 532,892 100 100 0.4 18 2.0 16,882 17.1India –0.46 4.8 1,165 92 34 2.5 52 1,979.4 566 959.9Indonesia 0.51 6.4 8,332 82 54 2.5 60 451.8 867 169.8Iran, Islamic Rep. 0.00 6.9 1,718 96 100 1.3 56 602.1 2,817 233.0Iraq –0.09 0.1 1,068 79 73 2.8 88 109.0 1,180 50.2Ireland –1.53 1.2 10,707 100 99 2.7 13 41.6 3,218 28.4Isle of Man 0.00 .. .. .. .. 0.5 .. .. .. ..Israel –0.07 15.1 97 100 100 1.9 21 67.2 3,005 58.6Economy States and markets Global links Back<strong>World</strong> <strong>Development</strong> <strong>Indicators</strong> <strong>2013</strong> 47StatisticsAdditional information about the data is provided in Primarydata documentation, which summarizes national andinternational efforts to improve basic data collection andgives country-level information on primary sources, censusyears, fiscal years, statistical methods and concepts used,and other background information. Statistical methods providestechnical information on some of the general calculationsand formulas used throughout the book.Symbols.. means that data are not available or that aggregates0 or0.0cannot be calculated because of missing data in theyears shown.means zero or small enough that the number wouldround to zero at the displayed number of decimal places./ in dates, as in 2010/11, means that the period oftime, usually 12 months, straddles two calendar yearsand refers to a crop year, a survey year, or a fiscal year.$ means current U.S. dollars unless otherwise noted.< means less than.Country notes• Data for China do not include data for Hong Kong SAR,China; Macao SAR, China; or Taiwan, China.• Data for Indonesia include Timor-Leste through 1999.• Data for Mayotte, to which a reference appeared in previouseditions, are included in data for France.• Data for Serbia do not include data for Kosovo orMonte negro.• Data for Sudan include South Sudan unless otherwisenoted.Economy States and markets Global links Back<strong>World</strong> <strong>Development</strong> <strong>Indicators</strong> <strong>2013</strong> xiii
User guide to WDI online tablesStatistical tables that were previously available in the<strong>World</strong> <strong>Development</strong> <strong>Indicators</strong> print edition are now availableonline. Using an automated query process, these referencetables will be consistently updated based on therevisions to the <strong>World</strong> <strong>Development</strong> <strong>Indicators</strong> database.How to access WDI online tablesTo access the WDI online tables, visit http://wdi.worldbank.org/tables. To access a specific WDI online table directly,use the URL http://wdi.worldbank.org/table/ and thetable number (for example, http://wdi.worldbank.org/table/1.1 to view the first table in the <strong>World</strong> view section).Each section of this book also lists the indicatorsincluded by table and by code. To view a specific indicatoronline, use the URL http://data.worldbank.org/indicator/ and the indicator code (for example, http://data.worldbank.org/indicator/SP.POP.TOTL to view a page fortotal population).xiv <strong>World</strong> <strong>Development</strong> <strong>Indicators</strong> <strong>2013</strong> Front ? User guide <strong>World</strong> view People Environment
Breadcrumbs to showwhere you’ve beenClick on an indicatorto view metadataClick on a countryto view metadataHow to use DataBankDataBank (http://databank.worldbank.org) is an onlineweb resource that provides simple and quick access tocollections of time series data. It has advanced functionsfor selecting and displaying data, performing customizedqueries, downloading data, and creating charts and maps.Users can create dynamic custom reports based on theirselection of countries, indicators, and years. All thesereports can be easily edited, shared, and embedded aswidgets on websites or blogs. For more information, seehttp://databank.worldbank.org/help.ActionsClick to edit and revise the table inDataBankClick to print the table and correspondingindicator metadataClick to export the table to ExcelClick to export the table and correspondingindicator metadata to PDFClick to access the WDI Online Tables HelpfileClick the checkbox to highlight cell levelmetadata and values from years otherthan those specified; click the checkboxagain to reset to the default displayEconomy States and markets Global links Back<strong>World</strong> <strong>Development</strong> <strong>Indicators</strong> <strong>2013</strong> xv
User guide to DataFinderDataFinder is a free mobile app that accesses the fullset of data from the <strong>World</strong> <strong>Development</strong> <strong>Indicators</strong> database.Data can be displayed and saved in a table, chart,or map and shared via email, Facebook, and Twitter.DataFinder works on mobile devices (smartphone ortablet computer) in both offline (no Internet connection)and online (Wi-Fi or 3G/4G connection to the Internet)modes.• Select a topic to display all related indicators.• Compare data for multiple countries.• Select predefined queries.• Create a new query that can be saved and edited later.• View reports in table, chart, and map formats.• Send the data as a CSV file attachment to an email.• Share comments and screenshots via Facebook,Twitter, or email.xvi <strong>World</strong> <strong>Development</strong> <strong>Indicators</strong> <strong>2013</strong> Front ? User guide <strong>World</strong> view People Environment
Table view provides time series data tables of key developmentindicators by country or topic. A compare optionshows the most recent year’s data for the selected countryand another country.Chart view illustrates data trends and cross-country comparisonsas line or bar charts.Map view colors selected indicators on world and regionalmaps. A motion option animates the data changes fromyear to year.Economy States and markets Global links Back<strong>World</strong> <strong>Development</strong> <strong>Indicators</strong> <strong>2013</strong> xvii
WORLDVIEW?xviii <strong>World</strong> <strong>Development</strong> <strong>Indicators</strong> <strong>2013</strong> Front User guide <strong>World</strong> view People Environment
The Millennium Declaration adopted by all themembers of the United Nations General Assemblyin 2000 represents a commitment to a moreeffective, results-oriented development partnershipin the 21st century. Progress documentedhere and in the annual reports of the UnitedNations Secretary- General has been encouraging:poverty rates have fallen, more children—especially girls—are enrolled in and completingschool, and they are—on average—living longerand healthier lives. Fewer mothers die in childbirth, and more women have access to reproductivehealth services.The indicators used to monitor the Millennium<strong>Development</strong> Goals have traced the path ofthe HIV epidemic, the resurgence and retreat oftuberculosis, and the step-by-step efforts to “rollback malaria.” More people now have accessto reliable water supplies and basic sanitationfacilities. But forests continue to disappear andwith them the habitat for many species of plantsand animals, and greenhouse gases continue toaccumulate in the atmosphere.From the start monitoring the Millennium<strong>Development</strong> Goals posed three challenges:selecting appropriate targets and indicators,constructing an international database for globalmonitoring, and significantly improving the quality,frequency, and availability of the relevant statistics.When they were adopted, the target yearof 2015 seemed comfortably far away, and thebaseline year of 1990 for measuring progressseemed a reasonable starting point with wellestablisheddata. As we near the end of that25-year span, we have a better appreciation ofhow great those challenges were.Already there is discussion of the post-2015 development agenda and the monitoringframework needed to record commitments andmeasure progress. The Millennium <strong>Development</strong>Goals have contributed to the development ofa statistical infrastructure that is increasinglycapable of producing reliable statistics on varioustopics. The post-2015 agenda and a welldesignedmonitoring framework will build on thatinfrastructure.The international database for monitoringthe Millennium <strong>Development</strong> Goals is a valuableresource for analyzing many developmentissues. The effort of building and maintainingsuch a database should not be underestimated,and it will take several years to implement anew framework of goals and targets. To serveas an analytical resource, the database will needto include additional indicators, beyond thosedirectly associated with the targets and the coredata for conducting these indicators. New technologiesand methods for reporting data shouldimprove the quality and timeliness of the resultingdatabase. The quality of data will ultimatelydepend on the capacity of national statisticalsystems, where most data originate.When the Millennium <strong>Development</strong> Goalswere adopted, few developing countries hadthe capacity or resources to produce statisticsof the requisite quality or frequency. Despitemuch progress, the statistical capacity-buildingprograms initiated over the last decade shouldcontinue, and other statistical domains needattention. Planning for post-2015 goals mustinclude concomitant plans for investments instatistics—by governments and developmentpartners alike.The effort to achieve the Millennium <strong>Development</strong>Goals has been enormous. The next set ofgoals will require an even larger effort. Withoutgood statistics, we will never know if we havesucceeded.1Economy States and markets Global links Back<strong>World</strong> <strong>Development</strong> <strong>Indicators</strong> <strong>2013</strong> 1
Goal 1 Eradicate extreme povertyPoverty ratescontinue to fallPeople living on less than 2005 PPP $1.25 a day (%)755025Latin America& Caribbean01990Share of countries making progress toward reducing poverty (%)10050Fewer people are livingin extreme povertyPeople living on less than 2005 PPP $1.25 a day (billions)2.01.51.00.5050100Middle East & North AfricaEast AsiaSouth Asia1995Sub-Saharan Africa0.01990 1995Europe& CentralAsiaEurope & Central AsiaMiddle East & North Africa2000Source: <strong>World</strong> Bank PovcalNet.Source: <strong>World</strong> Bank PovcalNet.Europe &Central AsiaProgress in reaching thepoverty target, 1990–2010Reached target On track Off track Seriously off trackLatinAmerica &CaribbeanSource: <strong>World</strong> Bank staff calculations.20002005Middle East& NorthAfricaLatin America& Caribbean2005Sub-Saharan AfricaSouth Asia2010estimateSouthAsia2010estimateForecast2010–15Sub-SaharanAfricaForecast2010–151a2015forecast1b1c2015forecastThe world will not have eradicated extreme povertyin 2015, but the Millennium <strong>Development</strong>Goal target of halving world poverty will havebeen met. The proportion of people living on lessthan $1.25 a day fell from 43.1 percent in 1990to 22.7 percent in 2008, reaching new lows inall six developing country regions. While thefood, fuel, and financial crises over the past fiveyears worsened the situation of vulnerable populationsand slowed poverty reduction in somecountries, global poverty rates continued to fallin most regions. Preliminary estimates for 2010confirm that the extreme poverty rate fell further,to 20.6 percent, reaching the global targetfive years early. Except in South Asia and Sub-Saharan Africa the target has also been met atthe regional level (figure 1a).Further progress is possible and likelybefore the 2015 target date of the Millennium<strong>Development</strong> Goals. Developing economiesare expected to maintain GDP growth of6.6–6.8 percent over the next three years, withgrowth of GDP per capita around 5.5 percent.Growth will be fastest in East Asia and Pacificand South Asia, which still contain more thanhalf the world’s poorest people. Growth willbe slower in Sub- Saharan Africa, the poorestregion in the world, but faster than in the precedingyears, quickening the pace of povertyreduction. According to these forecasts, theproportion of people living in extreme povertywill fall to 16 percent by 2015. Based on currenttrends, 59 of 112 economies with adequatedata are likely to achieve the first Millennium<strong>Development</strong> Goal (figure 1b). The numberof people living in extreme poverty will continueto fall to less than a billion in 2015 (figure 1c).Of these, 40 percent will live in South Asia and40 percent in Sub- Saharan Africa.How fast poverty reduction will proceeddepends not just on the growth of GDP butalso on its distribution. Income distribution hasimproved in some countries, such as Brazil, while2 <strong>World</strong> <strong>Development</strong> <strong>Indicators</strong> <strong>2013</strong> Front ? User guide <strong>World</strong> view People Environment
worsening in others, such as China. To speedprogress toward eliminating extreme poverty,development strategies should attempt toincrease not just the mean rate of growth butalso the share of income going to the poorestpart of the population. Sub- Saharan Africa,where average income is low and average incomeof those below the poverty line is even lower, willface great difficulties in bringing the poorest peopleto an adequate standard of living (figure 1d).Latin America and the Caribbean, where averageincome is higher, must overcome extremely inequitableincome distributions.Two Millennium <strong>Development</strong> Goal indicatorsaddress hunger and malnutrition. Child malnutrition,measured by comparing a child’s weightwith that of other children of similar age, reflectsa shortfall in food energy, poor feeding practicesby mothers, and lack of essential nutrientsin the diet. Malnutrition in children oftenbegins at birth, when poorly nourished mothersgive birth to underweight babies. Malnourishedchildren develop more slowly, enter school later,and perform less well. Malnutrition rates havedropped substantially since 1990, from 28 percentof children under age 5 in developing countriesto 17 percent in 2011. Every developingregion except Sub- Saharan Africa is on trackto cut child malnutrition rates in half by 2015(figure 1e). However, collecting data on malnutritionthrough surveys with direct measurement ofchildren’s weight and height is costly, and manycountries lack the information to calculate timetrends.Undernourishment, a shortage of food energyto sustain normal daily activities, is affected bychanges in the average amount of food availableand its distribution. After steady declines in mostregions from 1991 to 2005, further improvementsin undernourishment have stalled, leaving13 percent of the world’s population, almost900 million people, without adequate daily foodintake (figure 1f).Poorerthan poorAverage daily income of people living on less than 2005 PPP$1.25 a day, 2008 (2005 PPP $)1.251.000.750.500.250.00604020Latin America & Caribbean01990 1995And fewer people lackingsufficient food energyUndernourishment prevalence (% of population)40302010Latin America& Caribbean01991East Asia& PacificMalnutrition prevalence, weight for age (% of children under age 5)South AsiaSub-Saharan AfricaEast Asia & PacificEurope& CentralAsiaSource: <strong>World</strong> Bank PovcalNet.Fewer malnourishedchildrenMiddle East & North AfricaMiddle East & North Africa1996LatinAmerica &Caribbean20002001Middle East& NorthAfricaSource: <strong>World</strong> <strong>Development</strong> <strong>Indicators</strong> database.2005SouthAsiaEurope & Central AsiaSouth AsiaEast Asia & Pacific2006Sub-Saharan Africa1fEurope & Central AsiaSource: Food and Agriculture Organization and <strong>World</strong> <strong>Development</strong><strong>Indicators</strong> database.1dSub-SaharanAfrica1e20112011Economy States and markets Global links Back<strong>World</strong> <strong>Development</strong> <strong>Indicators</strong> <strong>2013</strong> 3
Goal 2 Achieve universal primary educationGrowth in completeprimary education has slowedPrimary school completion rate (% of relevant age group)125East Asia & PacificEurope & Central Asia10075502501990Progress toward universal2bprimary education, 1990–2010Share of countries making progress toward universal primaryeducation (%)10050050100More girls than boys remainout of school in most regionsChildren not attending primary school, 2010(% of relevant age group)302520151050Reached target On track Off track Seriously off trackInsufficient dataEast Asia& PacificEast Asia& Pacific1995Europe& CentralAsiaEurope& CentralAsia2000LatinAmerica &CaribbeanSource: <strong>World</strong> Bank staff calculations.LatinAmerica &Caribbean2005Middle East& NorthAfricaMiddle East& NorthAfricaLatin America& CaribbeanSouth AsiaSub-Saharan Africa2010SouthAsiaSouthAsia2aMiddle East &North AfricaSub-SaharanAfrica2cGirlsBoysSub-SaharanAfricaSource: United Nations Educational, Scientific and Cultural OrganizationInstitute of Statistics and <strong>World</strong> <strong>Development</strong> <strong>Indicators</strong> database.2015Note: Dotted lines indicate progress needed to reach target.Source: United Nations Educational, Scientific and Cultural OrganizationInstitute of Statistics and <strong>World</strong> <strong>Development</strong> <strong>Indicators</strong> database.The commitment to provide primary education toevery child is the oldest of the Millennium <strong>Development</strong>Goals, having been set at the first Educationfor All conference in Jomtien, Thailand, morethan 20 years ago.Progress among the poorest countries hasaccelerated since 2000, particularly in SouthAsia and Sub- Saharan Africa, but full enrollmentremains elusive. Many children start school butdrop out before completion, discouraged by cost,distance, physical danger, and failure to progress.Even as countries approach the target, the educationdemands of modern economies expand, andprimary education will increasingly be of valueonly as a stepping stone toward secondary andhigher education.In most developing country regions schoolenrollment picked up after the Millennium<strong>Development</strong> Goals were promulgated in 2000,when the completion rate was 80 percent. Sub-Saharan Africa and South Asia, which startedout farthest behind, made substantial progress.By 2009 nearly 90 percent of children indeveloping countries completed primary school,but completion rates have stalled since, withno appreciable gains in any region (figure 2a).Three regions have attained or are close toattaining complete primary education: East Asiaand Pacific, Europe and Central Asia, and LatinAmerica and the Caribbean (figure 2b). Completionrates in the Middle East and North Africahave stayed at 90 percent since 2008. SouthAsia has reached 88 percent, but progresshas been slow. And Sub- Saharan Africa lagsbehind at 70 percent. Even if the schools inthese regions were to now enroll every eligiblechild in the first grade, they would not be ableto achieve a full course of primary education by2015. But it would help.Many children enroll in primary school butattend intermittently or drop out entirely. Thisis particularly true for girls—almost all school4 <strong>World</strong> <strong>Development</strong> <strong>Indicators</strong> <strong>2013</strong> Front ? User guide <strong>World</strong> view People Environment
systems with low enrollment rates show underenrollmentof girls in primary school, sincetheir work is needed at home (figure 2c). Otherobstacles discourage parents from sending theirchildren to school, including the need for boysand girls during planting and harvest, lack ofsuitable school facilities, absence of teachers,and school fees. The problem is worst in SouthAsia and Sub- Saharan Africa, where more than46 million children of primary school age are notin school.Not all children have the same opportunitiesto enroll in school or remain in school. Acrossthe world, children in rural areas are less likelyto enter school, and when they do, they are likelyto drop out sooner. In Ethiopia nearly all urbanchildren complete first grade, but fewer than80 percent of rural children do (figure 2d). InSenegal, where slightly more than 80 percent ofurban children complete first grade, barely halfof rural children begin the first grade and only40 percent remain after nine years. Cambodiafollows a similar pattern.Parents’ education makes a big differencein how far children go in school. In Nepal, forexample, less than 90 percent of children whoseparents lack any education complete first gradeand barely 70 percent remain through the ninth(figure 2e). But 95 percent of children fromhouseholds with some higher education staythrough nine grades, and many of those go ontocomplete secondary school and enter tertiaryeducation.Income inequality and educational quality areclosely linked. Take Senegal (figure 2f). Childrenfrom wealthier households (as measured by ahousehold’s ownership of certain assets) aremore likely to enroll and stay in school than childrenfrom poorer households. Thus children frompoor households are least likely to acquire theone asset—human capital—that could most helpthem to escape poverty.Rural studentsat a disadvantageShare of people ages 10–19 completing each grade of schooling,by location, 2010–11 (%)100Urban Cambodia7550250Grade 1 Grade 2 Grade 3 Grade 4 Grade 5 Grade 6 Grade 7 Grade 8 Grade 9Parents’ education makesa difference in NepalShare of people ages 10–19 completing each grade of schooling,by parents’ education level, 2011 (%)100Some higher7550250Grade 1 Grade 2 Grade 3 Grade 4 Grade 5 Grade 6 Grade 7 Grade 8 Grade 9Poverty is a barrier toeducation in SenegalShare of people ages 10–19 completing each grade of schooling,by wealth quintile, 2010 (%)100755025Urban SenegalRural EthiopiaRural SenegalIncomplete primaryWealthiest quintileFourth quintileThird quintilePrimaryRural CambodiaIncomplete secondaryPoorest quintileUrban EthiopiaSource: Demographic and Health Surveys and <strong>World</strong> Bank EdStatsdatabase.No educationSource: Demographic and Health Surveys and <strong>World</strong> Bank EdStatsdatabase.Second quintile0Grade 1 Grade 2 Grade 3 Grade 4 Grade 5 Grade 6 Grade 7 Grade 8 Grade 9Source: Demographic and Health Surveys and <strong>World</strong> Bank EdStatsdatabase.2d2e2fEconomy States and markets Global links Back<strong>World</strong> <strong>Development</strong> <strong>Indicators</strong> <strong>2013</strong> 5
Goal 3 Promote gender equality and empower womenA ragged kind of parityin school enrollmentsRatio of girls’ to boys’ gross enrollment, 2011 (%)Share of countries making progress toward gender equality inprimary and secondary education (%)10050050100East Asia& PacificEurope &Central AsiaLatin America& CaribbeanMiddle East &North AfricaSouthAsiaSub-SaharanAfrica0 25 50 75 100 125Source: United Nations Educational, Scientific and Cultural OrganizationInstitute of Statistics and <strong>World</strong> <strong>Development</strong> <strong>Indicators</strong> database.Progress toward gender equalityin education, 1990–2010Reached target On track Off track Seriously off trackInsufficient dataEast Asia& PacificPrimarySecondaryTertiaryEurope& CentralAsiaLatinAmerica &CaribbeanSource: <strong>World</strong> Bank staff calculations.Middle East& NorthAfricaSouthAsia3a3bSub-SaharanAfricaWomen make important contributions to economicand social development. Expanding opportunitiesfor them in the public and private sectorsis a core development strategy, and educationis the starting point. By enrolling and staying inschool, girls gains skills needed to enter the labormarket, care for families, and make decisions forthemselves. Achieving gender equality in educationis an important demonstration that youngwomen are full, contributing members of society.Girls have made substantial gains in schoolenrollment. In 1990 girls’ primary school enrollmentrate in developing countries was only86 percent of boys’. By 2011 it was 97 percent(figure 3a). Similar improvements have beenmade in secondary schooling, where girls’ enrollmentshave risen from 78 percent of boys’ to96 percent over the same period. But the averagesmask large differences across countries. Atthe end of 2011, 31 upper middle-income countrieshad reached or exceeded equal enrollmentof girls in primary and secondary education, ashad 23 lower middle-income countries but only9 low-income countries. South Asia and Sub-Saharan Africa are lagging behind (figure 3b).Patterns of school attendance at the nationallevel mirror those at the regional level: poor householdsare less likely than wealthy households tokeep their children in school, and girls from wealthierhouseholds are more likely to enroll in schooland stay longer. Ethiopia is just one example of theprevailing pattern documented by household surveysfrom many developing countries (figure 3c).More women are participating in public life atthe highest levels. The proportion of parliamentaryseats held by women continues to increase.In Latin America and the Caribbean women nowhold 25 percent of all parliamentary seats (figure3d). The most impressive gains have been madein the Middle East and North Africa, where the proportionof seats held by women more than tripledbetween 1990 and 2012. Algeria leads the waywith 32 percent. In Nepal a third of parliamentary6 <strong>World</strong> <strong>Development</strong> <strong>Indicators</strong> <strong>2013</strong> Front ? User guide <strong>World</strong> view People Environment
seats were held by women in 2012. Rwanda continuesto lead the world. Since 2008, 56 percentof parliamentary seats have been held by women.Women work long hours and make importantcontributions to their families’ welfare, but manyin the informal sector are unpaid for their labor.The largest proportion of women working in theformal sector is in Europe and Central Asia,where the median proportion of women in wageemployment outside the agricultural sector was46 percent (figure 3e). Latin America and theCaribbean is not far behind, with 42 percent ofwomen in nonagricultural employment. Women’sshare in paid employment in the nonagriculturalsector has risen marginally but remains lessthan 20 percent in most countries in the MiddleEast and North Africa and South Asia and lessthan 35 percent in Sub- Saharan Africa. In theseregions full economic empowerment of womenremains a distant goal.Lack of data hampers the ability to understandwomen’s roles in the economy. The Evidence andData for Gender Equality (EDGE) Initiative is anew partnership, jointly managed by UN Womenand the United Nations Statistics Division, in collaborationwith member states, the <strong>World</strong> Bank,the Organisation for Economic Co-operation and<strong>Development</strong>, and others, that seeks to acceleratethe work of gathering indicators on women’seducation, employment, entrepreneurship, andasset ownership. During its initial phase EDGEwill lay the ground work for a database of basiceducation and employment indicators, developingstandards and guidelines for entrepreneurshipand assets indicators, and pilot data in severalcountries. Relevant indicators could includethe percentage distribution of the employedpopulation, by sector and sex; the proportion ofemployed who are employer, by sex; the length ofmaternity leave; the percentage of firms ownedby women; the proportion of the population withaccess to credit, by sex; and the proportion of thepopulation who own land, by sex.Girls are disadvantaged atevery income level in EthiopiaShare of people ages 10–19 completing each grade of schooling,by sex and wealth quintile, 2011 (%)100Wealthiest quintile, boysWealthiest quintile,girlsThird quintile, boys75Third quintile, girls50Poorest quintile, boysPoorest quintile, girls250Grade 1 Grade 2 Grade 3 Grade 4 Grade 5 Grade 6 Grade 7 Grade 8 Grade 9Source: Demographic and Health Surveys and <strong>World</strong> Bank EdStatsdatabase.More womenin parliamentsShare of seats held by women in national parliaments (%)252015105Middle East &North Africa01990 1995Women still lack opportunitiesin the labor marketShare of women employed in the nonagricultural sector,median value, most recent year available, 2004–10 (% of totalnonagricultural employment)50403020100East Asia & PacificLatin America& CaribbeanSub-Saharan AfricaSouth AsiaEast Asia& Pacific aEurope& CentralAsia2000LatinAmerica &CaribbeanMiddle East& NorthAfrica2005SouthAsiaEurope &Central AsiaSource: Inter-Parliamentary Union and <strong>World</strong> <strong>Development</strong> <strong>Indicators</strong>database.a. Data cover less than two-thirds of regional population.Source: International Labour Organization and <strong>World</strong> <strong>Development</strong><strong>Indicators</strong> database.3c3d20123eSub-SaharanAfrica aEconomy States and markets Global links Back<strong>World</strong> <strong>Development</strong> <strong>Indicators</strong> <strong>2013</strong> 7
Goal 4 Reduce child mortalityUnder-five mortality ratescontinue to fallUnder-five mortality rate (per 1,000 live births)20015010050Progress toward reducingchild mortality, 1990–2010Share of countries making progress toward reducing child mortality(%)10050050100Reached target On track Off track Seriously off trackInsufficient dataEast Asia& PacificEurope& CentralAsiaLatinAmerica &CaribbeanSource: <strong>World</strong> Bank staff calculations.43210Europe &Central AsiaEast Asia& PacificEast Asia& PacificLatin America& Caribbean01990 1995 2000 20052011Source: Inter-agency Group for Child Mortality Estimation and <strong>World</strong><strong>Development</strong> <strong>Indicators</strong> database.Europe& CentralAsiaLatinAmerica &CaribbeanMiddle East& NorthAfricaDeaths of children under age 5, 2011 (millions)Children (ages 1–4)Infants (ages 1–11 months)Neonatals (ages 0–1 month)Middle East& NorthAfricaSouthAsiaAs mortality rates fall, a larger proportionof deaths occur in the first monthSub-Saharan AfricaSouthAsiaSouth AsiaMiddle East &North Africa4bSub-SaharanAfrica4cSub-SaharanAfricaSource: Inter-agency Group for Child Mortality Estimation and <strong>World</strong><strong>Development</strong> <strong>Indicators</strong> database.4aIn 1990, 12 million children died before their fifthbirthday. By 1999 fewer than 10 million did. Andin 2012 7 million did. In developing countries theunder-five mortality rate fell from an average of 95per 1,000 live births in 1990 to 56 in 2011, butrates in Sub- Saharan Africa and South Asia remainmuch higher (figure 4a). Currently, 41 countriesare poised to reach the Millennium <strong>Development</strong>Goal target of a two-thirds reduction in under-fivemortality rates by 2015 (figure 4b). Faster improvementsover the last decade suggest that manycountries are accelerating progress and another25 could reach the target as soon as 2020. Lookingpast 2015, still faster progress is possible ifhigh mortality countries give priority to addressingthe causes of child mortality. Concomitant reductionsin fertility rates, particularly among adolescents,will also help.Most children die from causes that are readilypreventable or curable with existing interventions,such as pneumonia (18 percent), diarrhea(11 percent), and malaria (7 percent). Almost 70percent of deaths of children under age 5 occurin the first year of life, and 60 percent of thosein the first month (figure 4c). Preterm birth complicationsaccount for 14 percent of deaths, andcomplications during birth another 9 percent (UNInter-Agency Group for Child Mortality Estimation2012). Therefore reducing child mortality requiresaddressing the causes of neonatal and infantdeaths: inadequate care at birth and afterward,malnutrition, poor sanitation, and exposure toacute and chronic disease. Lower infant and childmortality rates are, in turn, the largest contributorsto higher life expectancy in most countries.Childhood vaccinations are a proven, costeffectiveway of reducing childhood illness anddeath. But despite years of vaccination campaigns,many children in low- and lower middle-incomeeconomies remain unprotected. To be successful,vaccination campaigns must reach all childrenand be sustained over time. Thus it is worrisomethat measles vaccination rates in the two highest8 <strong>World</strong> <strong>Development</strong> <strong>Indicators</strong> <strong>2013</strong> Front ? User guide <strong>World</strong> view People Environment
mortality regions, South Asia and Sub- SaharanAfrica, have stagnated in the last three years, atless than 80 percent coverage (figure 4d).Twenty countries in the developing worldaccounted for 4.5 million deaths among childrenunder age 5 in 2011, or 65 percent of all suchdeaths worldwide (figure 4e). These countries aremostly large, often with high birth rates, but manyhave substantially reduced mortality rates overthe past two decades. Of the 20, 11 have reachedor are likely to achieve a two-thirds reduction intheir under-five mortality rate by 2015: Bangladesh,Brazil, China, the Arab Republic of Egypt,Ethiopia, Indonesia, Madagascar, Malawi, Mexico,Niger, and Turkey. Had the mortality rates of 1990prevailed in 2011, these 11 countries would haveexperienced 2 million more deaths. The remainingnine, where progress has been slower, have neverthelessaverted 3 million deaths. If India wereon track to reach the target, another 440,000deaths would have been averted.The data used to monitor child mortality are producedby the Inter-agency Group for Child MortalityEstimation (IGME), which evaluates data fromexisting sources and then fits a statistical modelto data points that are judged to be reliable. Themodel produces a trend line for under-five mortalityrates in each country. Infant mortality and neonatalmortality rates are derived from under-five mortalityestimates. The data come from householdsurveys and, where available, vital registration systems.But surveys are slow and costly. While theyremain important tools for investigating certaincomplex, micro-level problems, vital registrationsystems are usually better sources of timely statistics.Recent IGME estimates of under-five mortalityinclude new data from vital registration systemsfor about 70 countries. But many countries lackcomplete reporting of vital events, and even thosethat do often misreport cause of death. Vital registrationsupplemented by surveys and censusesoffers the best approach for improving knowledgeof morbidity and mortality in all age groups.Measles immunizationrates are stagnatingChildren ages 12–23 months immunized against measles (%)10075502501990East Asia& PacificLatin America& CaribbeanFive million deathsaverted in 20 countriesDeaths of children under age 5, 2011 (millions)At 2011 mortality rate Averted based on 1990 mortality rateIndiaNigeriaChinaPakistanEthiopiaBangladeshIndonesiaTanzaniaAfghanistanUgandaNigerMozambiqueAngolaBrazilEgypt, Arab Rep.MalawiPhilippinesMadagascarMexicoTurkeyEurope & Central Asia1995South Asia20004e0 1 2 3 4Source: <strong>World</strong> Bank staff calculations.Middle East & North Africa2005Sub-Saharan AfricaSource: <strong>World</strong> Health Organization, United Nations Children’s Fund, and<strong>World</strong> <strong>Development</strong> <strong>Indicators</strong> database.4d2011Economy States and markets Global links Back<strong>World</strong> <strong>Development</strong> <strong>Indicators</strong> <strong>2013</strong> 9
Goal 5 Improve maternal healthMaternal deaths are more likely in5aSouth Asia and Sub- Saharan AfricaMaternal mortality ratio, modeled estimate (per 100,000 live births)1,000750500250Progress toward reducing5bmaternal mortality, 1990–2010Share of countries making progress toward reducing maternalmortality (%)10050050100Reducing therisk to mothersLifetime risk of maternal death (%)6420Sub-Saharan AfricaSouth AsiaLatin America& CaribbeanEurope & Central Asia01990 1995Reached target On track Off track Seriously off trackInsufficient dataEast Asia& PacificEast Asia& PacificEurope& CentralAsiaEurope& CentralAsiaMiddle East & North AfricaLatinAmerica &CaribbeanSource: <strong>World</strong> Bank staff calculations.LatinAmerica &Caribbean2000Middle East& NorthAfricaMiddle East& NorthAfricaEast Asia & Pacific2005Source: Maternal Mortality Estimation Inter-Agency Group and <strong>World</strong><strong>Development</strong> <strong>Indicators</strong> database.SouthAsiaSouthAsiaSub-SaharanAfrica5c19902010Sub-SaharanAfricaSource: Maternal Mortality Estimation Inter-Agency Group and <strong>World</strong><strong>Development</strong> <strong>Indicators</strong> database.2010An estimated 287,000 maternal deaths occurredworldwide in 2010, all but 1,700 of them indeveloping countries. More than half of maternaldeaths occur in Sub- Saharan Africa and aquarter in South Asia. And while the number ofmaternal deaths remains high, South Asia hasmade great progress in reducing them, reachinga maternal mortality ratio of 220 per 100,000live births in 2010, down from 620 in 1990, adrop of 65 percent. The Middle East and NorthAfrica and East Asia and Pacific have alsoreduced their maternal morality ratios more than60 percent (figure 5a).These are impressive achievements, but progressin reducing maternal mortality has beenslow, far slower than targeted by the Millennium<strong>Development</strong> Goals, which call for reducing thematernal mortality ratio by 75 percent between1990 and 2015. But few countries and no developingregion on average will achieve this target.Based on progress through 2010, 8 countrieshave achieved a 75 percent reduction, and 10more are on track to reach the 2015 target (figure5b). This is an improvement over the 2008assessment, suggesting that progress is accelerating.Because of the reductions in Cambodia,China, Lao People’s Democratic Republic, andVietnam, 74 percent of people in East Asia andPacific live in a country that has reached the target(Vietnam) or is on track to do so by 2015.On average a third of people in low- and middleincomecountries live in countries that havereached the target or are on track to do so.The maternal mortality ratio gives the risk of amaternal death at each birth, a risk compoundedwith each pregnancy. And because women inpoor countries have more children under riskierconditions, their lifetime risk of maternal deathmay be 100 times greater than for women in highincomecountries. Improved health care and lowerfertility rates have reduced the lifetime risk in allregions, but women ages 15–49 in Sub- SaharanAfrica still face a 2.5 percent chance of dying10 <strong>World</strong> <strong>Development</strong> <strong>Indicators</strong> <strong>2013</strong> Front ? User guide <strong>World</strong> view People Environment
in childbirth, down from more than 5 percent in1990 (figure 5c). In Chad and Somalia, both fragilestates, lifetime risk is still more than 6 percent,meaning more than 1 woman in 16 will diein childbirth.Reducing maternal mortality requires a comprehensiveapproach to women’s reproductivehealth, starting with family planning and accessto contraception. In countries with data half ofwomen who are married or in union use somemethod of birth control. Household surveys ofwomen show that some 200 million womenwant to delay or cease childbearing, and a substantialproportion say that their last birth wasunwanted or mistimed (United Nations 2012).Figure 5d shows the share of women of childbearingage who say they need but are not usingcontraception. There are large differences withineach region. More surveys have been carried outin Sub- Saharan Africa than in any other region,and many show a large unmet need for familyplanning.Women who give birth at an early age are likelyto bear more children and are at greater risk ofdeath or serious complications from pregnancy.The adolescent birth rate is highest in Sub-Saharan Africa and is declining slowly. A rapiddecrease in South Asia has been led by Maldives,Afghanistan, and Pakistan (figure 5e).Many health problems among pregnant womenare preventable or treatable through visits withtrained health workers before childbirth. Skilledattendants at delivery and access to hospitaltreatments are essential for dealing with lifethreateningemergencies such as severe bleedingand hypertensive disorders. In South Asia andSub- Saharan Africa fewer than half of births areattended by doctors, nurses, or trained midwives(figure 5f). Having skilled health workers presentfor deliveries is key to reducing maternal mortality.In many places women have only untrainedcaregivers or family members to attend them duringchildbirth.A wide rangeof needsUnmet need for contraception, most recent year available,2006–10 (% of women married or in union ages 15–49)50Regional median403020100150100Middle East & North Africa50Europe &Central AsiaEast Asia & Pacific01997 1999 2001Every motherneeds careBirths attended by skilled health staff, average of most recent yearavailable for 2007–11 (% of total)1007550250East Asia& Pacific(7 countries)Adolescent fertility rate (births per 1,000 women ages 15–19)Sub-Saharan AfricaSouth AsiaLatin America & CaribbeanEast Asia& PacificEurope& CentralAsia(10 countries)Fewer young womengiving birthEurope& CentralAsiaLatinAmerica &Caribbean(9 countries)2003LatinAmerica &Caribbean aMiddle East& NorthAfrica(6 countries)2005Middle East& NorthAfrica aSouthAsia(5 countries)2007SouthAsia2009Source: United Nations Population Division and <strong>World</strong> <strong>Development</strong><strong>Indicators</strong> database.a. Data are for 1998–2002.Source: United Nations Children’s Fund and <strong>World</strong> <strong>Development</strong><strong>Indicators</strong> database.5dSub-SaharanAfrica(31 countries)Source: Demographic and Household Surveys, Multiple Indicator ClusterSurveys, and <strong>World</strong> <strong>Development</strong> <strong>Indicators</strong> database.5e20115fSub-SaharanAfricaEconomy States and markets Global links Back<strong>World</strong> <strong>Development</strong> <strong>Indicators</strong> <strong>2013</strong> 11
Goal 6 Combat HIV/AIDS, malaria, and other diseasesHIV prevalence in Sub- SaharanAfrica continues to fallHIV prevalence (% of population ages 15–49)65432101990Progress toward halting and reversingthe HIV epidemic, 1990–2010Share of countries making progress against HIV/AIDS (%)10050050100<strong>Knowledge</strong> tocontrol HIV/AIDSPeople with comprehensive and correct knowledge about HIV,most recent year available (% of adults ages 15–49)7550250East Asia& PacificWomenMenSwazilandLesothoLatin America & CaribbeanHigh income1995Halted and reversed Halted or reversed Stable low prevalenceNot improving Insufficient dataEurope& CentralAsiaZimbabweOther developing regionsLatinAmerica &CaribbeanSource: <strong>World</strong> Bank staff calculations.Namibia2000ZambiaMiddle East& NorthAfricaMozambiqueMalawi2005Sub-Saharan AfricaSource: Joint United Nations Programme on HIV/AIDS and <strong>World</strong><strong>Development</strong> <strong>Indicators</strong> database.SouthAsiaUgandaSub-SaharanAfricaKenya6a20116b6cTanzaniaNote: Comprehensive and correct knowledge about HIV entails knowledgeof two ways to prevent HIV and rejecting three misconceptions.Source: Joint United Nations Programme on HIV/AIDS and <strong>World</strong><strong>Development</strong> <strong>Indicators</strong> database.Epidemic diseases exact a huge toll in humansuffering and lost opportunities for development.Poverty, armed conflict, and natural disasterscontribute to the spread of disease and are madeworse by it. In Africa the spread of HIV/AIDS hasreversed decades of improvement in life expectancyand left millions of children orphaned.Malaria takes a large toll on young children andweakens adults at great cost to their productivity.Tuberculosis killed 1.4 million people in 2010,most of them ages 15–45, and sickened millionsmore.There were 34 million people living with HIV/AIDS in 2011, and 2.5 million more peopleacquired the disease. Sub- Saharan Africa remainsthe center of the HIV/AIDS epidemic, but the proportionof adults living with AIDS has begun tofall even as the survival rate of those with accessto antiretroviral drugs has increased (figures 6aand 6b). By the end of 2010, 6.5 million peopleworldwide were receiving antiretroviral drugs. Thisrepresented the largest one-year increase in coveragebut still fell far short of universal access(United Nations 2012).Altering the course of the HIV epidemic requireschanges in behaviors by those already infected bythe virus and those at risk of becoming infected.<strong>Knowledge</strong> of the cause of the disease, its transmission,and what can be done to avoid it is thestarting point. The ability to reject false informationis another important kind of knowledge. Butsignificant gaps in knowledge remain. In 26 of31 countries with a generalized epidemic and inwhich nationally representative surveys were carriedout recently, less than half of young womenhave comprehensive and correct knowledge aboutHIV (UNAIDS 2012). And less than half of men in21 of 25 countries had correct knowledge. In only12 <strong>World</strong> <strong>Development</strong> <strong>Indicators</strong> <strong>2013</strong> Front ? User guide <strong>World</strong> view People Environment
3 of the 10 countries with the highest HIV prevalencerates in 2011 did more than half the menand women tested demonstrate knowledge of twoways to prevent HIV and reject three misconceptions(figure 6c). In Kenya men scored better than50 percent, but women fell short. Clearly morework is to be done.In 2011 there were 8.8 million people newlydiagnosed with tuberculosis, but incidence, prevalence,and death rates from tuberculosis arefalling (figure 6d). If these trends are sustained,the world could achieve the target of halting andreversing the spread of this disease by 2015.People living with HIV/AIDS, which reduces resistanceto tuberculosis, are particularly vulnerable,as are refugees, displaced persons, and prisonersliving in close quarters and unsanitary conditions.Well-managed medical intervention usingappropriate drug therapy is crucial to stopping thespread of tuberculosis.There are 300–500 million cases of malariaeach year, causing more than 1 million deaths.Malaria is a disease of poverty. But there hasbeen progress against it. In 2011 Armenia wasadded to the list of countries certified free of thedisease. Although malaria occurs in all regions,Sub- Saharan Africa is where the most lethal formof the malaria parasite is most abundant. Insecticide-treatednets have proved to be an effectivepreventative, and their use in the region isgrowing: from 2 percent of the population underage 5 in 2000 to 39 percent in 2010 (figure 6e).Better testing and the use of combination therapieswith artemisinin-based drugs are improvingthe treatment of at-risk populations. But malariais difficult to control. There is evidence of emergingresistance to artemisinins and to pyrethroidinsecticides used to treat mosquito nets.Fewer people contracting, living with,and dying from tuberculosisTuberculosis prevalence, incidence, and deaths in low- andmiddle-income countries (per 100,000 people)40030020010001990PrevalenceIncidenceDeaths1995Use of insecticide-treated netsincreasing in Sub- Saharan AfricaUse of insecticide-treated nets (% of population under age 5)First observation (2000 or earlier) Most recent observation (2006 or later)SwazilandCôte d’IvoireGuineaComorosZimbabweChadSomaliaMozambiqueBeninCameroonSudanAngolaNigeriaSierra LeoneEthiopiaGambia, TheNamibiaSenegalGuinea-BissauCentral African Rep.LiberiaCongo, Dem. Rep.GhanaMalawiUgandaBurundiMadagascarKenyaBurkina FasoEritreaZambiaGabonSão Tomé and PríncipeTogoTanzaniaNigerRwandaMaliCongo, Rep. (2005)Mauritania (2004)20002005Source: <strong>World</strong> Health Organization and <strong>World</strong> <strong>Development</strong> <strong>Indicators</strong>database.6d20116e0 20 40 60 80Source: United Nations Children’s Fund and <strong>World</strong> <strong>Development</strong><strong>Indicators</strong> database.Economy States and markets Global links Back<strong>World</strong> <strong>Development</strong> <strong>Indicators</strong> <strong>2013</strong> 13
Goal 7 Ensure environmental sustainabilityCarbon dioxide emissionsdropped slightly in 2009Carbon dioxide emissions (millions of metric tons)4030201001990Forest losses7band gainsAverage annual change in forest area (thousands of squarekilometers)2500–250–500Better access toimproved water sourcesShare of population with access to improved water sources (%)1007550250East Asia& Pacific19902010East Asia& Pacific1995Europe& CentralAsiaEurope& CentralAsia1990–20002000–10LatinAmerica &CaribbeanLatinAmerica &CaribbeanLower middle income2000Middle East& NorthAfricaSouthAsiaMiddle East& NorthAfricaUpper middle income2005Source: Carbon Dioxide Information Analysis Center and <strong>World</strong><strong>Development</strong> <strong>Indicators</strong> database.Sub-Saharan HighAfrica incomeSource: Food and Agriculture Organization and <strong>World</strong> <strong>Development</strong><strong>Indicators</strong> database.SouthAsiaHigh incomeLow income7cSub-SaharanAfricaSource: Joint Monitoring Programme of the <strong>World</strong> Health Organizationand United Nations Children’s Fund and <strong>World</strong> <strong>Development</strong> <strong>Indicators</strong>database.7a2009The seventh goal of the Millennium <strong>Development</strong>Goals is the most far-reaching, affecting eachperson now and in the future. It addresses thecondition of the natural and built environments:reversing the loss of natural resources, preservingbiodiversity, increasing access to safewater and sanitation, and improving living conditionsof people in slums. The overall theme issustainability, an equilibrium in which people’slives can improve without depleting natural andmanmade capital stocks.The failure to reach a comprehensive agreementon limiting greenhouse gas emissions leavesbillions of people vulnerable to climate change.Although the global financial crisis caused a slightdecrease in carbon dioxide emissions, such emissionsare expected to rise as economic activityresumes in large industrial economies (figure 7a).The loss of forests threatens the livelihood ofpoor people, destroys the habitat that harbors biodiversity,and eliminates an important carbon sinkthat helps moderate the climate. Net losses since1990 have been substantial, especially in LatinAmerican and the Caribbean and Sub- SaharanAfrica, and only partly compensated by net gainselsewhere. The rate of deforestation slowed in thepast decade, but on current trends zero net losseswill not be reached for another 20 years (figure 7b).Protecting forests and other terrestrial andmarine areas helps protect plant and animalhabitats and preserve the diversity of species. By2010, 13 percent of the world’s land area hadbeen protected, but only 1.6 percent of oceanshad similar protection. Such measures haveslowed the rate of species extinction, but substantiallosses continue (United Nations 2012).The Millennium <strong>Development</strong> Goals call forhalving the proportion of the population withoutaccess to improved sanitation facilities and watersources by 2015. In 1990 more than 1 billionpeople lacked access to drinking water from aconvenient, protected source. In developing countriesthe proportion of people with access to an14 <strong>World</strong> <strong>Development</strong> <strong>Indicators</strong> <strong>2013</strong> Front ? User guide <strong>World</strong> view People Environment
improved water source rose from 71 percent in1990 to 86 in 2010 (figure 7c).In 1990 only 37 percent of the people living inlow- and middle-income economies had access toa flush toilet or other form of improved sanitation.By 2010 the access rate had risen to 56 percent.But 2.7 billion people still lack access toimproved sanitation, and more than 1 billion practiceopen defecation, posing enormous healthrisks. The situation is worse in rural areas, where43 percent of the population have access toimproved sanitation; in urban areas the accessrate is 30 percentage points higher (figure 7d).This large disparity, especially in South Asia andSub- Saharan Africa, is the principal reason thesanitation target of the Millennium <strong>Development</strong>Goals will not be met.Achieving sustainable development alsorequires managing natural resources carefully,since high economic growth can deplete naturalcapital, such as forests and minerals. Countriesthat rely heavily on extractive industries haveseen large increases in natural resource rents,but their growth will not be sustainable unlessthey invest in productive assets, including humancapital (figure 7e).The <strong>World</strong> Bank has constructed a global databaseto monitor the sustainability of economicprogress using wealth accounts, including indicatorsof adjusted net savings and adjusted netnational income. Wealth is defined comprehensivelyto include stocks of manufactured capital,natural capital, human capital, and social capital.<strong>Development</strong> is conceived as building wealth andmanaging a portfolio of assets. The challenge ofdevelopment is to manage not just the total volumeof assets but also the composition of theasset portfolio—that is, how much to invest indifferent types of capital. Adjusted net savings isa sustainability indicator that measures whether acountry is building its wealth sustainably (positivevalues) or running it down on an unsustainabledevelopment path (negative values; figure 7f).Rural areas lacksanitation facilitiesShare of population with access to improved sanitation facilities,2010 (%)10075502505040302010Latin America & Caribbean019901995A nonsustainable pathin Sub‐Saharan AfricaShare of gross national income, 2008 (%)20100–10RuralUrbanEast Asia& PacificResource rents (% of GDP)GrosssavingsEurope& CentralAsiaDepreciationof fixedcapitalNetsavingsSource: <strong>World</strong> Bank 2011.LatinAmerica &CaribbeanResource rents are a large share ofGDP in Africa and the Middle EastMiddle East & North Africa2000EducationexpendituresMiddle East& NorthAfricaNet savingsplus educationexpedituresSouthAsia2005DepletionadjustedsavingsEurope &Central AsiaSub-SaharanAfricaEast Asia & PacificDepletionof naturalresourcesPollutiondamagesSub-SaharanAfricaSource: Joint Monitoring Programme of the <strong>World</strong> Health Organizationand United Nations Children’s Fund and <strong>World</strong> <strong>Development</strong> <strong>Indicators</strong>database.7eSouth Asia2010Source: <strong>World</strong> Bank staff calculations and <strong>World</strong> <strong>Development</strong> <strong>Indicators</strong>database.7d7fAdjustednet savingsEconomy States and markets Global links Back<strong>World</strong> <strong>Development</strong> <strong>Indicators</strong> <strong>2013</strong> 15
Goal 8 Develop a global partnership for developmentAid flowsdeclineOfficial development assistance from <strong>Development</strong> AssistanceCommittee members (2010 $ billions)2001501005001990Agricultural support ($ billions)1501005001990More opportunities for exportersin developing countriesGoods (excluding arms) admitted free of tariffs from developingcountries (% total merchandise imports, excluding arms)100755025JapanUnited StatesEuropeanUnion1995Domestic subsidies toagriculture exceed aid flows1995NorwayBilateral net official development assistance,excluding debt relief and humanitarian assistanceMultilateral net official development assistance,excluding debt relief and humanitarian assistance2000European UnionKorea, Rep.2000Net debt reliefUnited StatesJapan2005Turkey2005Humanitarian assistanceSource: Organisation for Economic Co-operation and <strong>Development</strong>StatExtracts.Source: Organisation for Economic Co-operation and <strong>Development</strong>StatExtracts.8a8b8cAustralia2011201101996 1998 2000 2002 2004 2006 2008 2010Source: <strong>World</strong> Trade Organization, International Trade Center, UnitedNations Conference on Trade and <strong>Development</strong>, and <strong>World</strong> <strong>Development</strong><strong>Indicators</strong> database.The eighth and final goal distinguishes the Millennium<strong>Development</strong> Goals from previous resolutionsand targeted programs. It recognizes themultidimensional nature of development and theneed for wealthy countries and developing countriesto work together to create an environment inwhich rapid, sustainable development is possible.Along with increased aid flows and debt relief forthe poorest, highly indebted countries, goal 8 recognizesthe need to reduce barriers to trade andto share the benefits of new medical and communicationtechnologies. It is also a reminder thatdevelopment challenges differ for large and smallcountries and for those that are landlocked or isolatedby large expanses of ocean. Building andsustaining a partnership is an ongoing processthat does not stop at a specific date or when atarget is reached.After falling through much of the 1990s, officialdevelopment assistance (ODA) from membersof the Organisation for Economic Co-operationand <strong>Development</strong>’s (OECD) <strong>Development</strong>Assistance Committee (DAC) rose sharply after2002, but a large part of the increase was in theform of debt relief and humanitarian assistance(figure 8a). The financial crisis that began in 2008and fiscal austerity in many high-income economieshave begun to undermine commitmentsto increase ODA. Net disbursements of ODA bymembers of the DAC rose to $134 billion in 2011,but, after accounting for price and exchangerate adjustments, fell 2.3 percent in real termsfrom 2010. Aid from multilateral organizationsremained essentially unchanged at $34.7 billion,a decrease of 6.6 percent in real terms. ODA fromDAC members has fallen back to 0.31 percent oftheir combined gross national income, less thanhalf the UN target of 0.7 percent.OECD members, mostly high-income economiesbut also some upper middle-income economiessuch as Chile, Mexico, and Turkey, continueto spend more on support to domestic agriculturalproducers than on ODA. In 2011 the OECD16 <strong>World</strong> <strong>Development</strong> <strong>Indicators</strong> <strong>2013</strong> Front ? User guide <strong>World</strong> view People Environment
estimate of agricultural subsidies was $252 billion,41 percent of which was to EU producers(figure 8b).Many rich countries have pledged to open theirmarkets to exports from developing countries, andthe share of goods (excluding arms) admitted dutyfree by OECD economies has been rising. However,arcane rules of origin and phytosanitary standardskeep many countries from qualifying for duty-freeaccess. And uncertainty over market access mayinhibit development of export industries (figure 8c).Growing economies, better debt management,and debt relief for the poorest countries haveallowed developing countries to substantiallyreduce their debt burdens. Despite the financialcrisis and a 2.3 percent contraction in the globaleconomy in 2009, the debt service to exports ratioin low- and middle-income economies reached anew low of 8.8 percent in 2011. In Europe andCentral Asia, where the debt service to exportsratio rose to 26 percent in 2009, higher exportearnings have helped return the average to its2007 level of 17.8 percent (figure 8d).Telecommunications is an essential tool fordevelopment, and new technologies are creatingnew opportunities everywhere. The growth of fixedlinephone systems has peaked in high-incomeeconomies and will never reach the same levelof use in developing countries. In high-incomeeconomies mobile phone subscriptions have nowpassed 1 per person, and upper middle-incomeeconomies are not far behind (figure 8e).Mobile phones are one of several ways ofaccessing the Internet. In 2000 Internet use wasspreading rapidly in high-income economies butwas barely under way in developing country regions.Now developing countries are beginning to catchup. Since 2000 Internet use per person in developingeconomies has grown 28 percent a year. Liketelephones, Internet use is strongly correlated withincome. The low-income economies of South Asiaand Sub- Saharan Africa lag behind, but even thereInternet access is spreading rapidly (figure 8f).Debt service burdenscontinue to fallTotal debt service (% of exports of goods, services, and income)5040302010Mobile phone subscriptions (per 100 people)125100755025More people connectingto the InternetInternet users (per 100 people)80604020South AsiaEast Asia& Pacific019900199002000Middle East & North Africa20021995Telecommunicationson the move1995Sub-Saharan Africa20042000Latin America & CaribbeanEast Asia & PacificLatin America & Caribbean2000Middle East & North AfricaSource: <strong>World</strong> <strong>Development</strong> <strong>Indicators</strong> database.Lower middleincome200620052005High incomeEurope & Central Asia2008High incomeUpper middleincomeLow incomeSub-SaharanAfricaSouth Asia8dEurope &Central Asia20118e2011Source: International Telecommunications Union and <strong>World</strong> <strong>Development</strong><strong>Indicators</strong> database.8f2011Source: International Telecommunications Union and <strong>World</strong> <strong>Development</strong><strong>Indicators</strong> database.Economy States and markets Global links Back<strong>World</strong> <strong>Development</strong> <strong>Indicators</strong> <strong>2013</strong> 17
Millennium <strong>Development</strong> GoalsGoals and targets from the Millennium Declaration <strong>Indicators</strong> for monitoring progressGoal 1 Eradicate extreme poverty and hungerTarget 1.A Halve, between 1990 and 2015, the proportion ofpeople whose income is less than $1 a dayTarget 1.B Achieve full and productive employment and decentwork for all, including women and young peopleTarget 1.C Halve, between 1990 and 2015, the proportion ofpeople who suffer from hungerGoal 2Achieve universal primary educationTarget 2.A Ensure that by 2015 children everywhere, boys andgirls alike, will be able to complete a full course ofprimary schoolingGoal 3Promote gender equality and empower womenTarget 3.A Eliminate gender disparity in primary and secondaryeducation, preferably by 2005, and in all levels ofeducation no later than 2015Goal 4Reduce child mortalityTarget 4.A Reduce by two-thirds, between 1990 and 2015, theunder-five mortality rateGoal 5Improve maternal healthTarget 5.A Reduce by three-quarters, between 1990 and 2015,the maternal mortality ratioTarget 5.B Achieve by 2015 universal access to reproductivehealthGoal 6Combat HIV/AIDS, malaria, and other diseasesTarget 6.A Have halted by 2015 and begun to reverse thespread of HIV/AIDSTarget 6.B Achieve by 2010 universal access to treatment forHIV/AIDS for all those who need itTarget 6.C Have halted by 2015 and begun to reverse theincidence of malaria and other major diseases1.1 Proportion of population below $1 purchasing powerparity (PPP) a day a1.2 Poverty gap ratio [incidence × depth of poverty]1.3 Share of poorest quintile in national consumption1.4 Growth rate of GDP per person employed1.5 Employment to population ratio1.6 Proportion of employed people living below $1 (PPP) a day1.7 Proportion of own-account and contributing familyworkers in total employment1.8 Prevalence of underweight children under five years of age1.9 Proportion of population below minimum level of dietaryenergy consumption2.1 Net enrollment ratio in primary education2.2 Proportion of pupils starting grade 1 who reach lastgrade of primary education2.3 Literacy rate of 15- to 24-year-olds, women and men3.1 Ratios of girls to boys in primary, secondary, and tertiaryeducation3.2 Share of women in wage employment in thenonagricultural sector3.3 Proportion of seats held by women in national parliament4.1 Under-five mortality rate4.2 Infant mortality rate4.3 Proportion of one-year-old children immunized againstmeasles5.1 Maternal mortality ratio5.2 Proportion of births attended by skilled health personnel5.3 Contraceptive prevalence rate5.4 Adolescent birth rate5.5 Antenatal care coverage (at least one visit and at leastfour visits)5.6 Unmet need for family planning6.1 HIV prevalence among population ages 15–24 years6.2 Condom use at last high-risk sex6.3 Proportion of population ages 15–24 years withcomprehensive, correct knowledge of HIV/AIDS6.4 Ratio of school attendance of orphans to schoolattendance of nonorphans ages 10–14 years6.5 Proportion of population with advanced HIV infection withaccess to antiretroviral drugs6.6 Incidence and death rates associated with malaria6.7 Proportion of children under age five sleeping underinsecticide-treated bednets6.8 Proportion of children under age five with fever who aretreated with appropriate antimalarial drugs6.9 Incidence, prevalence, and death rates associated withtuberculosis6.10 Proportion of tuberculosis cases detected and curedunder directly observed treatment short courseNote: The Millennium <strong>Development</strong> Goals and targets come from the Millennium Declaration, signed by 189 countries, including 147 heads of state and government, in September2000 (www.un.org/millennium/declaration/ares552e.htm) as updated by the 60th UN General Assembly in September 2005. The revised Millennium <strong>Development</strong> Goal (MDG) monitoringframework shown here, including new targets and indicators, was presented to the 62nd General Assembly, with new numbering as recommended by the Inter-agency and Expert Group onMDG <strong>Indicators</strong> at its 12th meeting on November 14, 2007. The goals and targets are interrelated and should be seen as a whole. They represent a partnership between the developedcountries and the developing countries “to create an environment—at the national and global levels alike—which is conducive to development and the elimination of poverty.” All indicatorsshould be disaggregated by sex and urban-rural location as far as possible.18 <strong>World</strong> <strong>Development</strong> <strong>Indicators</strong> <strong>2013</strong>Front ? User guide <strong>World</strong> view People Environment
Goals and targets from the Millennium Declaration <strong>Indicators</strong> for monitoring progressGoal 7 Ensure environmental sustainabilityTarget 7.A Integrate the principles of sustainable developmentinto country policies and programs and reverse theloss of environmental resourcesTarget 7.B Reduce biodiversity loss, achieving, by 2010,a significant reduction in the rate of lossTarget 7.C Halve by 2015 the proportion of people withoutsustainable access to safe drinking water and basicsanitationTarget 7.D Achieve by 2020 a significant improvement in thelives of at least 100 million slum dwellersGoal 8Develop a global partnership for developmentTarget 8.A Develop further an open, rule-based, predictable,nondiscriminatory trading and financial system(Includes a commitment to good governance,development, and poverty reduction—bothnationally and internationally.)Target 8.B Address the special needs of the least developedcountries(Includes tariff and quota-free access for the leastdeveloped countries’ exports; enhanced program ofdebt relief for heavily indebted poor countries (HIPC)and cancellation of official bilateral debt; and moregenerous ODA for countries committed to povertyreduction.)Target 8.C Address the special needs of landlockeddeveloping countries and small island developingstates (through the Programme of Action forthe Sustainable <strong>Development</strong> of Small IslandDeveloping States and the outcome of the 22ndspecial session of the General Assembly)Target 8.D Deal comprehensively with the debt problemsof developing countries through national andinternational measures in order to make debtsustainable in the long termTarget 8.E In cooperation with pharmaceutical companies,provide access to affordable essential drugs indeveloping countriesTarget 8.F In cooperation with the private sector, makeavailable the benefits of new technologies,especially information and communications7.1 Proportion of land area covered by forest7.2 Carbon dioxide emissions, total, per capita andper $1 GDP (PPP)7.3 Consumption of ozone-depleting substances7.4 Proportion of fish stocks within safe biological limits7.5 Proportion of total water resources used7.6 Proportion of terrestrial and marine areas protected7.7 Proportion of species threatened with extinction7.8 Proportion of population using an improved drinking watersource7.9 Proportion of population using an improved sanitationfacility7.10 Proportion of urban population living in slums bSome of the indicators listed below are monitored separatelyfor the least developed countries (LDCs), Africa, landlockeddeveloping countries, and small island developing states.Official development assistance (ODA)8.1 Net ODA, total and to the least developed countries, aspercentage of OECD/DAC donors’ gross national income8.2 Proportion of total bilateral, sector-allocable ODA ofOECD/DAC donors to basic social services (basiceducation, primary health care, nutrition, safe water, andsanitation)8.3 Proportion of bilateral official development assistance ofOECD/DAC donors that is untied8.4 ODA received in landlocked developing countries as aproportion of their gross national incomes8.5 ODA received in small island developing states as aproportion of their gross national incomesMarket access8.6 Proportion of total developed country imports (by valueand excluding arms) from developing countries and leastdeveloped countries, admitted free of duty8.7 Average tariffs imposed by developed countries onagricultural products and textiles and clothing fromdeveloping countries8.8 Agricultural support estimate for OECD countries as apercentage of their GDP8.9 Proportion of ODA provided to help build trade capacityDebt sustainability8.10 Total number of countries that have reached their HIPCdecision points and number that have reached their HIPCcompletion points (cumulative)8.11 Debt relief committed under HIPC Initiative andMultilateral Debt Relief Initiative (MDRI)8.12 Debt service as a percentage of exports of goods andservices8.13 Proportion of population with access to affordableessential drugs on a sustainable basis8.14 Fixed-line telephones per 100 population8.15 Mobile cellular subscribers per 100 population8.16 Internet users per 100 populationa. Where available, indicators based on national poverty lines should be used for monitoring country poverty trends.b. The proportion of people living in slums is measured by a proxy, represented by the urban population living in households with at least one of these characteristics: lack of access toimproved water supply, lack of access to improved sanitation, overcrowding (three or more people per room), and dwellings made of nondurable material.Economy States and markets Global links Back<strong>World</strong> <strong>Development</strong> <strong>Indicators</strong> <strong>2013</strong> 19
1 <strong>World</strong> viewPopulationSurfaceareaPopulationdensityUrbanpopulationAtlas methodGross national incomePurchasing power parityGross domesticproductmillionsthousandsq. kmpeopleper sq. km% of totalpopulation$ billionsPer capita$ $ billionsPer capita$ % growthPer capita% growth2011 2011 2011 2011 2011 2011 2011 2011 2010–11 2010–11Afghanistan 35.3 652.2 54 24 16.6 470 40.3 a 1,140 a 5.7 2.9Albania 3.2 28.8 117 53 12.8 3,980 28.4 8,820 3.0 2.6Algeria 36.0 2,381.7 15 73 160.8 4,470 299.0 a 8,310 a 2.5 1.0American Samoa 0.1 0.2 348 93 .. .. b .. .. .. ..Andorra 0.1 0.5 183 87 .. .. c .. .. .. ..Angola 19.6 1,246.7 16 59 75.2 3,830 d 102.7 5,230 3.9 1.1Antigua and Barbuda 0.1 0.4 204 30 1.1 11,940 1.6 a 17,900 a –5.0 –6.0Argentina 40.8 2,780.4 15 93 .. .. .. .. .. ..Armenia 3.1 29.7 109 64 10.4 3,360 18.9 6,100 4.6 4.3Aruba 0.1 0.2 601 47 .. .. c .. .. .. ..Australia 22.3 7,741.2 3 89 1,111.4 49,790 862.0 38,610 1.9 0.7Austria 8.4 83.9 102 68 405.7 48,170 354.0 42,030 2.7 2.3Azerbaijan 9.2 86.6 111 54 48.5 5,290 82.1 8,950 1.0 –0.3Bahamas, The 0.3 13.9 35 84 7.5 21,970 10.2 a 29,790 a 1.6 0.4Bahrain 1.3 0.8 1,742 89 20.1 15,920 26.8 21,200 3.0 –3.1Bangladesh 150.5 144.0 1,156 28 117.8 780 291.7 1,940 6.7 5.4Barbados 0.3 0.4 637 44 3.5 12,660 5.2 a 18,900 a 1.2 –5.5Belarus 9.5 207.6 47 75 55.2 5,830 137.0 14,460 5.3 5.5Belgium 11.0 30.5 364 98 506.2 45,930 431.4 39,150 1.8 0.6Belize 0.4 23.0 16 45 1.3 3,710 2.2 a 6,090 a 1.9 –1.5Benin 9.1 112.6 82 45 7.1 780 14.6 1,610 3.5 0.7Bermuda 0.1 0.1 1,294 100 .. .. c .. .. –1.9 –1.7Bhutan 0.7 38.4 19 36 1.6 2,130 4.1 5,570 5.6 3.8Bolivia 10.1 1,098.6 9 67 20.4 2,020 49.3 4,890 5.2 3.5Bosnia and Herzegovina 3.8 51.2 74 48 18.0 4,780 34.5 9,190 1.7 1.9Botswana 2.0 581.7 4 62 15.2 7,470 29.5 14,550 5.7 4.5Brazil 196.7 8,514.9 23 85 2,107.7 10,720 2,245.8 11,420 2.7 1.8Brunei Darussalam 0.4 5.8 77 76 12.5 31,800 19.6 49,910 2.2 0.4Bulgaria 7.3 111.0 68 73 48.8 6,640 105.8 14,400 1.7 4.3Burkina Faso 17.0 274.2 62 27 9.9 580 22.5 1,330 4.2 1.1Burundi 8.6 27.8 334 11 2.2 250 5.2 610 4.2 1.9Cambodia 14.3 181.0 81 20 11.7 820 31.8 2,230 7.1 5.8Cameroon 20.0 475.4 42 52 24.1 1,210 46.7 2,330 4.2 2.0Canada 34.5 9,984.7 4 81 1,570.9 45,550 1,367.6 39,660 2.5 1.4Cape Verde 0.5 4.0 124 63 1.8 3,540 2.0 3,980 5.0 4.1Cayman Islands 0.1 0.3 236 100 .. .. c .. .. .. ..Central African Republic 4.5 623.0 7 39 2.1 480 3.6 810 3.3 1.3Chad 11.5 1,284.0 9 22 8.3 720 17.7 1,540 1.6 –1.0Channel Islands 0.2 0.2 810 31 .. .. c .. .. .. ..Chile 17.3 756.1 23 89 212.0 12,280 282.1 16,330 6.0 5.0China 1,344.1 9,600.0 144 51 6,643.2 4,940 11,270.8 8,390 9.3 8.8Hong Kong SAR, China 7.1 1.1 6,787 100 254.6 36,010 370.2 52,350 4.9 4.8Macao SAR, China 0.6 0.0 e 19,848 100 24.7 45,460 31.0 56,950 20.7 18.1Colombia 46.9 1,141.8 42 75 284.9 6,070 448.6 9,560 5.9 4.5Comoros 0.8 1.9 405 28 0.6 770 0.8 1,110 2.2 –0.4Congo, Dem. Rep. 67.8 2,344.9 30 34 13.1 190 23.2 340 6.9 4.1Congo, Rep. 4.1 342.0 12 64 9.3 2,250 13.4 3,240 3.4 1.020 <strong>World</strong> <strong>Development</strong> <strong>Indicators</strong> <strong>2013</strong> Front ? User guide <strong>World</strong> view People Environment
<strong>World</strong> view 1PopulationSurfaceareaPopulationdensityUrbanpopulationAtlas methodGross national incomePurchasing power parityGross domesticproductmillionsthousandsq. kmpeopleper sq. km% of totalpopulation$ billionsPer capita$ $ billionsPer capita$ % growthPer capita% growth2011 2011 2011 2011 2011 2011 2011 2011 2010–11 2010–11Costa Rica 4.7 51.1 93 65 36.1 7,640 56.1 a 11,860 a 4.2 2.7Côte d’Ivoire 20.2 322.5 63 51 22.1 1,090 34.5 1,710 –4.7 –6.7Croatia 4.4 56.6 79 58 59.6 13,540 82.7 18,780 0.0 0.3Cuba 11.3 109.9 106 75 .. .. b .. .. 2.1 2.1Curaçao 0.1 0.4 328 .. .. .. c .. .. .. ..Cyprus 1.1 9.3 121 71 23.7 f 29,450 f 24.9 f 30,970 f 0.5 f 0.3 fCzech Republic 10.5 78.9 136 73 196.3 18,700 257.0 24,490 1.9 2.1Denmark 5.6 43.1 131 87 335.1 60,160 233.5 41,920 1.1 0.7Djibouti 0.9 23.2 39 77 1.1 1,270 2.1 2,450 5.0 3.0Dominica 0.1 0.8 90 67 0.5 7,030 0.9 a 13,000 a –0.3 –0.2Dominican Republic 10.1 48.7 208 70 52.6 5,240 94.7 a 9,420 a 4.5 3.1Ecuador 14.7 256.4 59 67 61.7 4,200 124.7 8,510 7.8 6.3Egypt, Arab Rep. 82.5 1,001.5 83 44 214.7 2,600 504.8 6,120 1.8 0.1El Salvador 6.2 21.0 301 65 21.7 3,480 41.4 a 6,640 a 1.5 0.9Equatorial Guinea 0.7 28.1 26 40 11.3 15,670 18.4 25,620 7.8 4.8Eritrea 5.4 117.6 54 21 2.3 430 3.1 a 580 a 8.7 5.5Estonia 1.3 45.2 32 70 20.4 15,260 27.9 20,850 8.3 8.3Ethiopia 84.7 1,104.3 85 17 31.0 370 93.8 1,110 7.3 5.0Faeroe Islands 0.0 g 1.4 35 41 .. .. c .. .. .. ..Fiji 0.9 18.3 48 52 3.2 3,720 4.0 4,610 2.0 1.1Finland 5.4 338.4 18 84 257.3 47,760 202.9 37,660 2.7 2.3France 65.4 549.2 120 86 2,775.7 42,420 2,349.8 35,910 1.7 1.1French Polynesia 0.3 4.0 75 51 .. .. c .. .. .. ..Gabon 1.5 267.7 6 86 12.4 8,080 21.1 13,740 4.8 2.8Gambia, The 1.8 11.3 178 57 0.9 500 3.1 1,750 –4.3 –6.9Georgia 4.5 h 69.7 79 h 53 h 12.8 h 2,860 h 24.0 h 5,350 h 7.0 h 6.2 hGermany 81.8 357.1 235 74 3,617.7 44,230 3,287.6 40,190 3.0 3.0Ghana 25.0 238.5 110 52 35.1 1,410 45.2 1,810 14.4 11.8Greece 11.3 132.0 88 62 276.7 24,490 283.7 25,110 –7.1 –7.0Greenland 0.1 410.5 i 0 j 85 1.5 26,020 .. .. –5.4 –5.4Grenada 0.1 0.3 309 39 0.8 7,350 1.1 a 10,350 a 1.0 0.6Guam 0.2 0.5 337 93 .. .. c .. .. .. ..Guatemala 14.8 108.9 138 50 42.4 2,870 70.3 a 4,760 a 3.9 1.3Guinea 10.2 245.9 42 36 4.4 430 10.5 1,020 3.9 1.5Guinea-Bissau 1.5 36.1 55 44 0.9 600 1.9 1,230 5.7 3.5Guyana 0.8 215.0 4 28 2.2 2,900 2.6 a 3,460 a 4.2 4.2Haiti 10.1 27.8 367 53 7.1 700 11.9 a 1,180 a 5.6 4.2Honduras 7.8 112.5 69 52 15.4 1,980 29.7 a 3,820 a 3.6 1.6Hungary 10.0 93.0 110 69 126.9 12,730 202.5 20,310 1.7 2.0Iceland 0.3 103.0 3 94 11.1 34,820 9.9 31,020 2.6 2.2India 1,241.5 3,287.3 418 31 1,766.2 1,420 4,524.6 3,640 6.3 4.9Indonesia 242.3 1,904.6 134 51 712.7 2,940 1,091.4 4,500 6.5 5.4Iran, Islamic Rep. 74.8 1,745.2 46 69 330.4 4,520 835.5 11,420 .. ..Iraq 33.0 435.2 76 67 87.0 2,640 123.5 3,750 9.9 6.8Ireland 4.6 70.3 66 62 179.2 39,150 153.4 33,520 0.7 –1.5Isle of Man 0.1 0.6 146 51 .. .. c .. .. .. ..Israel 7.8 22.1 359 92 224.7 28,930 210.5 27,110 4.7 2.8Economy States and markets Global links Back<strong>World</strong> <strong>Development</strong> <strong>Indicators</strong> <strong>2013</strong> 21
1 <strong>World</strong> viewPopulationSurfaceareaPopulationdensityUrbanpopulationAtlas methodGross national incomePurchasing power parityGross domesticproductmillionsthousandsq. kmpeopleper sq. km% of totalpopulation$ billionsPer capita$ $ billionsPer capita$ % growthPer capita% growth2011 2011 2011 2011 2011 2011 2011 2011 2010–11 2010–11Italy 60.7 301.3 206 68 2,144.7 35,320 1,968.9 32,420 0.4 0.0Jamaica 2.7 11.0 250 52 .. .. b .. .. –0.3 ..Japan 127.8 377.9 351 91 5,739.5 44,900 4,516.3 35,330 –0.7 –1.0Jordan 6.2 89.3 70 83 27.1 4,380 36.6 5,930 2.6 0.4Kazakhstan 16.6 2,724.9 6 54 136.7 8,260 186.4 11,250 7.5 6.0Kenya 41.6 580.4 73 24 34.1 820 71.1 1,710 4.4 1.6Kiribati 0.1 0.8 125 44 0.2 2,030 0.3 a 3,300 a 1.8 0.2Korea, Dem. Rep. 24.5 120.5 203 60 .. .. k .. .. .. ..Korea, Rep. 49.8 99.9 513 83 1,039.0 20,870 1,511.7 30,370 3.6 2.9Kosovo 1.8 10.9 166 .. 6.3 3,510 .. .. 5.0 3.4Kuwait 2.8 17.8 158 98 133.8 48,900 147.0 53,720 8.2 5.1Kyrgyz Republic 5.5 199.9 29 35 5.0 900 12.7 2,290 6.0 4.7Lao PDR 6.3 236.8 27 34 7.1 1,130 16.2 2,580 8.0 6.5Latvia 2.1 64.6 33 68 27.4 13,320 d 39.3 19,090 5.5 14.7Lebanon 4.3 10.5 416 87 38.9 9,140 61.6 14,470 3.0 2.2Lesotho 2.2 30.4 72 28 2.7 1,210 4.5 2,050 4.2 3.1Liberia 4.1 111.4 43 48 1.4 330 2.2 540 9.4 5.9Libya 6.4 1,759.5 4 78 77.1 12,320 105.2 a 16,800 a 2.1 0.3Liechtenstein 0.0 g 0.2 227 14 4.9 137,070 .. .. –1.2 –1.9Lithuania 3.0 65.3 48 67 39.3 12,980 d 62.9 20,760 5.9 14.8Luxembourg 0.5 2.6 200 85 40.1 77,390 33.2 64,110 1.7 –0.6Macedonia, FYR 2.1 25.7 82 59 9.9 4,810 23.5 11,370 2.8 2.7Madagascar 21.3 587.0 37 33 9.1 430 20.2 950 1.0 –1.9Malawi 15.4 118.5 163 16 5.6 360 13.4 870 4.3 1.1Malaysia 28.9 330.8 88 73 253.0 8,770 451.7 15,650 5.1 3.4Maldives 0.3 0.3 1,067 41 1.8 5,720 2.4 7,430 7.5 6.1Mali 15.8 1,240.2 13 35 9.7 610 16.8 1,060 2.7 –0.3Malta 0.4 0.3 1,299 95 7.7 18,620 10.2 24,480 2.1 2.2Marshall Islands 0.1 0.2 305 72 0.2 3,910 .. .. 5.0 3.5Mauritania 3.5 1,030.7 3 42 3.6 1,030 l 8.9 2,530 4.0 1.6Mauritius 1.3 2.0 634 42 10.3 8,040 18.4 14,330 4.1 3.7Mexico 114.8 1,964.4 59 78 1,081.8 9,420 1,766.4 15,390 3.9 2.7Micronesia, Fed. Sts. 0.1 0.7 159 23 0.3 2,860 0.4 a 3,580 a 2.1 1.6Moldova 3.6 m 33.9 124 m 48 m 7.1 m 1,980 m 13.0 m 3,640 m 6.4 m 6.5 mMonaco 0.0 g 0.0 e 17,714 100 6.5 183,150 .. .. –2.6 –2.7Mongolia 2.8 1,564.1 2 69 6.5 2,310 12.0 4,290 17.5 15.7Montenegro 0.6 13.8 47 63 4.5 7,140 8.7 13,700 3.2 3.1Morocco 32.3 446.6 72 57 97.6 n 2,970 n 160.1 n 4,880 n 4.5 n 3.5 nMozambique 23.9 799.4 30 31 11.1 460 22.9 960 7.1 4.7Myanmar 48.3 676.6 74 33 .. .. k .. .. .. ..Namibia 2.3 824.3 3 38 10.9 4,700 15.4 6,610 4.8 3.0Nepal 30.5 147.2 213 17 16.6 540 38.4 1,260 3.9 2.1Netherlands 16.7 41.5 495 83 829.0 49,660 720.3 43,150 1.0 0.5New Caledonia 0.3 18.6 14 62 .. .. c .. .. .. ..New Zealand 4.4 267.7 17 86 127.3 29,140 126.3 28,930 1.0 0.1Nicaragua 5.9 130.4 49 58 8.9 1,510 21.9 a 3,730 a 5.1 3.6Niger 16.1 1,267.0 13 18 5.8 360 11.6 720 2.3 –1.2?22 <strong>World</strong> <strong>Development</strong> <strong>Indicators</strong> <strong>2013</strong> Front User guide <strong>World</strong> view People Environment
<strong>World</strong> view 1PopulationSurfaceareaPopulationdensityUrbanpopulationAtlas methodGross national incomePurchasing power parityGross domesticproductmillionsthousandsq. kmpeopleper sq. km% of totalpopulation$ billionsPer capita$ $ billionsPer capita$ % growthPer capita% growth2011 2011 2011 2011 2011 2011 2011 2011 2010–11 2010–11Nigeria 162.5 923.8 178 50 207.3 1,280 372.8 2,290 7.4 4.7Northern Mariana Islands 0.1 0.5 133 92 .. .. c .. .. .. ..Norway 5.0 323.8 16 79 440.2 88,870 304.4 61,450 1.4 0.1Oman 2.8 309.5 9 73 53.6 19,260 71.6 25,720 5.5 3.1Pakistan 176.7 796.1 229 36 198.0 1,120 507.2 2,870 3.0 1.1Palau 0.0 g 0.5 45 84 0.1 6,510 0.2 a 11,080 a 5.8 5.1Panama 3.6 75.4 48 75 26.7 7,470 51.8 a 14,510 a 10.6 8.9Papua New Guinea 7.0 462.8 16 13 10.4 1,480 18.0 a 2,570 a 9.0 6.6Paraguay 6.6 406.8 17 62 19.8 3,020 35.4 5,390 6.9 5.0Peru 29.4 1,285.2 23 77 151.4 5,150 277.6 9,440 6.8 5.6Philippines 94.9 300.0 318 49 209.7 2,210 393.0 4,140 3.9 2.2Poland 38.5 312.7 127 61 477.0 12,380 o 780.8 20,260 4.3 3.4Portugal 10.6 92.1 115 61 225.6 21,370 259.9 24,620 –1.7 –0.9Puerto Rico 3.7 8.9 418 99 61.6 16,560 .. .. –2.1 –1.6Qatar 1.9 11.6 161 99 150.4 80,440 161.6 86,440 18.8 11.7Romania 21.4 238.4 93 53 174.0 8,140 337.4 15,780 2.5 2.7Russian Federation 143.0 17,098.2 9 74 1,522.3 10,650 2,917.7 20,410 4.3 3.9Rwanda 10.9 26.3 444 19 6.2 570 13.9 1,270 8.3 5.1Samoa 0.2 2.8 65 20 0.6 3,160 0.8 a 4,270 a 2.0 1.6San Marino 0.0 g 0.1 529 94 .. .. c .. .. .. ..São Tomé and Príncipe 0.2 1.0 176 63 0.2 1,350 0.4 2,080 4.9 3.0Saudi Arabia 28.1 2,149.7 p 13 82 500.5 17,820 693.7 24,700 6.8 4.4Senegal 12.8 196.7 66 43 13.7 1,070 24.8 1,940 2.6 –0.1Serbia 7.3 88.4 83 56 41.3 5,690 83.8 11,550 2.0 2.5Seychelles 0.1 0.5 187 54 1.0 11,270 2.3 a 26,280 a 5.0 5.6Sierra Leone 6.0 71.7 84 39 2.8 460 6.8 1,140 6.0 3.7Singapore 5.2 0.7 7,405 100 222.6 42,930 307.8 59,380 4.9 2.7Sint Maarten 0.0 g 0.0 e 1,077 .. .. .. c .. .. .. ..Slovak Republic 5.4 49.0 112 55 87.4 16,190 120.4 22,300 3.3 4.0Slovenia 2.1 20.3 102 50 48.5 23,600 54.4 26,500 –0.2 –0.4Solomon Islands 0.6 28.9 20 21 0.6 1,110 1.3 a 2,350 a 9.0 6.2Somalia 9.6 637.7 15 38 .. .. k .. .. .. ..South Africa 50.6 1,219.1 42 62 352.0 6,960 542.0 10,710 3.1 1.9South Sudan 10.3 p 644.3 .. 18 .. .. q .. .. 1.9 –1.7Spain 46.2 505.4 93 77 1,428.3 30,930 1,451.7 31,440 0.4 0.2Sri Lanka 20.9 65.6 333 15 53.8 2,580 115.2 5,520 8.3 7.1St. Kitts and Nevis 0.1 0.3 204 32 0.7 12,610 0.9 a 16,470 a 2.1 0.9St. Lucia 0.2 0.6 289 18 1.2 6,820 2.0 a 11,220 a 1.3 0.1St. Martin 0.0 g 0.1 563 .. .. .. c .. .. .. ..St. Vincent and Grenadines 0.1 0.4 280 49 0.7 6,070 1.1 a 10,440 a 0.1 0.1Sudan 34.3 p,r 1,861.5 r 18 33 58.3 u 1,310 u 94.7 u 2,120 u 4.7 u 2.2 uSuriname 0.5 163.8 3 70 4.1 7,840 4.1 a 7,730 a 4.7 3.7Swaziland 1.1 17.4 62 21 3.7 3,470 6.5 6,110 1.3 0.1Sweden 9.4 450.3 23 85 502.5 53,170 398.9 42,210 3.9 3.1Switzerland 7.9 41.3 198 74 604.1 76,350 415.6 52,530 1.9 0.8Syrian Arab Republic 20.8 185.2 113 56 67.9 2,750 104.0 5,080 .. ..Tajikistan 7.0 142.6 50 27 6.1 870 16.0 2,300 7.4 5.9Economy States and markets Global links Back<strong>World</strong> <strong>Development</strong> <strong>Indicators</strong> <strong>2013</strong> 23
1 <strong>World</strong> viewPopulationSurfaceareaPopulationdensityUrbanpopulationAtlas methodGross national incomePurchasing power parityGross domesticproductmillionsthousandsq. kmpeopleper sq. km% of totalpopulation$ billionsPer capita$ $ billionsPer capita$ % growthPer capita% growth2011 2011 2011 2011 2011 2011 2011 2011 2010–11 2010–11Tanzania 46.2 947.3 52 27 24.2 v 540 v 67.1 v 1,500 v 6.4 v 3.3 vThailand 69.5 513.1 136 34 308.3 4,440 581.4 8,360 0.1 –0.5Timor-Leste 1.2 14.9 79 28 3.1 2,730 5.9 a 5,200 a 10.6 7.5Togo 6.2 56.8 113 38 3.5 570 6.4 1,040 4.9 2.7Tonga 0.1 0.8 145 24 0.4 3,820 0.5 a 5,000 a 4.9 4.5Trinidad and Tobago 1.3 5.1 262 14 21.3 15,840 32.7 a 24,350 a –4.1 –4.4Tunisia 10.7 163.6 69 66 42.9 4,020 d 96.0 8,990 –2.0 –3.1Turkey 73.6 783.6 96 71 766.6 10,410 1,247.3 16,940 8.5 7.2Turkmenistan 5.1 488.1 11 49 24.5 4,800 44.3 a 8,690 a 14.7 13.3Turks and Caicos Islands 0.0 g 1.0 41 94 .. .. c .. .. .. ..Tuvalu 0.0 g 0.0 e 328 51 0.0 4,950 .. .. 1.2 1.0Uganda 34.5 241.6 173 16 17.5 510 45.3 1,310 6.7 3.3Ukraine 45.7 603.6 79 69 142.9 3,130 321.9 7,040 5.2 5.6United Arab Emirates 7.9 83.6 94 84 321.7 40,760 377.9 47,890 4.9 –0.1United Kingdom 62.7 243.6 259 80 2,370.4 37,780 2,255.9 35,950 0.8 0.0United States 311.6 9,831.5 34 82 15,148.2 48,620 15,211.3 48,820 1.7 1.0Uruguay 3.4 176.2 19 93 40.0 11,860 49.3 14,640 5.7 5.3Uzbekistan 29.3 447.4 69 36 44.2 1,510 100.3 a 3,420 a 8.3 5.4Vanuatu 0.2 12.2 20 25 0.7 2,730 1.1 a 4,330 a 1.4 –1.0Venezuela, RB 29.3 912.1 33 94 346.1 11,820 363.9 12,430 4.2 2.6Vietnam 87.8 331.1 283 31 111.1 1,270 285.5 3,250 5.9 4.8Virgin Islands (U.S.) 0.1 0.4 313 95 .. .. c .. .. .. ..West Bank and Gaza 3.9 6.0 652 74 .. .. q .. .. .. ..Yemen, Rep. 24.8 528.0 47 32 26.4 1,070 53.7 2,170 –10.5 –13.2Zambia 13.5 752.6 18 39 15.7 1,160 20.1 1,490 6.5 2.1Zimbabwe 12.8 390.8 33 39 8.4 660 .. .. 9.4 7.8<strong>World</strong> 6,974.2 s 134,269.2 s 54 w 52 w 66,354.3 t 9,514 w 80,624.2 t 11,560 w 2.7 w 1.6 wLow income 816.8 16,582.1 51 28 466.0 571 1,125.4 1,378 6.0 3.7Middle income 5,022.4 81,875.7 63 50 20,835.4 4,149 36,311.9 7,230 6.3 5.2Lower middle income 2,532.7 20,841.9 126 39 4,488.5 1,772 9,719.0 3,837 5.5 3.9Upper middle income 2,489.7 61,033.8 42 61 16,340.5 6,563 26,646.2 10,703 6.6 5.9Low & middle income 5,839.2 98,457.7 61 47 21,324.4 3,652 37,436.4 6,411 6.3 5.0East Asia & Pacific 1,974.2 16,301.7 125 49 8,387.3 4,248 14,344.6 7,266 8.3 7.6Europe & Central Asia 408.1 23,613.7 18 65 3,156.6 7,734 5,845.7 14,323 5.9 5.4Latin America & Carib. 589.0 20,393.6 29 79 5,050.3 8,574 6,822.0 11,582 4.7 3.6Middle East & N. Africa 336.5 8,775.4 39 59 1,279.5 3,866 2,619.2 8,052 0.2 2.4South Asia 1,656.5 5,131.1 347 31 2,174.5 1,313 5,523.5 3,335 6.1 4.6Sub- Saharan Africa 874.8 24,242.3 37 37 1,100.8 1,258 1,946.2 2,225 4.7 2.1High income 1,135.0 35,811.5 33 81 45,242.5 39,861 43,724.5 38,523 1.5 0.9Euro area 332.9 2,628.4 131 76 12,871.5 38,661 11,735.7 35,250 1.5 1.2a. Based on regression; others are extrapolated from the 2005 International Comparison Program benchmark estimates. b. Estimated to be upper middle income ($4,036–$12,475).c. Estimated to be high income ($12,476 or more). d. Included in the aggregates for upper middle-income economies based on earlier data. e. Greater than 0 but less than 50. f. Dataare for the area controlled by the government of Cyprus. g. Greater than 0 but less than 50,000. h. Excludes Abkhazia and South Ossetia. i. Refers to area free from ice. j. Greater than0 but less than 0.5. k. Estimated to be low income ($1,025 or less). l. Included in the aggregates for low-income economies based on earlier data. m. Excludes Transnistria. n. IncludesFormer Spanish Sahara. o. Included in the aggregates for high-income economies based on earlier data. p. Provisional estimate. q. Estimated to be lower middle income ($1,026–$4,035).r. Excludes South Sudan. s. Sum of available data (see Statistical methods). t. Missing data are imputed (see Statistical methods). u. Excludes South Sudan after July 9, 2011. v. Coversmainland Tanzania only. w. Weighted average (see Statistical methods).24 <strong>World</strong> <strong>Development</strong> <strong>Indicators</strong> <strong>2013</strong> Front ? User guide <strong>World</strong> view People Environment
<strong>World</strong> view 1About the dataPopulation, land area, income (as measured by gross nationalincome, GNI), and output (as measured by gross domestic product,GDP) are basic measures of the size of an economy. They also providea broad indication of actual and potential resources and aretherefore used throughout <strong>World</strong> <strong>Development</strong> <strong>Indicators</strong> to normalizeother indicators.area, which excludes bodies of water, and from gross area, whichmay include offshore territorial waters. Land area is particularlyimportant for understanding an economy’s agricultural capacity andthe environmental effects of human activity. Innovations in satellitemapping and computer databases have resulted in more precisemeasurements of land and water areas.PopulationPopulation estimates are usually based on national population censuses.Estimates for the years before and after the census areinterpolations or extrapolations based on demographic models.Errors and undercounting occur even in high-income countries; indeveloping countries errors may be substantial because of limitsin the transport, communications, and other resources required toconduct and analyze a full census.The quality and reliability of official demographic data are alsoaffected by public trust in the government, government commitmentto full and accurate enumeration, confidentiality and protectionagainst misuse of census data, and census agencies’independence from political influence. Moreover, comparability ofpopulation indicators is limited by differences in the concepts,definitions, collection procedures, and estimation methods usedby national statistical agencies and other organizations that collectthe data.Of the 214 economies in the table, 180 (about 86 percent) conducteda census during the 2000 census round (1995–2004). Asof January 2012, 141 countries have completed a census for the2010 census round (2005–14). The currentness of a census andthe availability of complementary data from surveys or registrationsystems are important indicators of demographic data quality. SeePrimary data documentation for the most recent census or surveyyear and for the completeness of registration. Some European countries’registration systems offer complete information on populationin the absence of a census.Current population estimates for developing countries thatlack recent census data and pre- and post-census estimates forcountries with census data are provided by the United NationsPopulation Division and other agencies. The cohort componentmethod—a standard method for estimating and projectingpopulation—requires fertility, mortality, and net migration data,often collected from sample surveys, which can be small or limitedin coverage. Population estimates are from demographic modelingand so are susceptible to biases and errors from shortcomings inthe model and in the data. Because the five-year age group is thecohort unit and five-year period data are used, interpolations toobtain annual data or single age structure may not reflect actualevents or age composition.Surface areaThe surface area of an economy includes inland bodies of waterand some coastal waterways. Surface area thus differs from landUrban populationThere is no consistent and universally accepted standard fordistinguishing urban from rural areas, in part because of thewide variety of situations across countries. Most countries usean urban classification related to the size or characteristicsof settlements. Some define urban areas based on the presenceof certain infrastructure and services. And other countriesdesignate urban areas based on administrative arrangements.Because the estimates in the table are based on national definitionsof what constitutes a city or metropolitan area, crosscountrycomparisons should be made with caution. To estimateurban populations, ratios of urban to total population obtainedfrom the United Nations were applied to the <strong>World</strong> Bank’s estimatesof total population.Size of the economyGNI measures total domestic and foreign value added claimed byresidents. GNI comprises GDP plus net receipts of primary income(compensation of employees and property income) from nonresidentsources. GDP is the sum of gross value added by all residentproducers in the economy plus any product taxes (less subsidies)not included in the valuation of output. GNI is calculated withoutdeducting for depreciation of fabricated assets or for depletion anddegradation of natural resources. Value added is the net output ofan industry after adding up all outputs and subtracting intermediateinputs. The industrial origin of value added is determined bythe International Standard Industrial Classification revision 3. The<strong>World</strong> Bank uses GNI per capita in U.S. dollars to classify countriesfor analytical purposes and to determine borrowing eligibility. Fordefinitions of the income groups in <strong>World</strong> <strong>Development</strong> <strong>Indicators</strong>,see User guide.When calculating GNI in U.S. dollars from GNI reported in nationalcurrencies, the <strong>World</strong> Bank follows the <strong>World</strong> Bank Atlas conversionmethod, using a three-year average of exchange rates to smooththe effects of transitory fluctuations in exchange rates. (For furtherdiscussion of the <strong>World</strong> Bank Atlas method, see Statisticalmethods.)Because exchange rates do not always reflect differences in pricelevels between countries, the table also converts GNI and GNI percapita estimates into international dollars using purchasing powerparity (PPP) rates. PPP rates provide a standard measure allowingcomparison of real levels of expenditure between countries, justas conventional price indexes allow comparison of real values overtime.Economy States and markets Global links Back<strong>World</strong> <strong>Development</strong> <strong>Indicators</strong> <strong>2013</strong> 25
1 <strong>World</strong> viewPPP rates are calculated by simultaneously comparing the pricesof similar goods and services among a large number of countries.In the most recent round of price surveys conducted by the InternationalComparison Program (ICP) in 2005, 146 countries and territoriesparticipated, including China for the first time, India for thefirst time since 1985, and almost all African countries. The PPPconversion factors presented in the table come from three sources.For 47 high- and upper middle-income countries conversion factorsare provided by Eurostat and the Organisation for EconomicCo-operation and <strong>Development</strong> (OECD); PPP estimates for thesecountries incorporate new price data collected since 2005. For theremaining 2005 ICP countries the PPP estimates are extrapolatedfrom the 2005 ICP benchmark results, which account for relativeprice changes between each economy and the United States. Forcountries that did not participate in the 2005 ICP round, the PPPestimates are imputed using a statistical model. More informationon the results of the 2005 ICP is available at www.worldbank.org/data/icp.Growth rates of GDP and GDP per capita are calculated using theleast squares method and constant price data in local currency.Constant price U.S. dollar series are used to calculate regional andincome group growth rates. The growth rates in the table are annualaverages. Methods of computing growth rates are described in Statisticalmethods.Definitions• Population is based on the de facto definition of population, whichcounts all residents regardless of legal status or citizenship—except for refugees not permanently settled in the country of asylum,who are generally considered part of the population of theircountry of origin. The values shown are midyear estimates. • Surfacearea is a country’s total area, including areas under inlandbodies of water and some coastal waterways. • Population densityis midyear population divided by land area. • Urban population isthe midyear population of areas defined as urban in each countryand reported to the United Nations. • Gross national income, Atlasmethod, is the sum of value added by all resident producers plusany product taxes (less subsidies) not included in the valuationof output plus net receipts of primary income (compensation ofemployees and property income) from abroad. Data are in currentU.S. dollars converted using the <strong>World</strong> Bank Atlas method (seeStatistical methods). • Gross national income, purchasing powerparity, is GNI converted to international dollars using PPP rates. Aninternational dollar has the same purchasing power over GNI thata U.S. dollar has in the United States. • Gross national incomeper capita is GNI divided by midyear population. • Gross domesticproduct is the sum of value added by all resident producers plusany product taxes (less subsidies) not included in the valuation ofoutput. Growth is calculated from constant price GDP data in localcurrency. • Gross domestic product per capita is GDP divided bymidyear population.Data sourcesThe <strong>World</strong> Bank’s population estimates are compiled and producedby its <strong>Development</strong> Data Group in consultation with its Human <strong>Development</strong>Network, operational staff, and country offices. The UnitedNations Population Division (2011) is a source of the demographicdata for more than half the countries, most of them developingcountries. Other important sources are census reports and otherstatistical publications from national statistical offices; householdsurveys by national agencies, ICF International (for MEASURE DHS),and the U.S. Centers for Disease Control and Prevention; Eurostat’sDemographic Statistics; the Secretariat of the Pacific Community’sStatistics and Demography Programme; and the U.S. Bureau of theCensus’s International Data Base.Data on surface and land area are from the Food and AgricultureOrganization, which gathers these data from national agenciesthrough annual questionnaires and by analyzing the results ofnational agricultural censuses.Data on urban population shares are from United Nations PopulationDivision (2010).GNI, GNI per capita, GDP growth, and GDP per capita growth areestimated by <strong>World</strong> Bank staff based on national accounts data collectedby <strong>World</strong> Bank staff during economic missions or reported bynational statistical offices to other international organizations suchas the OECD. PPP conversion factors are estimates by Eurostat/OECD and by <strong>World</strong> Bank staff based on data collected by the ICP.ReferencesEurostat (Statistical Office of the European Communities). n.d. DemographicStatistics. http://epp.eurostat.ec.europa.eu/portal/page/portal/eurostat/home/. Luxembourg.ICF International. Various years. Demographic and Health Surveys.http://www.measuredhs.com. Calverton, MD.OECD (Organisation for Economic Co-operation and <strong>Development</strong>). n.d.OECD.StatExtracts database. http://stats.oecd.org/. Paris.UNAIDS (Joint United Nations Programme on HIV/AIDS). 2012. GlobalReport: UNAIDS Report on the Global AIDS Epidemic 2012. www.unaids.org/en/resources/publications/2012/. Geneva.United Nations Inter-Agency Group for Child Mortality Estimation.2012. Levels and Trends in Child Mortality: Report 2012. www.childinfo.org/files/Child_Mortality_Report_2012.pdf. New York.United Nations. 2012. The Millennium <strong>Development</strong> Goals Report2012. New York.United Nations Population Division. 2010. <strong>World</strong> Urbanization Prospects:The 2009 Revision. New York: United Nations, Department ofEconomic and Social Affairs.———. 2011. <strong>World</strong> Population Prospects: The 2010 Revision. NewYork: United Nations, Department of Economic and Social Affairs.<strong>World</strong> Bank. 2011. The Changing Wealth of Nations: Measuring Sustainable<strong>Development</strong> for the New Millennium. Washington, DC.———. n.d. PovcalNet online database. http://iresearch.worldbank.org/PovcalNet/index.htm?26 <strong>World</strong> <strong>Development</strong> <strong>Indicators</strong> <strong>2013</strong> Front User guide <strong>World</strong> view People Environment
<strong>World</strong> view 1About Online the tables datand indicatorsTo access the <strong>World</strong> <strong>Development</strong> <strong>Indicators</strong> online tables, usethe URL http://wdi.worldbank.org/table/ and the table number (forexample, http://wdi.worldbank.org/table/1.1). To view a specificindicator online, use the URL http://data.worldbank.org/indicator/and the indicator code (for example, http://data.worldbank.org/indicator/SP.POP.TOTL).1.1 Size of the economyPopulationSurface areaPopulation densityGross national income, Atlas methodGross national income per capita, AtlasmethodPurchasing power parity gross nationalincomePurchasing power parity gross nationalincome, Per capitaGross domestic productGross domestic product, Per capitaSP.POP.TOTLAG.SRF.TOTL.K2EN.POP.DNSTNY.GNP.ATLS.CDNY.GNP.PCAP.CDNY.GNP.MKTP.PP.CDNY.GNP.PCAP.PP.CDNY.GDP.MKTP.KD.ZGNY.GDP.PCAP.KD.ZG1.2 Millennium <strong>Development</strong> Goals: eradicating povertyand saving livesShare of poorest quintile in nationalconsumption or incomeVulnerable employmentPrevalence of malnutrition, UnderweightPrimary completion rateRatio of girls to boys enrollments in primaryand secondary educationUnder-five mortality rateSI.DST.FRST.20SL.EMP.VULN.ZSSH.STA.MALN.ZSSE.PRM.CMPT.ZSSE.ENR.PRSC.FM.ZS1.3 Millennium <strong>Development</strong> Goals: protecting ourcommon environmentMaternal mortality ratio, Modeled estimateContraceptive prevalence rateHIV prevalenceIncidence of tuberculosisSH.DYN.MORTSH.STA.MMRTSP.DYN.CONU.ZSSH.DYN.AIDS.ZSSH.TBS.INCDCarbon dioxide emissions per capitaNationally protected terrestrial and marineareasAccess to improved sanitation facilitiesIndividuals using the InternetEN.ATM.CO2E.PCER.PTD.TOTL.ZSSH.STA.ACSN1.4 Millennium <strong>Development</strong> Goals: overcoming obstaclesThis table provides data on net officialdevelopment assistance by donor, leastdeveloped countries’ access to high-incomemarkets, and the Debt Initiative for HeavilyIndebted Poor Countries.1.5 Women in developmentFemale populationLife expectancy at birth, MaleLife expectancy at birth, FemalePregnant women receiving prenatal careTeenage mothersWomen in wage employment innonagricultural sectorUnpaid family workers, MaleUnpaid family workers, FemaleFemale part-time employmentFemale legislators, senior officials, andmanagersWomen in parliamentsFemale-headed households.. a.. aSP.POP.TOTL.FE.ZSSP.DYN.LE00.MA.INSP.DYN.LE00.FE.INSH.STA.ANVC.ZSSP.MTR.1519.ZSSL.EMP.INSV.FE.ZSSL.FAM.WORK.MA.ZSSL.FAM.WORK.FE.ZSSL.TLF.PART.TL.FE.ZSSG.GEN.LSOM.ZSSG.GEN.PARL.ZSSP.HOU.FEMA.ZSData disaggregated by sex are available inthe <strong>World</strong> <strong>Development</strong> <strong>Indicators</strong> database.a. Available online only as part of the table, not as an individual indicator.Economy States and markets Global links Back<strong>World</strong> <strong>Development</strong> <strong>Indicators</strong> <strong>2013</strong> 27
Poverty ratesInternational povertyline in local currencyPopulation below international poverty lines a$1.25 a day $2 a day2005 2005Surveyyear bPopulationbelow$1.25 a day%Poverty gapat $1.25a day%Populationbelow$2 a day%Povertygap at$2 a day%Surveyyear bPopulationbelow$1.25 a day%Poverty gapat $1.25a day%Populationbelow$2 a day%Albania 75.5 120.8 2005
Poverty ratesInternational povertyline in local currencyPopulation below international poverty lines a$1.25 a day $2 a day2005 2005Surveyyear bPopulationbelow$1.25 a day%Poverty gapat $1.25a day%Populationbelow$2 a day%Povertygap at$2 a day%Surveyyear bPopulationbelow$1.25 a day%Poverty gapat $1.25a day%Populationbelow$2 a day%Guinea-Bissau 355.3 568.6 1993 52.1 20.6 75.7 37.4 2002 48.9 16.6 78.0 34.9Guyana 131.5 c 210.3 c 1993 e 6.9 1.5 17.1 5.4 1998 e 8.7 2.8 18.0 6.7Haiti 24.2 c 38.7 c .. .. .. .. 2001 61.7 32.3 77.5 46.7Honduras 12.1 c 19.3 c 2008 f 21.4 11.8 32.6 17.5 2009 f 17.9 9.4 29.8 14.9Hungary 171.9 275.0 2004
Poverty ratesInternational povertyline in local currencyPopulation below international poverty lines a$1.25 a day $2 a day2005 2005Surveyyear bPopulationbelow$1.25 a day%Poverty gapat $1.25a day%Populationbelow$2 a day%Povertygap at$2 a day%Surveyyear bPopulationbelow$1.25 a day%Poverty gapat $1.25a day%Populationbelow$2 a day%São Tomé and Príncipe 7,953.9 12,726.3 .. .. .. .. 2001 28.2 7.9 54.2 20.6Senegal 372.8 596.5 2005 33.5 10.8 60.4 24.7 2011 29.6 9.1 55.2 21.9Serbia 42.9 68.6 2009
Poverty ratesTrends in poverty indicators by region, 1990–2015Region 1990 1993 1996 1999 2002 2005 2008 2010 provisional 2015 projection Trend, 1990–2010Share of population living on less than 2005 PPP $1.25 a day (%)East Asia & Pacific 56.2 50.7 35.9 35.6 27.6 17.1 14.3 12.5 5.5Europe & Central Asia 1.9 2.9 3.9 3.8 2.3 1.3 0.5 0.7 0.4Latin America & Caribbean 12.2 11.4 11.1 11.9 11.9 8.7 6.5 5.5 4.9Middle East & North Africa 5.8 4.8 4.8 5.0 4.2 3.5 2.7 2.4 2.6South Asia 53.8 51.7 48.6 45.1 44.3 39.4 36.0 31.0 23.2Sub- Saharan Africa 56.5 59.4 58.1 57.9 55.7 52.3 49.2 48.5 42.3Total 43.1 41.0 34.8 34.1 30.8 25.1 22.7 20.6 15.5People living on less than 2005 PPP $1.25 a day (millions)East Asia & Pacific 926 871 640 656 523 332 284 251 115Europe & Central Asia 9 14 18 18 11 6 2 3 2Latin America & Caribbean 53 53 54 60 63 48 37 32 30Middle East & North Africa 13 12 12 14 12 10 9 8 9South Asia 617 632 631 619 640 598 571 507 406Sub- Saharan Africa 290 330 349 376 390 395 399 414 408Total 1,908 1,910 1,704 1,743 1,639 1,389 1,302 1,215 970Regional distribution of people living on less than $1.25 a day (% of total population living on less than $1.25 a day)East Asia & Pacific 48.5 45.6 37.6 37.6 31.9 23.9 21.8 20.7 11.8Europe & Central Asia 0.5 0.7 1.1 1.0 0.6 0.5 0.2 0.3 0.2Latin America & Caribbean 2.8 2.7 3.1 3.4 3.8 3.4 2.9 2.7 3.1Middle East & North Africa 0.7 0.6 0.7 0.8 0.7 0.8 0.7 0.7 1.0South Asia 32.3 33.1 37.0 35.5 39.1 43.1 43.8 41.7 41.9Sub- Saharan Africa 15.2 17.3 20.5 21.6 23.8 28.4 30.7 34.1 42.1Average daily consumption or income of people living on less than 2005 PPP $1.25 a day (2005 PPP $)East Asia & Pacific 0.83 0.85 0.89 0.87 0.89 0.95 0.95 0.97 ..Europe & Central Asia 0.90 0.90 0.91 0.92 0.93 0.88 0.88 0.85 ..Latin America & Caribbean 0.71 0.69 0.68 0.67 0.65 0.63 0.62 0.60 ..Middle East & North Africa 1.02 1.02 1.01 1.01 1.01 0.99 0.97 0.96 ..South Asia 0.88 0.89 0.91 0.91 0.92 0.94 0.95 0.96 ..Sub- Saharan Africa 0.69 0.68 0.69 0.69 0.70 0.71 0.71 0.71 ..Total 0.82 0.83 0.85 0.84 0.85 0.87 0.87 0.87 ..Survey coverage (% of total population represented by underlying survey data)East Asia & Pacific 92.4 93.3 93.7 93.4 93.5 93.2 93.6 93.5 ..Europe & Central Asia 81.5 87.3 97.1 93.9 96.3 94.7 89.9 85.3 ..Latin America & Caribbean 94.9 91.8 95.9 97.7 97.5 95.9 94.5 86.9 ..Middle East & North Africa 76.8 65.3 81.7 70.0 21.5 85.7 46.7 30.8 ..South Asia 96.5 98.2 98.1 20.1 98.0 98.0 97.9 94.5 ..Sub- Saharan Africa 46.0 68.8 68.0 53.1 65.7 82.7 81.7 64.1 ..Total 86.4 89.4 91.6 68.2 87.8 93.0 90.2 84.7 ..Source: <strong>World</strong> Bank PovcalNet.Economy States and markets Global links Back<strong>World</strong> <strong>Development</strong> <strong>Indicators</strong> <strong>2013</strong> 31
Poverty ratesAbout the dataThe <strong>World</strong> Bank produced its first global poverty estimates fordeveloping countries for <strong>World</strong> <strong>Development</strong> Report 1990: Poverty(<strong>World</strong> Bank 1990) using household survey data for 22 countries(Ravallion, Datt, and van de Walle 1991). Since then therehas been considerable expansion in the number of countriesthat field household income and expenditure surveys. The <strong>World</strong>Bank’s <strong>Development</strong> Research Group maintains a database thatis updated regularly as new survey data become available (andthus may contain more recent data or revisions that are not incorporatedinto the table) and conducts a major reassessment ofprogress against poverty about every three years.This year the database has been updated with global and regionalextreme poverty estimates for 2010, which are provisional due tolow coverage in household survey data availability for recent years(2008–12). The projections to 2015 of poverty rates use the 2010provisional estimates as a baseline and assume that average householdincome or consumption will grow in line with the aggregate economicprojections reported in this year’s Global Monitoring Report(<strong>World</strong> Bank <strong>2013</strong>) but that inequality within countries will remainunchanged. This methodology was first used and described in theGlobal Economic Prospects report (<strong>World</strong> Bank 2000). Estimates ofthe number of people living in extreme poverty are based on populationprojections in the <strong>World</strong> Bank’s HealthStats database (http://datatopics.worldbank.org/hnp).PovcalNet (http://iresearch.worldbank.org/PovcalNet) is aninteractive computational tool that allows users to replicate theseinternationally comparable $1.25 and $2 a day global, regional andcountry-level poverty estimates and to compute poverty measuresfor custom country groupings and for different poverty lines. ThePoverty and Equity Data portal (http://povertydata.worldbank.org/poverty/home) provides access to the database and user-friendlydashboards with graphs and interactive maps that visualize trends inkey poverty and inequality indicators for different regions and countries.The country dashboards display trends in poverty measuresbased on the national poverty lines (see online table 2.7) alongsidethe internationally comparable estimates in the table, producedfrom and consistent with PovcalNet.Data availabilityThe <strong>World</strong> Bank’s internationally comparable poverty monitoringdatabase now draws on income or detailed consumption datacollected from interviews with 1.23 million randomly sampledhouseholds through more than 850 household surveys collectedby national statistical offices in nearly 130 countries. Despite progressin the last decade, the challenges of measuring poverty remain.The timeliness, frequency, quality, and comparability of householdsurveys need to increase substantially, particularly in the poorestcountries. The availability and quality of poverty monitoring dataremain low in small states, fragile situations, and low-income countriesand even some middle-income countries.The low frequency and lack of comparability of the data availablein some countries create uncertainty over the magnitude of povertyreduction. The table on trends in poverty indicators reports thepercentage of the regional and global population represented byhousehold survey samples collected during the reference year orduring the two preceding or two subsequent years (in other words,within a five-year window centered on the reference year). Data coveragein Sub- Saharan Africa and the Middle East and North Africaremains low and variable. The need to improve household surveyprograms for monitoring poverty is clearly urgent. But institutional,political, and financial obstacles continue to limit data collection,analysis, and public access.Data qualityBesides the frequency and timeliness of survey data, other dataquality issues arise in measuring household living standards. Thesurveys ask detailed questions on sources of income and how itwas spent, which must be carefully recorded by trained personnel.Income is generally more difficult to measure accurately, and consumptioncomes closer to the notion of living standards. And incomecan vary over time even if living standards do not. But consumptiondata are not always available: the latest estimates reported hereuse consumption for about two-thirds of countries.However, even similar surveys may not be strictly comparablebecause of differences in timing, sampling frames, or the qualityand training of enumerators. Comparisons of countries at differentlevels of development also pose a potential problem because of differencesin the relative importance of the consumption of nonmarketgoods. The local market value of all consumption in kind (includingown production, particularly important in underdeveloped ruraleconomies) should be included in total consumption expenditure, butmay not be. Most survey data now include valuations for consumptionor income from own production, but valuation methods vary.The statistics reported here are based on consumption data or,when unavailable, on income data. Analysis of some 20 countriesfor which both were available from the same surveys found incometo yield a higher mean than consumption but also higher inequality.When poverty measures based on consumption and income werecompared, the two effects roughly cancelled each other out: therewas no significant statistical difference.Invariably some sampled households do not participate insurveys because they refuse to do so or because nobody isat home during the interview visit. This is referred to as “unitnonresponse” and is distinct from “item nonresponse,” whichoccurs when some of the sampled respondents participate butrefuse to answer certain questions, such as those pertaining toincome or consumption. To the extent that survey nonresponseis random, there is no concern regarding biases in survey-basedinferences; the sample will still be representative of the population.However, households with different income might not beequally likely to respond. Richer households may be less likely?32 <strong>World</strong> <strong>Development</strong> <strong>Indicators</strong> <strong>2013</strong> Front User guide <strong>World</strong> view People Environment
Poverty ratesto participate because of the high opportunity cost of their timeor concerns about intrusion in their affairs. It is conceivable thatthe poorest can likewise be underrepresented; some are homelessor nomadic and hard to reach in standard household surveydesigns, and some may be physically or socially isolated andthus less likely to be interviewed. This can bias both poverty andinequality measurement if not corrected for (Korinek, Mistiaen,and Ravallion 2007).International poverty linesInternational comparisons of poverty estimates entail both conceptualand practical problems. Countries have different definitions ofpoverty, and consistent comparisons across countries can be difficult.Local poverty lines tend to have higher purchasing power in richcountries, where more generous standards are used, than in poorcountries. Poverty measures based on an international poverty lineattempt to hold the real value of the poverty line constant acrosscountries, as is done when making comparisons over time. Since<strong>World</strong> <strong>Development</strong> Report 1990 the <strong>World</strong> Bank has aimed to applya common standard in measuring extreme poverty, anchored to whatpoverty means in the world’s poorest countries. The welfare of peopleliving in different countries can be measured on a common scale byadjusting for differences in the purchasing power of currencies. Thecommonly used $1 a day standard, measured in 1985 internationalprices and adjusted to local currency using purchasing power parities(PPPs), was chosen for <strong>World</strong> <strong>Development</strong> Report 1990 because itwas typical of the poverty lines in low-income countries at the time.Early editions of <strong>World</strong> <strong>Development</strong> <strong>Indicators</strong> used PPPs from thePenn <strong>World</strong> Tables to convert values in local currency to equivalentpurchasing power measured in U.S dollars. Later editions used 1993consumption PPP estimates produced by the <strong>World</strong> Bank.International poverty lines were recently revised using the newdata on PPPs compiled in the 2005 round of the International ComparisonProgram, along with data from an expanded set of householdincome and expenditure surveys. The new extreme povertyline is set at $1.25 a day in 2005 PPP terms, which represents themean of the poverty lines found in the poorest 15 countries rankedby per capita consumption. The new poverty line maintains the samestandard for extreme poverty—the poverty line typical of the poorestcountries in the world—but updates it using the latest informationon the cost of living in developing countries. PPP exchange rates areused to estimate global poverty because they take into account thelocal prices of goods and services not traded internationally. ButPPP rates were designed for comparing aggregates from nationalaccounts, not for making international poverty comparisons. As aresult, there is no certainty that an international poverty line measuresthe same degree of need or deprivation across countries.So-called poverty PPPs, designed to compare the consumption ofthe poorest people in the world, might provide a better basis forcomparison of poverty across countries. Work on these measuresis ongoing.Definitions• International poverty line in local currency is the internationalpoverty lines of $1.25 and $2.00 a day in 2005 prices, convertedto local currency using the PPP conversion factors estimated bythe International Comparison Program. • Survey year is the year inwhich the underlying data were collected or, when the data collectionperiod bridged two calendar years, the year in which most of the datawere collected. • Population below $1.25 a day and populationbelow $2 a day are the percentages of the population living on lessthan $1.25 a day and $2 a day at 2005 international prices. As aresult of revisions in PPP exchange rates, consumer price indexes,or welfare aggregates, poverty rates for individual countries cannotbe compared with poverty rates reported in earlier editions. ThePovcalNet online database and tool always contain the most recentfull time series of comparable country data. • Poverty gap is themean shortfall from the poverty line (counting the nonpoor as havingzero shortfall), expressed as a percentage of the poverty line.This measure reflects the depth of poverty as well as its incidence.Data sourcesThe poverty measures are prepared by the <strong>World</strong> Bank’s <strong>Development</strong>Research Group. The international poverty lines are based onnationally representative primary household surveys conducted bynational statistical offices or by private agencies under the supervisionof government or international agencies and obtained fromgovernment statistical offices and <strong>World</strong> Bank Group country departments.For details on data sources and methods used in derivingthe <strong>World</strong> Bank’s latest estimates, see http://iresearch.worldbank.org/PovcalNet/index.htm.ReferencesChen, Shaohua, and Martin Ravallion. 2011. “The Developing <strong>World</strong> IsPoorer Than We Thought, But No Less Successful in the Fight AgainstPoverty.” Quarterly Journal of Economics 125(4): 1577–1625.Korinek, Anton, Johan A. Mistiaen, and Martin Ravallion. 2007. “AnEconometric Method of Correcting for Unit Nonresponse Bias inSurveys.” Journal of Econometrics 136: 213–35.Ravallion, Martin, Guarav Datt, and Dominique van de Walle. 1991.“Quantifying Absolute Poverty in the Developing <strong>World</strong>.” Review ofIncome and Wealth 37(4): 345–61.Ravallion, Martin, Shaohua Chen, and Prem Sangraula. 2009. “Dollara Day Revisited.” <strong>World</strong> Bank Economic Review 23(2): 163–84.<strong>World</strong> Bank. 1990. <strong>World</strong> <strong>Development</strong> Report 1990: Poverty. Washington,DC.———. 2000. Global Economic Prospects and the Developing Countries.Washington, DC.———. 2008. Poverty Data: A Supplement to <strong>World</strong> <strong>Development</strong> <strong>Indicators</strong>2008. Washington, DC.———. <strong>2013</strong>. Global Monitoring Report: Rural-Urban Dynamics andthe Millennium <strong>Development</strong> Goals. Washington, DC.Economy States and markets Global links Back<strong>World</strong> <strong>Development</strong> <strong>Indicators</strong> <strong>2013</strong> 33
PEOPLE34 <strong>World</strong> <strong>Development</strong> <strong>Indicators</strong> <strong>2013</strong> Front ? User guide <strong>World</strong> view People Environment
The indicators in the People section presentdemographic trends and forecasts alongsideindicators of education, health, jobs, social protection,poverty, and the distribution of income.Together they provide a multidimensional portraitof human development.Data updates in this edition include provisionalestimates of global and regional extremepoverty rates for 2010—measured as the proportionof the population living on less than $1.25a day. The availability, frequency, and quality ofpoverty monitoring data remain low, especially insmall states and in countries and territories withfragile situations. While estimates may changemarginally as additional country data becomeavailable, it is now clear that the first Millennium<strong>Development</strong> Goal target—cutting the globalextreme poverty rate to half its 1990 level—wasachieved before the 2015 target date. In 1990,the benchmark year for the Millennium <strong>Development</strong>Goals, the extreme poverty rate was43.1 percent. Estimates for 2010 show that theextreme poverty rate had fallen to 20.6 percent.In addition to extreme poverty rates, the Peoplesection includes many other indicators usedto monitor the Millennium <strong>Development</strong> Goals.Following the adoption of the Millennium Declarationby the United Nations General Assembly in2000, various international agencies includingthe <strong>World</strong> Bank resolved to invest in using highqualityharmonized data to monitor the Millennium<strong>Development</strong> Goals. These efforts rangefrom providing technical and financial assistanceto strengthen country statistical systemsto fostering international collaboration throughparticipation in the United Nations Inter-Agencyand Expert Group on the Millennium <strong>Development</strong>Goal <strong>Indicators</strong> and several thematicinter-agency groups. These forums bring togetheragency subject matter specialists with leadingacademic and local experts. Successful thematicinter-agency efforts have improved estimateson child mortality, child malnutrition, aswell as maternal mortality, one of the most challengingindicators to measure.For <strong>2013</strong> the People section includes improvedchild malnutrition indicators produced bythe United Nations Children’s Fund, the <strong>World</strong>Health Organization, and the <strong>World</strong> Bank usinga harmonized dataset and the same statisticalmethodology to estimate global, regional, andincome group aggregates.Another result is the improvement in monitoringHIV prevalence. Initial efforts relied solely oncountry surveillance systems that collected datafrom pregnant women who attended sentinelantenatal clinics. Now the methodology measuringthis indicator uses all available information—including blood test data collected throughnationally representative sample surveys—andthe models account for the effects of anti retroviraltherapy and urbanization (see About thedata for online table 2.20).In addition to providing insights into differencesbetween countries and between groups ofcountries, the People section includes indicatorsdisaggregated by location and by socioeconomicand demographic strata within countries, suchas gender, age, and wealth quintile. These dataprovide a deeper perspective on the disparitieswithin countries. New indicators for <strong>2013</strong> includesex-disaggregated data on the under-five mortalityrate, sex-disaggregated youth labor force participationrates, and numerous indicators fromthe <strong>World</strong> Bank’s Atlas of Social Protection <strong>Indicators</strong>of Resilience and Equity database.2Economy States and markets Global links Back<strong>World</strong> <strong>Development</strong> <strong>Indicators</strong> <strong>2013</strong> 35
HighlightsEast Asia & Pacific: Narrowing gaps in access to improved sanitation facilities and water sourcesShare of population with access (%)To improved sanitation facilities To improved water sources1007550250713786561990 2010DevelopingcountriesSource: Online table 2.16.683090661990 2010East Asia& Pacific712290381990 2010SouthAsia482661311990 2010Sub-SaharanAfricaDuring the past 20 years the share of the developing world’s populationwith access to improved sanitation facilities and water sources hasrisen substantially. East Asia and Pacific has made above-averageprogress on improving both and narrowing the gap between them,driven by a rapid expansion in access to improved sanitation from30 percent in 1990 to 66 percent in 2010. In South Asia progress onaccess to an improved water source was almost on par with East Asiaand Pacific, but access to improved sanitation facilities remains verylow. Indeed, the region fares only marginally better than Sub- SaharanAfrica, which progressed substantially slower over the past twodecades. But both regions made progress on expanding the share ofthe population with access to an improved water source.Europe & Central Asia: Variation in prevalence of underweight childrenPrevalence of child malnutrition, underweight,most recent year, 2005–11 (% of children under age 5)2520151050GeorgiaBulgariaMoldovaArmeniaSource: Online table 2.18.AlbaniaTajikistanEurope &Central AsiaLatin America& CaribbeanEast Asia& PacificMiddle East &North AfricaSub-SaharanAfricaMalnourishment in children has been linked to poverty, low levels ofeducation, and poor access to health services. It increases the risk ofdeath, inhibits cognitive development, and can adversely affect healthstatus during adulthood. Adequate nutrition is a cornerstone for development,health, and the survival of current and future generations.Europe and Central Asia has the lowest prevalence (1.5 percent) ofunderweight children among developing regions, but there is substantialvariation across countries. At 3.2 percent, prevalence in Moldovais more like that in Latin America and the Caribbean countries; at5.3 percent, prevalence in Armenia is more like that in East Asia andPacific countries; and at 6.3 percent, prevalence in Albania is morelike that in Middle East and North African countries. Tajikistan, a lowincomecountry, at 15 percent has the highest proportion of underweightchildren in the region.Latin America & Caribbean: Income inequality falling but remains among the world’s highestGini coefficient, most recent value, 2000–1165554535Latin America & Caribbean countriesOther upper middle income countriesOther countriesInequalityunchangedInequalityincreasedInequalitydecreased2525 35 45 55 65Gini coefficient (most recent value, 1990–99)The Gini coefficient, a common indicator of income inequality, measureshow much the per capita income distribution within a countrydeviates from perfect equality. (A Gini coefficient of 0 representsperfect equality, and a value of 100 perfect inequality.) Trends indeveloping countries over the past two decades suggest that manycountries have become less unequal, but trends differ by region andby income. Inequality in Latin America and the Caribbean fell notablyin almost all upper middle-income countries but remains among thehighest worldwide. The Gini coefficient is higher than the LatinAmerica and the Caribbean average in only two other upper middleincomecountries and in only a few low- and lower middle- incomecountries.Source: Online table 2.9 and <strong>World</strong> Bank PovcalNet.36 <strong>World</strong> <strong>Development</strong> <strong>Indicators</strong> <strong>2013</strong>Front ? User guide <strong>World</strong> view People Environment
Middle East & North Africa: Many educated women are not participating in the labor forceMore than 70 percent of girls in the Middle East and North Africaattend secondary school (higher than most developing countries), butlabor force participation rates have stagnated at around 20 percentsince 1990 (lower than most developing countries). Eight of the tencountries with the largest gap between their labor force participationrate and secondary enrollment ratio are in the Middle East and NorthAfrica. (Costa Rica and Sri Lanka are the only countries in the top 10not from the region.) Morocco and the Republic of Yemen have thesmallest gap, but they also have the lowest secondary enrollment ratio.In addition to whether women participate in economic activities, whereand in what condition women work are also important. The region alsohas the largest gender gap in the share of vulnerable employment (seeonline table 2.4).1007550250Gross secondary enrollment ratio for girls (% of relevant age group)Labor force participation rate for women (% of women ages 15and older)Algeria,2009Tunisia,2009Jordan,2010Lebanon,2011Iran, IslamicRep., 2011Egypt, ArabRep., 2010Morocco,2007Yemen, Rep.,2011Middle East &North Africa,2011Developingcountries,2011Source: Online tables 2.2 and 2.11.South Asia: In India more girls than boys die before their fifth birthdayThe ratio of girls’ to boys’ under-five mortality rate varies acrossdeveloping countries, but on average it is 0.96. East Asia and Pacifichas the largest variation among developing regions. At one extremeis Palau, where mortality rates for boys are two-thirds higher thanthat for girls. Biologically, boys are more vulnerable than girls, sounder-five mortality rates are usually higher for boys than girls. Thisbiological advantage can be reversed, however, by socioeconomicfactors such as gender inequalities in nutrition and medical care ordiscrimination against girls. India and the Solomon Islands are theonly developing countries where more girls than boys die before theirfifth birthday. In India under-five mortality rates for girls and boys haveimproved, but the ratio of girls’ to boys’ under-five deaths has stayedat around 1.1 since 1990.Ratio of girls’ to boys’ under-five mortality rate, 2011Lowest in region Highest in regionEast Asia& PacificEurope &Central AsiaLatin America& CaribbeanMiddle East &North AfricaSouthAsiaSub-SaharanAfricaPalau 0.59Belarus 0.73Jamaica 0.75Tunisia 0.85Sri Lanka 0.81Eritrea 0.830.92 Azerbaijan0.93 Grenada0.50 0.75 1.00(parity)Source: Online table 2.21.1.06 Solomon Islands0.96 Iran, Islamic Rep.1.09 India0.98 South Sudan1.25Sub- Saharan Africa: Different demographic transition paths at varying speedsToday, one of every nine children in Sub- Saharan Africa dies beforetheir fifth birthday, and fertility rates there remain higher than anywhereelse in the developing world. Sub- Saharan countries progressedover the past four decades, but they are moving along differentpaths at varying speeds. Gabon, ahead of the curve, had theunder-five mortality and total fertility rates in 1980 that the regionhas today. Niger made little progress between 1970 and 1990 buthas since seen rapid improvements in its under-five mortality rateand a marginal decline in its fertility rate. In 1970 Côte d’Ivoire hadan average mortality rate but a high fertility rate. Its mortality ratedeclined quickly until 1980, thereafter its fertility rate declined rapidlyand overtook the region by 2010. Mali, which had the highestunder-five mortality rate in 1970, took until 2010 to reach the ratethe region passed in 1990.Under-five mortality rate (per 1,000 live births)400300200100Côte d’Ivoire GabonMaliNigerSub-Saharan Africa2010201020101980197019702010197019801990197003 4 5 6 7 8 9Total fertility rate (births per woman)Source: Online table 2.21.2010Economy States and markets Global links Back<strong>World</strong> <strong>Development</strong> <strong>Indicators</strong> <strong>2013</strong> 37
2 PeoplePrevalenceof childmalnutrition,underweight% of childrenunder age 5Under-fivemortalityrateper 1,000live birthsMaternalmortalityratioModeledestimateper 100,000live birthsAdolescentfertilityratebirths per1,000women ages15–19Prevalenceof HIV% ofpopulationages 15–49Primarycompletionrate% of relevantage groupYouthliteracyrate% ages15–24Labor forceparticipationrate% ages 15and olderVulnerable UnemploymentemploymentUnpaid familyworkers andown-accountworkers% of totalemployment% of totallabor forceFemalelegislators,seniorofficials, andmanagers% of total2005–11 a 2011 2010 2011 2011 2011 2005–11 a 2011 2007–11 a 2007–11 a 2007–11 aAfghanistan .. 101 460 103
People 2Prevalenceof childmalnutrition,underweight% of childrenunder age 5Under-fivemortalityrateper 1,000live birthsMaternalmortalityratioModeledestimateper 100,000live birthsAdolescentfertilityratebirths per1,000women ages15–19Prevalenceof HIV% ofpopulationages 15–49Primarycompletionrate% of relevantage groupYouthliteracyrate% ages15–24Labor forceparticipationrate% ages 15and olderVulnerable UnemploymentemploymentUnpaid familyworkers andown-accountworkers% of totalemployment% of totallabor forceFemalelegislators,seniorofficials, andmanagers% of total2005–11 a 2011 2010 2011 2011 2011 2005–11 a 2011 2007–11 a 2007–11 a 2007–11 aCosta Rica 1.1 10 40 63 0.3 99 98 63 20 7.7 35Côte d’Ivoire 29.4 115 400 110 3.0 59 67 67 .. .. ..Croatia .. 5 17 13
2 PeoplePrevalenceof childmalnutrition,underweight% of childrenunder age 5Under-fivemortalityrateper 1,000live birthsMaternalmortalityratioModeledestimateper 100,000live birthsAdolescentfertilityratebirths per1,000women ages15–19Prevalenceof HIV% ofpopulationages 15–49Primarycompletionrate% of relevantage groupYouthliteracyrate% ages15–24Labor forceparticipationrate% ages 15and olderVulnerable UnemploymentemploymentUnpaid familyworkers andown-accountworkers% of totalemployment% of totallabor forceFemalelegislators,seniorofficials, andmanagers% of total2005–11 a 2011 2010 2011 2011 2011 2005–11 a 2011 2007–11 a 2007–11 a 2007–11 aItaly .. 4 4 5 0.4 .. 100 48 18 8.4 25Jamaica 1.9 18 110 71 1.8 .. 95 64 37 12.7 ..Japan .. 3 5 6
People 2Prevalenceof childmalnutrition,underweight% of childrenunder age 5Under-fivemortalityrateper 1,000live birthsMaternalmortalityratioModeledestimateper 100,000live birthsAdolescentfertilityratebirths per1,000women ages15–19Prevalenceof HIV% ofpopulationages 15–49Primarycompletionrate% of relevantage groupYouthliteracyrate% ages15–24Labor forceparticipationrate% ages 15and olderVulnerable UnemploymentemploymentUnpaid familyworkers andown-accountworkers% of totalemployment% of totallabor forceFemalelegislators,seniorofficials, andmanagers% of total2005–11 a 2011 2010 2011 2011 2011 2005–11 a 2011 2007–11 a 2007–11 a 2007–11 aNigeria 26.7 124 630 113 3.7 .. 72 56 .. .. ..Northern Mariana Islands .. .. .. .. .. .. .. .. .. .. ..Norway .. 3 7 8 0.2 .. .. 66 5 3.3 31Oman 8.6 9 32 9 .. 107 98 61 .. .. ..Pakistan 30.9 72 260 29
2 PeoplePrevalenceof childmalnutrition,underweight% of childrenunder age 5Under-fivemortalityrateper 1,000live birthsMaternalmortalityratioModeledestimateper 100,000live birthsAdolescentfertilityratebirths per1,000women ages15–19Prevalenceof HIV% ofpopulationages 15–49Primarycompletionrate% of relevantage groupYouthliteracyrate% ages15–24Labor forceparticipationrate% ages 15and olderVulnerable UnemploymentemploymentUnpaid familyworkers andown-accountworkers% of totalemployment% of totallabor forceFemalelegislators,seniorofficials, andmanagers% of total2005–11 a 2011 2010 2011 2011 2011 2005–11 a 2011 2007–11 a 2007–11 a 2007–11 aTanzania 16.2 68 460 129 5.8 81 b 77 89 .. .. ..Thailand 7.0 12 48 38 1.2 .. 98 72 54 0.7 25Timor-Leste 45.3 54 300 55 .. 72 80 57 70 3.6 ..Togo 20.5 110 300 57 3.4 77 82 81 .. .. ..Tonga .. 15 110 19 .. .. 99 64 .. .. ..Trinidad and Tobago .. 28 46 32 1.5 .. 100 66 .. 4.6 ..Tunisia 3.3 16 56 5
People 2About the dataThough not included in the table due to space limitations, manyindicators in this section are available disaggregated by sex, placeof residence, wealth, and age in the <strong>World</strong> <strong>Development</strong> <strong>Indicators</strong>database.Child malnutritionGood nutrition is the cornerstone for survival, health, and development.Well-nourished children perform better in school, growinto healthy adults, and in turn give their children a better startin life. Well-nourished women face fewer risks during pregnancyand childbirth, and their children set off on firmer developmentalpaths, both physically and mentally. Undernourished children havelower resistance to infection and are more likely to die from commonchildhood ailments such as diarrheal diseases and respiratoryinfections. Frequent illness saps the nutritional status of those whosurvive, locking them into a vicious cycle of recurring sickness andfaltering growth.The proportion of underweight children is the most common childmalnutrition indicator. Being even mildly underweight increases therisk of death and inhibits cognitive development in children. Andit perpetuates the problem across generations, as malnourishedwomen are more likely to have low-birthweight babies. Estimatesof prevalence of underweight children are from the <strong>World</strong> HealthOrganization’s (WHO) Global Database on Child Growth and Malnutrition,a standardized compilation of child growth and malnutritiondata from national nutritional surveys. To better monitor global childmalnutrition, the United Nations Children’s Fund (UNICEF), the WHO,and the <strong>World</strong> Bank have jointly produced estimates for 2011 andtrends since 1990 for regions, income groups, and the world, usinga harmonized database and aggregation method.Under-five mortalityMortality rates for children and others are important indicatorsof health status. When data on the incidence and prevalence ofdiseases are unavailable, mortality rates may be used to identifyvulnerable populations. And they are among the indicators mostfrequently used to compare socioeconomic development acrosscountries.The main sources of mortality data are vital registration systemsand direct or indirect estimates based on sample surveysor censuses. A complete vital registration system—covering atleast 90 percent of vital events in the population—is the bestsource of age-specific mortality data. But complete vital registrationsystems are fairly uncommon in developing countries. Thusestimates must be obtained from sample surveys or derived byapplying indirect estimation techniques to registration, census,or survey data (see Primary data documentation). Survey data aresubject to recall error.To make estimates comparable and to ensure consistency acrossestimates by different agencies, the United Nations Inter-agencyGroup for Child Mortality Estimation, which comprises UNICEF,WHO, the United Nations Population Division, the <strong>World</strong> Bank,and other universities and research institutes, has developed andadopted a statistical method that uses all available information toreconcile differences. Trend lines are obtained by fitting a countryspecificregression model of mortality rates against their referencedates. (For further discussion of childhood mortality estimates,see UN Inter-agency Group for Child Mortality Estimation 2012; fordetailed background data and for a graphic presentation, see www.childmortality.org).Maternal mortalityMeasurements of maternal mortality are subject to many typesof errors. In countries with incomplete vital registration systems,deaths of women of reproductive age or their pregnancy status maynot be reported, or the cause of death may not be known. Even inhigh-income countries with reliable vital registration systems, misclassificationof maternal deaths has been found to lead to seriousunderestimation. Surveys and censuses can be used to measurematernal mortality by asking respondents about survivorship of sisters.But these estimates are retrospective, referring to a periodapproximately five years before the survey, and may be affected byrecall error. Further, they reflect pregnancy-related deaths (deathswhile pregnant or within 42 days of pregnancy termination, irrespectiveof the cause of death) and need to be adjusted to conform tothe strict definition of maternal death.Maternal mortality ratios in the table are modeled estimatesbased on work by the WHO, UNICEF, United Nations Population Fund(UNFPA), and <strong>World</strong> Bank and include country-level time series data.For countries without complete registration data but with other typesof data and for countries with no data, maternal mortality is estimatedwith a multilevel regression model using available nationalmaternal mortality data and socioeconomic information, includingfertility, birth attendants, and gross domestic product. The methodologydiffers from that used for previous estimates, so data presentedhere should not be compared across editions.Adolescent fertilityReproductive health is a state of physical and mental well-beingin relation to the reproductive system and its functions and processes.Means of achieving reproductive health include educationand services during pregnancy and childbirth, safe and effectivecontraception, and prevention and treatment of sexually transmitteddiseases. Complications of pregnancy and childbirth are the leadingcause of death and disability among women of reproductive age indeveloping countries.Adolescent pregnancies are high risk for both mother and child.They are more likely to result in premature delivery, low birthweight,delivery complications, and death. Many adolescent pregnancies areunintended, but young girls may continue their pregnancies, givingup opportunities for education and employment, or seek unsafeabortions. Estimates of adolescent fertility rates are based on vitalEconomy States and markets Global links Back<strong>World</strong> <strong>Development</strong> <strong>Indicators</strong> <strong>2013</strong> 43
2 Peopleregistration systems or, in their absence, censuses or sample surveysand are generally considered reliable measures of fertility in therecent past. Where no empirical information on age-specific fertilityrates is available, a model is used to estimate the share of births toadolescents. For countries without vital registration systems fertilityrates are generally based on extrapolations from trends observedin censuses or surveys from earlier years.Prevalence of HIVHIV prevalence rates reflect the rate of HIV infection in each country’spopulation. Low national prevalence rates can be misleading,however. They often disguise epidemics that are initially concentratedin certain localities or population groups and threaten to spillover into the wider population. In many developing countries mostnew infections occur in young adults, with young women especiallyvulnerable.Data on HIV prevalence are from the Joint United Nations Programmeon HIV/AIDS. Changes in procedures and assumptions forestimating the data and better coordination with countries haveresulted in improved estimates. New models track the course ofHIV epidemics and their impacts, making full use of informationon HIV prevalence trends from surveillance data as well as surveydata. The models include the effect of antiretroviral therapy, takeinto account reduced infectivity among people receiving antiretroviraltherapy (which is having a larger impact on HIV prevalence andallowing HIV-positive people to live longer), and allow for changes inurbanization over time (important because prevalence is higher inurban areas and because many countries have seen rapid urbanizationover the past two decades). The estimates include plausiblebounds, available at http://data.worldbank.org, which reflect thecertainty associated with each of the estimates.Primary completionMany governments publish statistics that indicate how their educationsystems are working and developing—statistics on enrollmentand efficiency indicators such as repetition rates, pupil–teacherratios, and cohort progression. The primary completion rate, alsocalled the gross intake ratio to last grade of primary education, isa core indicator of an education system’s performance. It reflectsan education system’s coverage and the educational attainmentof students. It is a key measure of progress toward the Millennium<strong>Development</strong> Goals and the Education for All initiative. However, ahigh primary completion rate does not necessarily mean high levelsof student learning.The indicator reflects the primary cycle as defined by the InternationalStandard Classification of Education (ISCED97), ranging fromthree or four years of primary education (in a very small number ofcountries) to five or six years (in most countries) and seven (in asmall number of countries). It is a proxy that should be taken as anupper estimate of the actual primary completion rate, since datalimitations preclude adjusting for students who drop out during thefinal year of primary education. There are many reasons why the primarycompletion rate may exceed 100 percent. The numerator mayinclude late entrants and overage children who have repeated oneor more grades of primary education as well as children who enteredschool early, while the denominator is the number of children at theentrance age for the last grade of primary education.Youth literacyThe youth literacy rate for ages 15–24 is a standard measure ofrecent progress in student achievement. It reflects the accumulatedoutcomes of primary education by indicating the proportion of thepopulation that has acquired basic literacy and numeracy skills overthe previous 10 years or so. In practice, however, literacy is difficultto measure. Estimating literacy rates requires census or survey measurementsunder controlled conditions. Many countries estimatethe number of literate people from self-reported data. Some useeducational attainment data as a proxy but apply different lengthsof school attendance or levels of completion. Because definitionsand methods of data collection differ across countries, data shouldbe used cautiously. Generally, literacy encompasses numeracy, theability to make simple arithmetic calculations.Data on youth literacy are compiled by the United Nations Educational,Scientific and Cultural Organization (UNESCO) Institute forStatistics based on national censuses and household surveys during1985–2011 and, for countries without recent literacy data, usingthe Global Age-Specific Literacy Projection Model.Labor force participationThe labor force is the supply of labor available for producing goodsand services in an economy. It includes people who are currentlyemployed, people who are unemployed but seeking work, and firsttimejob-seekers. Not everyone who works is included, however.Unpaid workers, family workers, and students are often omitted,and some countries do not count members of the armed forces.Labor force size tends to vary during the year as seasonal workersenter and leave.Data on the labor force are compiled by the International LabourOrganization (ILO) from labor force surveys, censuses, and establishmentcensuses and surveys and from administrative recordssuch as employment exchange registers and unemployment insuranceschemes. Labor force surveys are the most comprehensivesource for internationally comparable labor force data. Labor forcedata from population censuses are often based on a limited numberof questions on the economic characteristics of individuals, withlittle scope to probe. Establishment censuses and surveys providedata on the employed population only, not unemployed workers,workers in small establishments, or workers in the informal sector(ILO, Key <strong>Indicators</strong> of the Labour Market 2001–2002).Besides the data sources, there are other important factorsthat affect data comparability, such as census or survey referenceperiod, definition of working age, and geographic coverage. For44 <strong>World</strong> <strong>Development</strong> <strong>Indicators</strong> <strong>2013</strong> Front ? User guide <strong>World</strong> view People Environment
People 2country-level information on source, reference period, or definition,consult the footnotes in the <strong>World</strong> <strong>Development</strong> <strong>Indicators</strong> databaseor the ILO’s Key <strong>Indicators</strong> of the Labour Market, 7th edition,database.The labor force participation rates in the table are estimatesfrom the ILO’s Key <strong>Indicators</strong> of the Labour Market, 7th edition,database. These harmonized estimates use strict data selectioncriteria and enhanced methods to ensure comparability acrosscountries and over time to avoid the inconsistencies mentionedabove. Estimates are based mainly on labor force surveys, withother sources (population censuses and nationally reported estimates)used only when no survey data are available. Because otheremployment data are mostly national estimates, caution shouldbe used when comparing labor force participation rate and otheremployment data.Vulnerable employmentThe proportion of unpaid family workers and own-account workers intotal employment is derived from information on status in employment.Each group faces different economic risks, and unpaid familyworkers and own-account workers are the most vulnerable—andtherefore the most likely to fall into poverty. They are the least likelyto have formal work arrangements, are the least likely to have socialprotection and safety nets to guard against economic shocks, andare often incapable of generating enough savings to offset theseshocks. A high proportion of unpaid family workers in a countryindicates weak development, little job growth, and often a largerural economy.Data on vulnerable employment are drawn from labor force andgeneral household sample surveys, censuses, and official estimates.Besides the limitation mentioned for calculating labor forceparticipation rates, there are other reasons to limit comparability.For example, information provided by the Organisation for EconomicCo-operation and <strong>Development</strong> relates only to civilian employment,which can result in an underestimation of “employees” and “workersnot classified by status,” especially in countries with largearmed forces. While the categories of unpaid family workers andown-account workers would not be affected, their relative shareswould be.UnemploymentThe ILO defines the unemployed as members of the economicallyactive population who are without work but available for and seekingwork, including people who have lost their jobs or who havevoluntarily left work. Some unemployment is unavoidable. At anytime some workers are temporarily unemployed—between jobs asemployers look for the right workers and workers search for betterjobs. Such unemployment, often called frictional unemployment,results from the normal operation of labor markets.Changes in unemployment over time may reflect changes in thedemand for and supply of labor, but they may also reflect changesin reporting practices. In countries without unemployment or welfarebenefits people eke out a living in vulnerable employment. In countrieswith well-developed safety nets workers can afford to wait forsuitable or desirable jobs. But high and sustained unemploymentindicates serious inefficiencies in resource allocation.The criteria for people considered to be seeking work, and thetreatment of people temporarily laid off or seeking work for thefirst time, vary across countries. In many developing countries itis especially difficult to measure employment and unemploymentin agriculture. The timing of a survey can maximize the effects ofseasonal unemployment in agriculture. And informal sector employmentis difficult to quantify where informal activities are not tracked.Data on unemployment are drawn from labor force sample surveysand general household sample surveys, censuses, and official estimates.Administrative records, such as social insurance statisticsand employment office statistics, are not included because of theirlimitations in coverage.Women tend to be excluded from the unemployment count forvarious reasons. Women suffer more from discrimination and fromstructural, social, and cultural barriers that impede them from seekingwork. Also, women are often responsible for the care of childrenand the elderly and for household affairs. They may not be availablefor work during the short reference period, as they need to makearrangements before starting work. Further, women are consideredto be employed when they are working part-time or in temporaryjobs, despite the instability of these jobs or their active search formore secure employment.Female legislators, senior officials, and managersDespite much progress in recent decades, gender inequalitiesremain pervasive in many dimensions of life. But while genderinequalities exist throughout the world, they are most prevalent indeveloping countries. Inequalities in the allocation of education,health care, nutrition, and political voice matter because of theirstrong association with well-being, productivity, and economicgrowth. These patterns of inequality begin at an early age, with boysroutinely receiving a larger share of education and health spendingthan girls, for example. The share of women in high-skilled occupationssuch as legislators, senior officials, and managers indicateswomen’s status and role in the labor force and society atlarge. Women are vastly underrepresented in decisionmaking positionsin government, although there is some evidence of recentimprovement.Economy States and markets Global links Back<strong>World</strong> <strong>Development</strong> <strong>Indicators</strong> <strong>2013</strong> 45
2 PeopleDefinitions• Prevalence of child malnutrition, underweight, is the percentageof children under age 5 whose weight for age is more than twostandard deviations below the median for the international referencepopulation ages 0–59 months. Data are based on the WHOchild growth standards released in 2006. • Under-five mortalityrate is the probability of a child born in a specific year dying beforereaching age 5, if subject to the age-specific mortality rates of thatyear. The probability is derived from life tables and is expressed asa rate per 1,000 live births. • Maternal mortality ratio, modeledestimate, is the number of women who die from pregnancy-relatedcauses while pregnant or within 42 days of pregnancy termination,per 100,000 live births. • Adolescent fertility rate is the numberof births per 1,000 women ages 15–19. • Prevalence of HIV is thepercentage of people who are infected with HIV in the relevant agegroup. • Primary completion rate is the number of new entrants(enrollments minus repeaters) in the last grade of primary education,regardless of age, divided by the population at the entrance agefor the last grade of primary education. Data limitations precludeadjusting for students who drop out during the final year of primaryeducation. • Youth literacy rate is the percentage of the populationages 15–24 that can, with understanding, both read and writea short simple statement about their everyday life. • Labor forceparticipation rate is the proportion of the population ages 15 andolder that engages actively in the labor market, by either working orlooking for work during a reference period. • Vulnerable employmentis unpaid family workers and own-account workers as a percentageof total employment. • Unemployment is the share of the labor forcewithout work but available for and seeking employment. Definitionsof labor force and unemployment may differ by country. • Femalelegislators, senior officials, and managers are the percentage oflegislators, senior officials, and managers (International StandardClassification of Occupations–88 category 1) who are female.Data sourcesData on child malnutrition prevalence are from the WHO’s GlobalDatabase on Child Growth and Malnutrition (www.who.int/nutgrowthdb/en/). Data on under-five mortality rates are from UNInter-agency Group for Child Mortality Estimation (2012) and arebased mainly on household surveys, censuses, and vital registrationdata. Modeled estimates of maternal mortality ratios are fromWHO and others (2012). Data on adolescent fertility rates are fromUnited Nations Population Division (2011), with annual data linearlyinterpolated by the <strong>World</strong> Bank’s <strong>Development</strong> Data Group. Data onHIV prevalence are from UNAIDS (2012). Data on primary completionrates and literacy rates are from the UNESCO Institute for Statistics(www.uis.unesco.org). Data on labor force participation rates, vulnerableemployment, unemployment, and female legislators, seniorofficials, and managers are from the ILO’s Key <strong>Indicators</strong> of theLabour Market, 7th edition, database.ReferencesDe Onis, Mercedes, Monika Blössner, Elaine Borghi, Richard Morris,and Edward A. Frongillo. 2004. “Methodology for EstimatingRegional and Global Trends of Child Malnutrition.” International Journalof Epidemiology 33: 1260–70.ILO (International Labour Organization).Various years. Key <strong>Indicators</strong> ofthe Labour Market. Geneva: International Labour Office.UNAIDS (Joint United Nations Programme on HIV/AIDS). 2012. GlobalReport: UNAIDS Report on the Global AIDS Epidemic 2012. Geneva.UNICEF (United Nations Children’s Fund), WHO (<strong>World</strong> Health Organization),and <strong>World</strong> Bank. 2012. Joint Child Malnutrition Estimates—Levels and Trends. www.who.int/nutgrowthdb/jme_unicef_who_wb.pdf. New York: UNICEF.UN Inter-agency Group for Child Mortality Estimation. 2012. Levels andTrends in Child Mortality: Report 2012. New York.United Nations Population Division. 2011. <strong>World</strong> Population Prospects:The 2010 Revision. New York: United Nations, Department of Economicand Social Affairs.WHO (<strong>World</strong> Health Organization), UNICEF (United Nations Children’sFund), UNFPA (United Nations Population Fund), and <strong>World</strong> Bank.2012. Trends in Maternal Mortality: 1990 to 2010. Geneva: WHO.<strong>World</strong> Bank. n.d. PovcalNet online database. http://iresearch.worldbank.org/PovcalNet. Washington, DC.46 <strong>World</strong> <strong>Development</strong> <strong>Indicators</strong> <strong>2013</strong> Front ? User guide <strong>World</strong> view People Environment
People 2Online tables and indicatorsTo access the <strong>World</strong> <strong>Development</strong> <strong>Indicators</strong> online tables, usethe URL http://wdi.worldbank.org/table/ and the table number (forexample, http://wdi.worldbank.org/table/2.1). To view a specificindicator online, use the URL http://data.worldbank.org/indicator/and the indicator code (for example, http://data.worldbank.org/indicator/SP.POP.TOTL).2.1 Population dynamicsPopulationSP.POP.TOTLUnemployment by educational attainment,SecondarySL.UEM.SECO.ZSPopulation growthPopulation ages 0–14SP.POP.GROWSP.POP.0014.TO.ZSUnemployment by educational attainment,TertiarySL.UEM.TERT.ZSPopulation ages 15–64Population ages 65+Dependency ratio, YoungDependency ratio, OldCrude death rateCrude birth rateSP.POP.1564.TO.ZSSP.POP.65UP.TO.ZSSP.POP.DPND.YGSP.POP.DPND.OLSP.DYN.CDRT.INSP.DYN.CBRT.IN2.6 Children at workChildren in employment, TotalChildren in employment, MaleChildren in employment, FemaleWork onlyStudy and workSL.TLF.0714.ZSSL.TLF.0714.MA.ZSSL.TLF.0714.FE.ZSSL.TLF.0714.WK.ZSSL.TLF.0714.SW.ZS2.2 Labor force structureEmployment in agricultureSL.AGR.0714.ZSLabor force participation rate, MaleSL.TLF.CACT.MA.ZSEmployment in manufacturingSL.MNF.0714.ZSLabor force participation rate, FemaleSL.TLF.CACT.FE.ZSEmployment in servicesSL.SRV.0714.ZSLabor force, TotalSL.TLF.TOTL.INSelf-employedSL.SLF.0714.ZSLabor force, Average annual growth.. a,bWage workersSL.WAG0714.ZSLabor force, FemaleSL.TLF.TOTL.FE.ZSUnpaid family workersSL.FAM.0714.ZS2.3 Employment by sector2.7 Poverty rates at national poverty linesAgriculture, MaleSL.AGR.EMPL.MA.ZSPoverty headcount ratio, RuralSI.POV.RUHCAgriculture, FemaleIndustry, MaleIndustry, FemaleServices, MaleServices, FemaleSL.AGR.EMPL.FE.ZSSL.IND.EMPL.MA.ZSSL.IND.EMPL.FE.ZSSL.SRV.EMPL.MA.ZSSL.SRV.EMPL.FE.ZSPoverty headcount ratio, UrbanPoverty headcount ratio, NationalPoverty gap, RuralPoverty gap, UrbanPoverty gap, NationalSI.POV.URHCSI.POV.NAHCSI.POV.RUGPSI.POV.URGPSI.POV.NAGP2.4 Decent work and productive employmentEmployment to population ratio, TotalEmployment to population ratio, YouthVulnerable employment, MaleVulnerable employment, FemaleGDP per person employed2.5 UnemploymentUnemployment, MaleUnemployment, FemaleYouth unemployment, MaleYouth unemployment, FemaleLong-term unemployment, TotalLong-term unemployment, MaleLong-term unemployment, FemaleUnemployment by educational attainment,PrimarySL.EMP.TOTL.SP.ZSSL.EMP.1524.SP.ZSSL.EMP.VULN.MA.ZSSL.EMP.VULN.FE.ZSSL.GDP.PCAP.EM.KDSL.UEM.TOTL.MA.ZSSL.UEM.TOTL.FE.ZSSL.UEM.1524.MA.ZSSL.UEM.1524.FE.ZSSL.UEM.LTRM.ZSSL.UEM.LTRM.MA.ZSSL.UEM.LTRM.FE.ZSSL.UEM.PRIM.ZS2.8 Poverty rates at international poverty linesPopulation living below 2005 PPP $1.25a dayPoverty gap at 2005 PPP $1.25 a dayPopulation living below 2005 PPP $2 a dayPoverty gap at 2005 PPP $2 a day2.9 Distribution of income or consumptionGini indexSI.POV.DDAYSI.POV.2DAYSI.POV.GAPSSI.POV.GAP2SI.POV.GINIShare of consumption or income, Lowest10% of population SI.DST.FRST.10Share of consumption or income, Lowest20% of population SI.DST.FRST.20Share of consumption or income, Second20% of population SI.DST.02ND.20Share of consumption or income, Third 20%of populationSI.DST.03RD.20Share of consumption or income, Fourth20% of population SI.DST.04TH.20Economy States and markets Global links Back<strong>World</strong> <strong>Development</strong> <strong>Indicators</strong> <strong>2013</strong> 47
2 PeopleShare of consumption or income, Highest20% of population SI.DST.05TH.20Share of consumption or income, Highest10% of population SI.DST.10TH.102.10 Education inputsPublic expenditure per student, PrimaryPublic expenditure per student, SecondaryPublic expenditure per student, TertiaryPublic expenditure on education, % of GDPPublic expenditure on education, % of totalgovernment expenditureTrained teachers in primary educationPrimary school pupil-teacher ratio2.11 Participation in educationPreprimary gross enrollment ratioPrimary gross enrollment ratioSecondary gross enrollment ratioTertiary gross enrollment ratioPrimary net enrollment rateSecondary net enrollment ratePrimary adjusted net enrollment rate, MalePrimary adjusted net enrollment rate, FemalePrimary school-age children out of school,MalePrimary school-age children out of school,Female2.12 Education efficiencyGross intake ratio in first grade of primaryeducation, MaleGross intake ratio in first grade of primaryeducation, FemaleReaching grade 5, MaleReaching grade 5, FemaleReaching last grade of primary education,MaleReaching last grade of primary education,FemaleRepeaters in primary education, MaleRepeaters in primary education, FemaleTransition rate to secondary education, MaleTransition rate to secondary education,Female2.13 Education completion and outcomesPrimary completion rate, TotalPrimary completion rate, MaleSE.XPD.PRIM.PC.ZSSE.XPD.SECO.PC.ZSSE.XPD.TERT.PC.ZSSE.XPD.TOTL.GD.ZSSE.XPD.TOTL.GB.ZSSE.PRM.TCAQ.ZSSE.PRM.ENRL.TC.ZSSE.PRE.ENRRSE.PRM.ENRRSE.SEC.ENRRSE.TER.ENRRSE.PRM.NENRSE.SEC.NENRSE.PRM.TENR.MASE.PRM.TENR.FESE.PRM.UNER.MASE.PRM.UNER.FESE.PRM.GINT.MA.ZSSE.PRM.GINT.FE.ZSSE.PRM.PRS5.MA.ZSSE.PRM.PRS5.FE.ZSSE.PRM.PRSL.MA.ZSSE.PRM.PRSL.FE.ZSSE.PRM.REPT.MA.ZSSE.PRM.REPT.FE.ZSSE.SEC.PROG.MA.ZSSE.SEC.PROG.FE.ZSSE.PRM.CMPT.ZSSE.PRM.CMPT.MA.ZSPrimary completion rate, FemaleYouth literacy rate, MaleYouth literacy rate, FemaleAdult literacy rate, MaleAdult literacy rate, Female2.14 Education gaps by income and genderThis table provides education survey datafor the poorest and richest quintiles.2.15 Health systemsTotal health expenditurePublic health expenditureOut-of-pocket health expenditureExternal resources for healthHealth expenditure per capita, $Health expenditure per capita, PPP $PhysiciansNurses and midwivesCommunity health workersHospital bedsCompleteness of birth registration2.16 Disease prevention coverage and qualityAccess to an improved water sourceAccess to improved sanitation facilitiesChild immunization rate, MeaslesChild immunization rate, DTP3Children with acute respiratory infectiontaken to health providerChildren with diarrhea who received oralrehydration and continuous feedingChildren sleeping under treated bed netsChildren with fever receiving antimalarialdrugsTuberculosis treatment success rateTuberculosis case detection rate2.17 Reproductive healthTotal fertility rateAdolescent fertility rateUnmet need for contraceptionContraceptive prevalence ratePregnant women receiving prenatal careBirths attended by skilled health staffMaternal mortality ratio, National estimateMaternal mortality ratio, Modeled estimateLifetime risk of maternal mortalitySE.PRM.CMPT.FE.ZSSE.ADT.1524.LT.MA.ZSSE.ADT.1524.LT.FE.ZSSE.ADT.LITR.MA.ZSSE.ADT.LITR.FE.ZS.. bSH.XPD.TOTL.ZSSH.XPD.PUBLSH.XPD.OOPC.ZSSH.XPD.EXTR.ZSSH.XPD.PCAPSH.XPD.PCAP.PP.KDSH.MED.PHYS.ZSSH.MED.NUMW.P3SH.MED.CMHW.P3SH.MED.BEDS.ZSSP.REG.BRTH.ZSSH.H2O.SAFE.ZSSH.STA.ACSNSH.IMM.MEASSH.IMM.IDPTSH.STA.ARIC.ZSSH.STA.ORCF.ZSSH.MLR.NETS.ZSSH.MLR.TRET.ZSSH.TBS.CURE.ZSSH.TBS.DTEC.ZSSP.DYN.TFRT.INSP.ADO.TFRTSP.UWT.TFRTSP.DYN.CONU.ZSSH.STA.ANVC.ZSSH.STA.BRTC.ZSSH.STA.MMRT.NESH.STA.MMRTSH.MMR.RISK48 <strong>World</strong> <strong>Development</strong> <strong>Indicators</strong> <strong>2013</strong> Front ? User guide <strong>World</strong> view People Environment
People 22.18 Nutrition and growthPrevalence of undernourishmentPrevalence of underweight, MalePrevalence of underweight, FemalePrevalence of stunting, MalePrevalence of stunting, FemalePrevalence of wasting, MalePrevalence of wasting, FemalePrevalence of overweight children, MalePrevalence of overweight children, Female2.19 Nutrition intake and supplementsLow-birthweight babiesExclusive breastfeedingConsumption of iodized saltVitamin A supplementationPrevalence of anemia among childrenunder age 5Prevalence of anemia among pregnantwomen2.20 Health risk factors and future challengesPrevalence of smoking, MalePrevalence of smoking, FemaleIncidence of tuberculosisPrevalence of diabetesPrevalence of HIV, TotalSN.ITK.DEFC.ZSSH.STA.MALN.MA.ZSSH.STA.MALN.FE.ZSSH.STA.STNT.MA.ZSSH.STA.STNT.FE.ZSSH.STA.WAST.MA.ZSSH.STA.WAST.FE.ZSSH.STA.OWGH.MA.ZSSH.STA.OWGH.FE.ZSSH.STA.BRTW.ZSSH.STA.BFED.ZSSN.ITK.SALT.ZSSN.ITK.VITA.ZSSH.ANM.CHLD.ZSSH.PRG.ANEMSH.PRV.SMOK.MASH.PRV.SMOK.FESH.TBS.INCDSH.STA.DIAB.ZSSH.DYN.AIDS.ZSWomen’s share of population ages 15+living with HIVPrevalence of HIV, Youth malePrevalence of HIV, Youth femaleAntiretroviral therapy coverageDeath from communicable diseases andmaternal, prenatal, and nutrition conditionsDeath from non-communicable diseasesDeath from injuries2.21 MortalityLife expectancy at birthNeonatal mortality rateInfant mortality rateUnder-five mortality rate, TotalUnder-five mortality rate, MaleUnder-five mortality rate, FemaleAdult mortality rate, MaleAdult mortality rate, Female2.22 Health gaps by incomeThis table provides health survey data forthe poorest and richest quintiles.SH.DYN.AIDS.FE.ZSSH.HIV.1524.MA.ZSSH.HIV.1524.FE.ZSSH.HIV.ARTC.ZSSH.DTH.COMM.ZSSH.DTH.NCOM.ZSSH.DTH.INJR.ZSSP.DYN.LE00.INSH.DYN.NMRTSP.DYN.IMRT.INSH.DYN.MORTSH.DYN.MORT.MASH.DYN.MORT.FESP.DYN.AMRT.MASP.DYN.AMRT.FEData disaggregated by sex are available inthe <strong>World</strong> <strong>Development</strong> <strong>Indicators</strong> database.a. Derived from data elsewhere in the <strong>World</strong> <strong>Development</strong> <strong>Indicators</strong> database.b. Available online only as part of the table, not as an individual indicator... bEconomy States and markets Global links Back<strong>World</strong> <strong>Development</strong> <strong>Indicators</strong> <strong>2013</strong> 49
ENVIRONMENT50 <strong>World</strong> <strong>Development</strong> <strong>Indicators</strong> <strong>2013</strong> Front ? User guide <strong>World</strong> view People Environment
The Millennium <strong>Development</strong> Goals call for integratingprinciples of environmental sustainabilityinto country policies and programs and reversingenvironmental losses. Whether the world continuesto sustain itself depends largely on properlymanaging its natural resources. The indicators inthe Environment section measure resource useand the way human activities affect the naturaland built environment. They include measures ofenvironmental goods (forest, water, cultivatableland) and of degradation (pollution, deforestation,loss of habitat, and loss of biodiversity).These indicators show that growing populationsand expanding economies have placed greaterdemands on land, water, forests, minerals, andenergy sources. But new technologies, increasingproductivity, and better policies can ensurethat future development is environmentally andsocially sustainable.Nowhere are these risks and opportunitiesmore intertwined than in the global effort to mitigatethe effects of climate change. A continuingrise in temperature, accompanied by changesin precipitation patterns, is projected for thiscentury, as are more frequent, severe, and prolongedclimate-related events such as floodsand droughts—posing risks for agriculture, foodproduction, and water supplies. Poor countriesand the poorest people in all countries are mostvulnerable to the changing climate.The 2012 edition of <strong>World</strong> <strong>Development</strong><strong>Indicators</strong> included two new tables on climatechange. The first presents data on carbon dioxideemissions by economic sector from theInternational Energy Agency’s annual time seriesstatistics. And the second contains country indicatorson climate variability, exposure to impact,and resilience.Other indicators in this section describeland use, agriculture and food production, forestsand biodiversity, threatened species, waterresources, energy use and efficiency, electricityproduction and use, greenhouse gas emissions,urbanization, traffic and congestion, air pollution,government commitments, and natural resourcerents.Where possible, the indicators come frominternational sources and are standardized tofacilitate comparison across countries. But ecosystemsspan national boundaries, and accessto natural resources may vary within countries.For example, water may be abundant in someparts of a country but scarce in others, andcountries often share water resources. Land productivityand optimal land use may be locationspecific, but widely separated regions can havecommon characteristics. Greenhouse gas emissionsand climate change are measured globally,but their effects are experienced locally, shapingpeople’s lives and opportunities. Measuring environmentalphenomena and their effects at thesubnational, national, and supranational levelsremains a major challenge for achieving longterm,sustainable development.3Economy States and markets Global links Back<strong>World</strong> <strong>Development</strong> <strong>Indicators</strong> <strong>2013</strong> 51
HighlightsEast Asia & Pacific: More access to improved sanitation facilitiesShare of population with access to improved sanitation facilities (%)100806040SamoaTongaPalauEast Asia & PacificChinaPapua New GuineaTimor-LesteEast Asia and Pacific has more than doubled the proportion of peoplewith access to improved sanitation facilities. This is an impressiveachievement, bringing access to basic sanitation facilities to morethan 700 million additional people, mostly in China. Because of itssize, China dominates the regional average of East Asia and Pacific.But some countries progressed even faster than China, such asPalau, with 100 percent access in 2010. At the other end of thespectrum is Cambodia, where only 31 percent of the population hasaccess.20Cambodia019901995200020052010Source: Table 3.Europe & Central Asia: Emissions fall but per capita carbon dioxide emissions remain highCarbon dioxide emissions (metric tons per capita)302010019902009a. Includes countries at all income levels.Source: Online table 3.8.LuxembourgFaeroe IslandsKazakhstanEstoniaRussian FederationCzech RepublicNetherlandsGreenlandFinlandNorwayEurope & Central Asia aCarbon dioxide emissions, largely a byproduct of energy productionand use, account for the largest portion of greenhouse gases releasedeach year. Greenhouse gases—including carbon dioxide, methane,nitrous oxide, and other industrial gases (hydrofluorocarbons, perfluorocarbons,and sulfur hexafluoride)—are associated with global warmingand environmental damage. In 2009 the world released an estimated32 billion metric tons of carbon dioxide, up 44 percent from1990. In Europe and Central Asia carbon dioxide emissions fell 25 percentover the same period, but emissions per capita remain the highestamong developing regions. Emissions of other greenhouse gases havealso risen over the last two decades. In 2010 global emissions wereestimated at 7.5 billion metric tons of carbon dioxide equivalent formethane, 2.9 billion for nitrous dioxide, and 1.0 billion for other industrialgases.Latin America & Caribbean: The leader in clean and efficient energyEnergy use, 2010 (%)1007550250LatinAmerica &CaribbeanAlternative and nuclear energyCombustible renewables and wasteFossil fuelEurope& CentralAsiaEast Asia& PacificSource: Online tables 3.6 and 3.8.SouthAsiaSub-SaharanAfricaMiddle East& NorthAfricaLatin America and the Caribbean remains one of the world’s most efficientenergy-using regions, measured by the ratio of gross domestic productto energy use. Latin American countries averaged $7.70 of output perkilogram of oil-equivalent energy used in 2010 (in 2005 purchasingpower parity dollars), up 12 percent from 1990. Peru, Colombia, Panama,Costa Rica, and Uruguay were the region’s most efficient energyusers. Clean energy from noncarbon energy sources, which consists ofalternative energy (geothermal, solar, and hydropower) and nuclearenergy, is also on the rise, accounting for 9.2 percent of world energyuse in 2010, but 10.4 percent in Latin America and the Caribbean, highestamong developing regions. The increase in carbon dioxide emissionsslowed, but the region’s emissions still rose more than 57 percentbetween 1990 and 2009. Mexico, Brazil, República Bolivariana de Venezuela,Argentina, and Colombia were the largest emitters.52 <strong>World</strong> <strong>Development</strong> <strong>Indicators</strong> <strong>2013</strong>Front ? User guide <strong>World</strong> view People Environment
Middle East & North Africa: The most water-stressed regionThe world has about 42 trillion cubic meters of available freshwater,but distribution is drastically uneven. The Middle East and NorthAfrica is the most water-stressed region, with less than 1 percent ofglobal renewable freshwater resources. At 226 billion cubic meters,the region has only 673 cubic meters of water per person, the lowestamong developing regions. By contrast, Latin America and the Caribbean,with 32 percent of world resources, has 22,810 cubic meters perperson; Europe and Central Asia, with 12 percent, has 12,516 cubicmeters per person; and East Asia and Pacific, with 21 percent, has4,446 cubic meters per person.Renewable internal freshwater resources, 2011 (%)South Asia 5%Sub-SaharanAfrica9%Europe &Central Asia12%East Asia& Pacific21%Middle East & North Africa 0.5%Latin America& Caribbean32%High income21%South Asia: Some of the world’s most polluted citiesSource: Online table 3.5.South Asia has some of the most polluted air in the world, asmeasured by the concentration of fine suspended particulates offewer than 10 microns in diameter (PM10), capable of penetratingdeep into the respiratory tract and causing severe health damage.The PM10 estimates measure the annual exposure of the averageurban resident to outdoor particulate matter. Globally, air pollutionhas fallen from 78 micrograms per cubic meter to 41 over the lasttwo decades. Among developing regions the highest concentrationsare in South Asia (62) and the Middle East and North Africa (59).City-level PM10 concentration data, however, indicate that Sub-Saharan Africa has the most cities with high levels of pollutionamong developing regions. Even so, the PM10 concentration hasdropped significantly in Sub- Saharan Africa, falling 65 percent over1990–2010.Particulates of less than 10 microns in diameter, 2010(micrograms per cubic meter)Nyala, SudanMaroua, CameroonDhaka, BangladeshMuzaffarpur, IndiaHyderabad, PakistanSaint-Louis, SenegalSégou, MaliXi’an, ChinaMontevideo, UruguayBamako, MaliNiamey, NigerOsh, Kyrgyz RepublicShubra-El-Khema, EgyptN’djamena, ChadSource: Online tables 3.13 and 3.14.0 50 100 150 200Sub- Saharan Africa: Use of biomass energy for cooking and heating increases health risksMany poor people depend on biomass energy from plant materials oranimal waste for cooking and heating. Millions of deaths are causedby indoor air pollution each year, due largely to indoor particulate pollution.Many are children, who die of acute respiratory infections fromburning fuel wood, crop residues, or animal dung (WHO 2004). Thesesources of energy account for 66 percent of total energy used by morethan 800 million low-income inhabitants of the world. In Sub- SaharanAfrica use of combustible renewables and waste, which account formore than half of total energy use, has risen almost 3 percent overthe last two decades. For this region, where an estimated 67 percentof the population lacks access to any form of electrical services, useof biomass and coal—the primary cooking and heating fuel—is stillon the rise.Combustible renewables and waste, 2010 (% of energy use)1007550250Source: Online tables 1.1 and 3.6.Congo, Dem. Rep.EthiopiaTanzaniaNigeriaTogoMozambiqueZambiaEritreaCôte d’IvoireKenyaSub-Saharan Africa<strong>World</strong>Economy States and markets Global links Back<strong>World</strong> <strong>Development</strong> <strong>Indicators</strong> <strong>2013</strong> 53
3 EnvironmentDeforestation aaverageannual %NationallyprotectedareasTerrestrial andmarine areas% of totalterritorial areaInternalrenewablefreshwaterresources bPer capitacubic metersAccess toimprovedwatersource% of totalpopulationAccess toimprovedsanitationfacilities% of totalpopulationUrbanpopulationaverageannual% growthParticulatematterconcentrationurban-populationweightedPM10micrograms percubic meterCarbondioxideemissionsmillionmetric tonsEnergy usePer capitakilograms ofoil equivalentElectricityproduction2000–10 2010 2011 2010 2010 1990–2011 2010 2009 2010 2010Afghanistan 0.00 0.4 1,335 50 37 4.0 30 6.3 .. ..Albania –0.10 8.4 8,364 95 94 2.4 38 3.0 648 7.6Algeria 0.57 6.2 313 83 95 2.6 69 121.3 1,138 45.6American Samoa 0.19 16.7 .. .. .. 1.9 .. .. .. ..Andorra 0.00 6.1 3,663 100 100 0.9 18 0.5 .. ..Angola 0.21 12.1 7,544 51 58 4.1 58 26.7 716 5.3Antigua and Barbuda 0.20 1.0 580 .. .. 1.0 13 0.5 .. ..Argentina 0.81 5.3 6,771 .. .. 1.0 57 174.7 1,847 125.3Armenia 1.48 8.0 2,212 98 90 0.3 45 4.5 791 6.5Aruba 0.00 0.0 .. 100 .. 0.8 .. 2.3 .. ..Australia 0.37 12.5 22,039 100 100 1.3 13 400.2 5,653 241.5Austria –0.13 22.9 6,529 100 100 0.7 27 62.3 4,034 67.9Azerbaijan 0.00 7.1 885 80 82 1.8 27 49.1 1,307 18.7Bahamas, The 0.00 1.0 58 .. 100 1.5 .. 2.6 .. ..Bahrain –3.55 0.7 3 .. .. 4.9 44 24.2 7,754 13.2Bangladesh 0.18 1.6 698 81 56 3.0 115 51.0 209 42.3Barbados 0.00 0.1 292 100 100 1.4 35 1.6 .. ..Belarus –0.43 7.2 3,927 100 93 0.4 6 60.3 2,922 34.9Belgium –0.16 13.2 1,089 100 100 1.2 21 103.6 5,586 93.8Belize 0.67 20.6 44,868 98 90 3.0 12 0.4 .. ..Benin 1.04 23.3 1,132 75 13 4.2 48 4.9 413 0.2Bermuda 0.00 5.1 .. .. .. 0.7 .. 0.5 .. ..Bhutan –0.34 28.3 105,653 96 44 3.9 20 0.4 .. ..Bolivia 0.50 18.5 30,085 88 27 2.2 57 14.5 737 6.9Bosnia and Herzegovina 0.00 0.6 9,461 99 95 0.9 21 30.1 1,703 17.1Botswana 0.99 30.9 1,182 96 62 2.2 64 4.4 1,128 0.5Brazil 0.50 26.0 27,551 98 79 1.2 18 367.1 1,363 515.7Brunei Darussalam 0.44 29.6 20,939 .. .. 2.2 44 9.3 8,308 3.9Bulgaria –1.53 8.9 2,858 100 100 –1.7 40 42.8 2,370 46.0Burkina Faso 1.01 14.2 737 79 17 6.2 65 1.7 .. ..Burundi 1.40 4.8 1,173 72 46 4.9 24 0.2 .. ..Cambodia 1.34 23.4 8,431 64 31 2.1 42 4.6 355 1.0Cameroon 1.05 9.0 13,629 77 49 3.3 59 6.7 363 5.9Canada 0.00 6.2 82,647 100 100 1.2 15 513.9 7,380 607.8Cape Verde –0.36 0.2 599 88 61 2.1 .. 0.3 .. ..Cayman Islands 0.00 1.5 .. 96 96 0.9 .. 0.5 .. ..Central African Republic 0.13 17.7 31,425 67 34 2.6 35 0.2 .. ..Chad 0.66 9.4 1,301 51 13 3.0 83 0.4 .. ..Channel Islands .. 0.5 .. .. .. 0.8 .. .. .. ..Chile –0.25 13.3 51,188 96 96 1.1 46 66.7 1,807 60.4China –1.57 16.0 2,093 91 64 3.0 59 7,687.1 1,807 4,208.3Hong Kong SAR, China .. 41.8 .. .. .. 0.1 .. 37.0 1,951 38.3Macao SAR, China .. .. .. .. .. 2.2 .. 1.5 .. ..Colombia 0.17 20.5 45,006 92 77 1.7 19 71.2 696 56.8Comoros 9.34 .. 1,592 95 36 2.9 30 0.1 .. ..Congo, Dem. Rep. 0.20 10.0 13,283 45 24 4.3 35 2.7 360 7.9Congo, Rep. 0.07 9.7 53,626 71 18 3.0 57 1.9 363 0.6billionkilowatthours54 <strong>World</strong> <strong>Development</strong> <strong>Indicators</strong> <strong>2013</strong> Front ? User guide <strong>World</strong> view People Environment
Environment 3Deforestation aaverageannual %NationallyprotectedareasTerrestrial andmarine areas% of totalterritorial areaInternalrenewablefreshwaterresources bPer capitacubic metersAccess toimprovedwatersource% of totalpopulationAccess toimprovedsanitationfacilities% of totalpopulationUrbanpopulationaverageannual% growthParticulatematterconcentrationurban-populationweightedPM10micrograms percubic meterCarbondioxideemissionsmillionmetric tonsEnergy usePer capitakilograms ofoil equivalentElectricityproduction2000–10 2010 2011 2010 2010 1990–2011 2010 2009 2010 2010Costa Rica –0.93 17.6 23,780 97 95 2.2 27 8.3 998 9.6Côte d’Ivoire –0.15 21.8 3,813 80 24 3.5 30 6.6 485 6.0Croatia –0.19 9.5 8,562 99 99 0.2 22 21.5 1,932 14.0Cuba –1.66 5.3 3,387 94 91 –0.1 15 31.6 975 17.4Curaçao .. .. .. .. .. .. .. .. .. ..Cyprus –0.09 4.5 699 100 100 1.4 27 8.2 2,215 5.4Czech Republic –0.08 15.1 1,253 100 98 –0.3 16 108.1 4,193 85.3Denmark –1.14 4.1 1,077 100 100 0.6 15 45.7 3,470 38.8Djibouti 0.00 0.0 331 88 50 2.0 28 0.5 .. ..Dominica 0.58 3.7 .. .. .. 0.1 20 0.1 .. ..Dominican Republic 0.00 24.1 2,088 86 83 2.1 14 20.3 840 15.9Ecuador 1.81 38.0 29,456 94 92 2.2 19 30.1 836 17.7Egypt, Arab Rep. –1.73 6.1 22 99 95 2.1 78 216.1 903 146.8El Salvador 1.45 1.4 2,850 88 87 1.3 28 6.3 677 6.0Equatorial Guinea 0.69 14.0 36,100 .. .. 3.2 6 4.8 .. ..Eritrea 0.28 3.8 517 61 14 5.2 61 0.5 142 0.3Estonia 0.12 22.6 9,486 98 95 0.1 9 16.0 4,155 13.0Ethiopia 1.08 18.4 1,440 44 21 3.7 47 7.9 400 5.0Faeroe Islands 0.00 .. .. .. .. 0.8 11 0.7 .. ..Fiji –0.34 0.2 32,876 98 83 1.7 20 0.8 .. ..Finland 0.14 8.5 19,858 100 100 0.6 15 53.6 6,787 80.7France –0.39 17.1 3,057 100 100 1.2 12 363.4 4,031 564.3French Polynesia –3.97 0.1 .. 100 98 1.1 .. 0.9 .. ..Gabon 0.00 14.6 106,892 87 33 2.3 7 1.6 1,418 1.8Gambia, The –0.41 1.3 1,689 89 68 3.7 60 0.4 .. ..Georgia 0.09 3.4 12,958 98 95 1.0 49 5.8 700 10.1Germany 0.00 42.3 1,308 100 100 0.2 16 734.6 4,003 622.1Ghana 2.08 14.0 1,214 86 14 3.6 22 7.4 382 8.4Greece –0.81 9.9 5,133 100 98 0.3 27 94.9 2,440 57.4Greenland 0.00 40.1 .. 100 100 0.2 .. 0.6 .. ..Grenada 0.00 0.1 .. .. 97 1.3 19 0.2 .. ..Guam 0.00 3.6 .. 100 99 1.3 .. .. .. ..Guatemala 1.40 29.5 7,400 92 78 3.4 51 15.2 713 8.8Guinea 0.54 6.4 22,110 74 18 3.8 55 1.2 .. ..Guinea-Bissau 0.48 26.9 10,342 64 20 3.6 48 0.3 .. ..Guyana 0.00 4.8 318,766 94 84 0.5 20 1.6 .. ..Haiti 0.76 0.1 1,285 69 17 3.8 35 2.3 229 0.6Honduras 2.06 13.9 12,371 87 77 3.1 34 7.7 601 6.7Hungary –0.62 5.1 602 100 100 0.4 15 48.7 2,567 37.4Iceland –4.99 13.2 532,892 100 100 0.4 18 2.0 16,882 17.1India –0.46 4.8 1,165 92 34 2.5 52 1,979.4 566 959.9Indonesia 0.51 6.4 8,332 82 54 2.5 60 451.8 867 169.8Iran, Islamic Rep. 0.00 6.9 1,718 96 100 1.3 56 602.1 2,817 233.0Iraq –0.09 0.1 1,068 79 73 2.8 88 109.0 1,180 50.2Ireland –1.53 1.2 10,707 100 99 2.7 13 41.6 3,218 28.4Isle of Man 0.00 .. .. .. .. 0.5 .. .. .. ..Israel –0.07 15.1 97 100 100 1.9 21 67.2 3,005 58.6billionkilowatthoursEconomy States and markets Global links Back<strong>World</strong> <strong>Development</strong> <strong>Indicators</strong> <strong>2013</strong> 55
3 EnvironmentDeforestation aaverageannual %NationallyprotectedareasTerrestrial andmarine areas% of totalterritorial areaInternalrenewablefreshwaterresources bPer capitacubic metersAccess toimprovedwatersource% of totalpopulationAccess toimprovedsanitationfacilities% of totalpopulationUrbanpopulationaverageannual% growthParticulatematterconcentrationurban-populationweightedPM10micrograms percubic meterCarbondioxideemissionsmillionmetric tonsEnergy usePer capitakilograms ofoil equivalentElectricityproduction2000–10 2010 2011 2010 2010 1990–2011 2010 2009 2010 2010Italy –0.90 15.9 3,005 100 .. 0.7 21 400.8 2,815 298.8Jamaica 0.11 7.3 3,475 93 80 0.4 27 8.6 1,131 4.2Japan –0.05 10.9 3,364 100 100 0.9 24 1,101.1 3,898 1,110.8Jordan 0.00 1.9 110 97 98 2.5 30 22.5 1,191 14.8Kazakhstan 0.17 2.5 3,886 95 97 1.3 18 225.8 4,595 82.6Kenya 0.33 11.7 497 59 32 4.4 30 12.4 483 7.5Kiribati 0.00 22.6 .. .. .. 1.8 .. 0.1 .. ..Korea, Dem. Rep. 2.00 3.9 2,740 98 80 0.6 52 75.1 761 21.7Korea, Rep. 0.11 3.0 1,303 98 100 1.1 30 509.4 5,060 496.7Kosovo .. .. .. .. .. .. .. .. 1,372 5.2Kuwait –2.57 1.1 0 99 100 2.9 91 80.2 12,204 57.0Kyrgyz Republic –1.07 6.9 8,873 90 93 1.5 35 6.7 536 11.4Lao PDR 0.49 16.6 30,280 67 63 4.7 45 1.8 .. ..Latvia –0.34 16.4 8,133 99 78 –8.4 12 6.7 1,971 6.6Lebanon –0.45 0.4 1,127 100 .. 0.9 25 21.0 1,526 15.7Lesotho –0.47 0.5 2,384 78 26 3.7 38 .. .. ..Liberia 0.67 1.6 48,443 73 18 4.1 31 0.5 .. ..Libya 0.00 0.1 109 .. 97 1.3 65 62.9 3,013 31.6Liechtenstein 0.00 42.4 .. .. .. 0.5 24 .. .. ..Lithuania –0.68 14.4 5,135 92 86 –8.0 16 12.8 2,107 5.0Luxembourg 0.00 20.0 1,930 100 100 2.5 12 10.1 8,343 3.2Macedonia, FYR –0.41 4.9 2,616 100 88 0.4 17 11.3 1,402 7.3Madagascar 0.45 2.5 15,810 46 15 4.8 28 1.8 .. ..Malawi 0.97 15.0 1,049 83 51 4.1 29 1.1 .. ..Malaysia 0.54 13.7 20,098 100 96 2.5 18 198.3 2,558 125.3Maldives 0.00 .. 94 98 97 4.1 28 1.0 .. ..Mali 0.61 2.4 3,788 64 22 4.9 111 0.6 .. ..Malta 0.00 1.7 121 100 100 0.1 .. 2.5 2,013 2.1Marshall Islands 0.00 0.6 .. 94 75 1.9 .. 0.1 .. ..Mauritania 2.66 1.1 113 50 26 3.0 68 2.1 .. ..Mauritius 1.00 0.7 2,139 99 89 0.4 16 3.8 .. ..Mexico 0.30 11.9 3,563 96 85 1.6 30 446.2 1,570 271.0Micronesia, Fed. Sts. –0.04 0.1 .. .. .. 0.9 .. 0.1 .. ..Moldova –1.77 1.4 281 96 85 1.4 36 4.5 731 3.6Monaco 0.00 98.1 .. 100 100 0.1 .. .. .. ..Mongolia 0.73 13.4 12,428 82 51 2.9 96 14.5 1,189 4.5Montenegro 0.00 11.5 .. 98 90 0.4 .. 3.1 1,303 4.2Morocco –0.23 1.5 899 83 70 1.6 23 48.8 517 22.3Mozambique 0.54 14.8 4,191 47 18 3.1 22 2.6 436 16.7Myanmar 0.93 5.2 20,750 83 76 2.5 40 11.1 292 7.5Namibia 0.97 14.7 2,651 93 32 3.3 42 3.6 702 1.5Nepal 0.70 17.0 6,501 89 31 3.8 27 3.5 341 3.2Netherlands –0.14 15.2 659 100 100 0.9 30 169.7 5,021 118.1New Caledonia 0.00 23.9 .. .. .. 1.4 48 3.0 .. ..New Zealand –0.01 20.0 74,230 100 .. 0.9 11 32.1 4,166 44.8Nicaragua 2.01 36.8 32,318 85 52 1.9 21 4.5 542 3.7Niger 0.98 7.1 218 49 9 5.0 96 1.2 .. ..billionkilowatthours?56 <strong>World</strong> <strong>Development</strong> <strong>Indicators</strong> <strong>2013</strong> Front User guide <strong>World</strong> view People Environment
Environment 3Deforestation aaverageannual %NationallyprotectedareasTerrestrial andmarine areas% of totalterritorial areaInternalrenewablefreshwaterresources bPer capitacubic metersAccess toimprovedwatersource% of totalpopulationAccess toimprovedsanitationfacilities% of totalpopulationUrbanpopulationaverageannual% growthParticulatematterconcentrationurban-populationweightedPM10micrograms percubic meterCarbondioxideemissionsmillionmetric tonsEnergy usePer capitakilograms ofoil equivalentElectricityproduction2000–10 2010 2011 2010 2010 1990–2011 2010 2009 2010 2010Nigeria 3.67 12.6 1,360 58 31 3.8 38 70.2 714 26.1Northern Mariana Islands 0.53 28.4 .. 98 .. 0.5 .. .. .. ..Norway –0.80 10.9 77,124 100 100 1.6 16 47.1 6,637 124.1Oman 0.00 9.3 492 89 99 2.6 95 41.1 7,188 19.8Pakistan 2.24 9.8 311 92 48 2.7 91 161.2 487 94.5Palau –0.18 4.8 .. 85 100 1.6 .. 0.2 .. ..Panama 0.36 11.5 41,275 93 69 2.3 45 7.8 1,073 7.5Papua New Guinea 0.48 1.4 114,203 40 45 2.8 16 3.5 .. ..Paraguay 0.97 5.4 14,311 86 71 2.6 64 4.5 742 54.1Peru 0.18 13.1 54,966 85 71 1.5 42 47.4 667 35.9Philippines –0.75 5.0 5,050 92 74 2.2 17 68.6 434 67.7Poland –0.31 21.8 1,391 .. 90 0.8 33 298.9 2,657 157.1Portugal –0.11 6.1 3,600 99 100 0.1 18 57.4 2,213 53.7Puerto Rico –1.76 4.4 1,915 .. .. –0.3 15 .. .. ..Qatar 0.00 1.4 30 100 100 6.3 20 70.3 12,799 28.1Romania –0.32 7.8 1,978 89 73 –0.2 11 79.5 1,632 60.3Russian Federation 0.00 9.2 30,169 97 70 0.6 15 1,574.4 4,927 1,036.1Rwanda –2.38 10.0 868 65 55 4.6 21 0.7 .. ..Samoa 0.00 1.2 .. 96 98 –0.5 .. 0.2 .. ..San Marino 0.00 .. .. .. .. 0.7 8 .. .. ..São Tomé and Príncipe 0.00 .. 12,936 89 26 2.9 28 0.1 .. ..Saudi Arabia 0.00 29.9 85 .. .. 2.5 96 432.8 6,168 240.1Senegal 0.49 23.5 2,021 72 52 3.4 77 4.6 272 3.0Serbia –0.99 6.0 1,158 99 92 0.2 .. 46.3 2,141 37.4Seychelles 0.00 0.9 .. .. .. 0.1 .. 0.7 .. ..Sierra Leone 0.69 4.3 26,678 55 13 3.2 39 1.4 .. ..Singapore 0.00 3.4 116 100 100 2.1 23 31.9 6,456 45.4Sint Maarten .. .. .. .. .. .. .. .. .. ..Slovak Republic –0.06 23.2 2,334 100 100 –0.7 13 33.9 3,280 27.5Slovenia –0.16 13.1 9,095 99 100 0.1 26 15.3 3,520 16.2Solomon Islands 0.25 0.1 80,939 .. .. 4.8 31 0.2 .. ..Somalia 1.07 0.5 628 29 23 3.6 26 0.6 .. ..South Africa 0.00 6.9 886 91 79 1.9 18 499.0 2,738 256.6South Sudan .. .. .. .. .. 4.7 .. .. .. ..Spain –0.68 7.6 2,408 100 100 0.4 24 288.2 2,773 299.9Sri Lanka 1.12 15.0 2,530 91 92 1.6 65 12.7 478 10.8St. Kitts and Nevis 0.00 0.8 452 99 96 1.5 15 0.3 .. ..St. Lucia –0.07 2.0 .. 96 65 –2.6 31 0.4 .. ..St. Martin 0.00 .. .. .. .. .. .. .. .. ..St. Vincent and Grenadines –0.27 1.2 .. .. .. 0.8 22 0.2 .. ..Sudan 0.08 4.2 672 58 26 2.6 c 137 14.3 371 7.8Suriname 0.01 12.2 166,220 92 83 1.5 20 2.5 .. ..Swaziland –0.84 3.0 2,472 71 57 1.0 30 1.0 .. ..Sweden –0.30 10.0 18,097 100 100 0.9 10 43.7 5,468 148.5Switzerland –0.38 24.9 5,106 100 100 1.2 20 41.6 3,349 66.1Syrian Arab Republic –1.29 0.6 343 90 95 2.5 54 65.3 1,063 46.4Tajikistan 0.00 4.1 9,096 64 94 1.6 29 2.8 336 16.4billionkilowatthoursEconomy States and markets Global links Back<strong>World</strong> <strong>Development</strong> <strong>Indicators</strong> <strong>2013</strong> 57
3 EnvironmentDeforestation aaverageannual %NationallyprotectedareasTerrestrial andmarine areas% of totalterritorial areaInternalrenewablefreshwaterresources bPer capitacubic metersAccess toimprovedwatersource% of totalpopulationAccess toimprovedsanitationfacilities% of totalpopulationUrbanpopulationaverageannual% growthParticulatematterconcentrationurban-populationweightedPM10micrograms percubic meterCarbondioxideemissionsmillionmetric tonsEnergy usePer capitakilograms ofoil equivalentElectricityproduction2000–10 2010 2011 2010 2010 1990–2011 2010 2009 2010 2010Tanzania 1.13 26.9 1,817 53 10 4.8 19 7.0 448 4.4Thailand 0.02 17.3 3,229 96 96 1.7 53 271.7 1,699 159.5Timor-Leste 1.40 6.4 6,986 69 47 4.2 .. 0.2 .. ..Togo 5.13 11.0 1,868 61 13 3.4 27 1.5 446 0.1Tonga 0.00 9.4 .. 100 96 0.9 .. 0.2 .. ..Trinidad and Tobago 0.32 9.6 2,852 94 92 2.3 97 47.8 15,913 8.5Tunisia –1.86 1.3 393 94 85 1.5 23 25.2 913 16.1Turkey –1.11 1.9 3,083 100 90 2.5 35 277.8 1,445 211.2Turkmenistan 0.00 3.0 275 .. 98 1.9 36 48.2 4,226 16.7Turks and Caicos Islands 0.00 3.5 .. 100 .. 2.6 .. 0.2 .. ..Tuvalu 0.00 0.2 .. 98 85 1.0 .. .. .. ..Uganda 2.56 10.3 1,130 72 34 5.9 10 3.5 .. ..Ukraine –0.21 3.6 1,162 98 94 –0.1 15 272.2 2,845 188.6United Arab Emirates –0.24 4.7 19 100 98 5.3 89 156.8 8,271 97.7United Kingdom –0.31 18.1 2,311 100 100 0.9 13 474.6 3,252 378.0United States –0.13 13.7 9,044 99 100 1.0 18 5,299.6 7,164 4,354.4Uruguay –2.14 0.3 17,515 100 100 0.5 112 7.9 1,241 10.8Uzbekistan –0.20 2.3 557 87 100 2.8 31 116.5 1,533 51.7Vanuatu 0.00 0.5 .. 90 57 3.7 14 0.1 .. ..Venezuela, RB 0.60 50.2 24,674 .. .. 1.7 10 184.8 2,669 118.3Vietnam –1.65 4.6 4,092 95 76 3.1 54 142.3 681 94.9Virgin Islands (U.S.) 0.80 1.5 .. .. .. 0.1 .. .. .. ..West Bank and Gaza –0.10 0.6 207 85 92 3.3 .. 2.2 .. ..Yemen, Rep. 0.00 0.7 85 55 53 4.9 34 24.0 298 7.8Zambia 0.33 36.0 5,952 61 48 5.3 27 2.0 628 11.3Zimbabwe 1.88 28.0 961 80 40 2.7 34 8.9 764 8.1<strong>World</strong> 0.11 w 11.9 w 6,115 s 88 w 63 w 2.1 w 41 w 32,042.2 d w 1,851 w 21,448.9 wLow income 0.61 10.0 5,125 65 37 3.6 54 229.8 363 197.4Middle income 0.08 12.0 5,819 90 59 2.3 46 17,344.8 1,310 10,122.1Lower middle income 0.31 8.8 3,121 87 47 2.6 53 3,884.9 667 2,138.2Upper middle income 0.02 13.1 8,550 93 73 2.1 42 13,460.8 1,948 7,981.7Low & middle income 0.15 11.6 5,722 86 56 2.4 47 17,574.2 1,210 10,344.7East Asia & Pacific –0.44 13.3 4,446 90 66 2.9 55 8,936.9 1,520 4,888.8Europe & Central Asia –0.04 7.7 12,498 96 84 0.9 21 2,863.0 3,015 1,884.3Latin America & Carib. 0.45 19.8 22,810 94 79 1.5 28 1,533.7 1,312 1,356.4Middle East & N. Africa –0.15 4.0 673 89 88 2.1 59 1,320.9 1,372 638.4South Asia –0.29 5.6 1,197 90 38 2.7 62 2,215.6 519 1,120.1Sub- Saharan Africa 0.48 11.6 4,455 61 31 3.8 41 724.0 683 441.4High income –0.04 12.7 8,195 100 100 1.0 22 12,727.0 5,000 11,163.7Euro area –0.31 16.5 2,933 100 100 0.6 18 2,456.1 3,633 2,352.4billionkilowatthoursa. Negative values indicate an increase in forest area. b. River flows from other countries are not included because of data unreliability. c. Excludes South Sudan. d. Includes emissionsnot allocated to specific countries.?58 <strong>World</strong> <strong>Development</strong> <strong>Indicators</strong> <strong>2013</strong> Front User guide <strong>World</strong> view People Environment
Environment 3About the dataEnvironmental resources are needed to promote growth and povertyreduction, but growth can create new stresses on the environment.Deforestation, loss of biologically diverse habitat, depletion of waterresources, pollution, urbanization, and ever increasing demand forenergy production are some of the factors that must be consideredin shaping development strategies.collected intermittently and may hide substantial year-to-year variationsin total renewable water resources. Data do not distinguishbetween seasonal and geographic variations in water availabilitywithin countries. Data for small countries and countries in arid andsemiarid zones are less reliable than data for larger countries andcountries with greater rainfall.Loss of forestsForests provide habitat for many species and act as carbon sinks.If properly managed they also provide a livelihood for people whomanage and use forest resources. FAO (2010) uses a uniform definitionof forest to provide information on forest cover in 2010 andadjusted estimates of forest cover in 1990 and 2000. Data presentedhere do not distinguish natural forests from plantations, abreakdown the FAO provides only for developing countries. Thus,data may underestimate the rate at which natural forest is disappearingin some countries.Habitat protection and biodiversityDeforestation is a major cause of loss of biodiversity, and habitatconservation is vital for stemming this loss. Conservation effortshave focused on protecting areas of high biodiversity. The <strong>World</strong>Conservation Monitoring Centre (WCMC) and the United NationsEnvironment Programme (UNEP) compile data on protected areas.Differences in definitions, reporting practices, and reporting periodslimit cross-country comparability. Nationally protected areasare defined using the six International Union for Conservation ofNature (IUCN) categories for areas of at least 1,000 hectares—scientific reserves and strict nature reserves with limited publicaccess, national parks of national or international significance andnot materially affected by human activity, natural monuments andnatural landscapes with unique aspects, managed nature reservesand wildlife sanctuaries, protected landscapes (which may includecultural landscapes), and areas managed mainly for the sustainableuse of natural systems to ensure long-term protection and maintenanceof biological diversity—as well as terrestrial protected areasnot assigned to an IUCN category. Designating an area as protecteddoes not mean that protection is in force. For small countries withprotected areas smaller than 1,000 hectares, the size limit in thedefinition leads to underestimation of protected areas. Due to variationsin consistency and methods of collection, data quality is highlyvariable across countries. Some countries update their informationmore frequently than others, some have more accurate data onextent of coverage, and many underreport the number or extent ofprotected areas.Freshwater resourcesThe data on freshwater resources are derived from estimates ofrunoff into rivers and recharge of groundwater. These estimatesare derived from different sources and refer to different years, socross-country comparisons should be made with caution. Data areWater and sanitationA reliable supply of safe drinking water and sanitary disposal ofexcreta are two of the most important means of improving humanhealth and protecting the environment. Improved sanitation facilitiesprevent human, animal, and insect contact with excreta.Data on access to an improved water source measure the percentageof the population with ready access to water for domestic purposes,based on surveys and estimates of service users providedby governments to the Joint Monitoring Programme of the <strong>World</strong>Health Organization (WHO) and the United Nations Children’s Fund(UNICEF). The coverage rates are based on information from serviceusers on household use rather than on information from serviceproviders, which may include nonfunctioning systems. Access todrinking water from an improved source does not ensure that thewater is safe or adequate, as these characteristics are not testedat the time of survey. While information on access to an improvedwater source is widely used, it is extremely subjective; terms such as“safe,” “improved,” “adequate,” and “reasonable” may have differentmeanings in different countries despite official WHO definitions(see Definitions). Even in high-income countries treated water maynot always be safe to drink. Access to an improved water source isequated with connection to a supply system; it does not account forvariations in the quality and cost of the service.UrbanizationThere is no consistent and universally accepted standard for distinguishingurban from rural areas and, by extension, calculating theirpopulations. Most countries use a classification related to the sizeor characteristics of settlements. Some define areas based on thepresence of certain infrastructure and services. Others designateareas based on administrative arrangements. Because data arebased on national definitions, cross-country comparisons shouldbe made with caution.Air pollutionIndoor and outdoor air pollution place a major burden on worldhealth. More than half the world’s people rely on dung, wood, cropwaste, or coal to meet basic energy needs. Cooking and heating withthese fuels on open fires or stoves without chimneys lead to indoorair pollution, which is responsible for 1.6 million deaths a year—oneevery 20 seconds. In many urban areas air pollution exposure is themain environmental threat to health. Long-term exposure to highlevels of soot and small particles contributes to such health effectsas respiratory diseases, lung cancer, and heart disease. ParticulateEconomy States and markets Global links Back<strong>World</strong> <strong>Development</strong> <strong>Indicators</strong> <strong>2013</strong> 59
3 Environmentpollution, alone or with sulfur dioxide, creates an enormous burdenof ill health.Data on particulate matter are estimated average annual concentrationsin residential areas away from air pollution “hotspots,” suchas industrial districts and transport corridors. Data are estimatesof annual ambient concentrations of particulate matter in cities ofmore than 100,000 people by the <strong>World</strong> Bank’s Agriculture andEnvironmental Services Department.Pollutant concentrations are sensitive to local conditions, andeven monitoring sites in the same city may register different levels.Thus these data should be considered only a general indication ofair quality, and comparisons should be made with caution. Theyallow for cross-country comparisons of the relative risk of particulatematter pollution facing urban residents. Major sources of urbanoutdoor particulate matter pollution are traffic and industrial emissions,but nonanthropogenic sources such as dust storms may alsobe a substantial contributor for some cities. Country technology andpollution controls are important determinants of particulate matter.Current WHO air quality guidelines are annual mean concentrationsof 20 micrograms per cubic meter for particulate matter less than10 microns in diameter.Carbon dioxide emissionsCarbon dioxide emissions are the primary source of greenhousegases, which contribute to global warming, threatening human andnatural habitats. Fossil fuel combustion and cement manufacturingare the primary sources of anthropogenic carbon dioxide emissions,which the U.S. Department of Energy’s Carbon Dioxide InformationAnalysis Center (CDIAC) calculates using data from the UnitedNations Statistics Division’s <strong>World</strong> Energy Data Set and the U.S.Bureau of Mines’s Cement Manufacturing Data Set. Carbon dioxideemissions, often calculated and reported as elemental carbon, wereconverted to actual carbon dioxide mass by multiplying them by3.667 (the ratio of the mass of carbon to that of carbon dioxide).Although estimates of global carbon dioxide emissions are probablyaccurate within 10 percent (as calculated from global average fuelchemistry and use), country estimates may have larger error bounds.Trends estimated from a consistent time series tend to be moreaccurate than individual values. Each year the CDIAC recalculatesthe entire time series since 1949, incorporating recent findings andcorrections. Estimates exclude fuels supplied to ships and aircraftin international transport because of the difficulty of apportioningthe fuels among benefiting countries.Energy useIn developing economies growth in energy use is closely related togrowth in the modern sectors—industry, motorized transport, andurban areas—but also reflects climatic, geographic, and economicfactors. Energy use has been growing rapidly in low- and middleincomeeconomies, but high-income economies still use almost fivetimes as much energy per capita.Total energy use refers to the use of primary energy before transformationto other end-use fuels (such as electricity and refinedpetroleum products). It includes energy from combustible renewablesand waste—solid biomass and animal products, gas andliquid from biomass, and industrial and municipal waste. Biomassis any plant matter used directly as fuel or converted into fuel,heat, or electricity. Data for combustible renewables and wasteare often based on small surveys or other incomplete informationand thus give only a broad impression of developments andare not strictly comparable across countries. The IEA reportsinclude country notes that explain some of these differences (seeData sources). All forms of energy—primary energy and primaryelectricity—are converted into oil equivalents. A notional thermalefficiency of 33 percent is assumed for converting nuclear electricityinto oil equivalents and 100 percent efficiency for convertinghydroelectric power.Electricity productionUse of energy is important in improving people’s standard of living.But electricity generation also can damage the environment.Whether such damage occurs depends largely on how electricityis generated. For example, burning coal releases twice as muchcarbon dioxide—a major contributor to global warming—as doesburning an equivalent amount of natural gas. Nuclear energy doesnot generate carbon dioxide emissions, but it produces other dangerouswaste products.The International Energy Agency (IEA) compiles data and dataon energy inputs used to generate electricity. Data for countriesthat are not members of the Organisation for Economic Co-operationand <strong>Development</strong> (OECD) are based on national energy dataadjusted to conform to annual questionnaires completed by OECDmember governments. In addition, estimates are sometimes madeto complete major aggregates from which key data are missing,and adjustments are made to compensate for differences in definitions.The IEA makes these estimates in consultation with nationalstatistical offices, oil companies, electric utilities, and nationalenergy experts. It occasionally revises its time series to reflectpolitical changes. For example, the IEA has constructed historicalenergy statistics for countries of the former Soviet Union. In addition,energy statistics for other countries have undergone continuouschanges in coverage or methodology in recent years as moredetailed energy accounts have become available. Breaks in seriesare therefore unavoidable.?60 <strong>World</strong> <strong>Development</strong> <strong>Indicators</strong> <strong>2013</strong> Front User guide <strong>World</strong> view People Environment
Environment 3Definitions• Deforestation is the permanent conversion of natural forest areato other uses, including agriculture, ranching, settlements, andinfrastructure. Deforested areas do not include areas logged butintended for regeneration or areas degraded by fuelwood gathering,acid precipitation, or forest fires. • Nationally protected areas areterrestrial and marine protected areas as a percentage of total territorialarea and include all nationally designated protected areaswith known location and extent. All overlaps between different designationsand categories, buffered points, and polygons are removed,and all undated protected areas are dated. • Internal renewablefreshwater resources are the average annual flows of rivers andgroundwater from rainfall in the country. Natural incoming flows originatingoutside a country’s borders and overlapping water resourcesbetween surface runoff and groundwater recharge are excluded.• Access to an improved water source is the percentage of thepopulation with reasonable access to an adequate amount of waterfrom an improved source, such as piped water into a dwelling, plot,or yard; public tap or standpipe; tubewell or borehole; protected dugwell or spring; and rainwater collection. Unimproved sources includeunprotected dug wells or springs, carts with small tank or drum,bottled water, and tanker trucks. Reasonable access is defined asthe availability of at least 20 liters a person a day from a sourcewithin 1 kilometer of the dwelling • Access to improved sanitationfacilities is the percentage of the population with at least adequateaccess to excreta disposal facilities (private or shared, but not public)that can effectively prevent human, animal, and insect contactwith excreta (facilities do not have to include treatment to rendersewage outflows innocuous). Improved facilities range from simplebut protected pit latrines to flush toilets with a sewerage connection.To be effective, facilities must be correctly constructed and properlymaintained. • Urban population is the midyear population of areasdefined as urban in each country and reported to the United Nationsdivided by the <strong>World</strong> Bank estimate of total population. • Particulatematter concentration is fine suspended particulates of less than10 microns in diameter (PM10) that are capable of penetrating deepinto the respiratory tract and causing severe health damage. Dataare urban-population-weighted PM10 levels in residential areas ofcities with more than 100,000 residents. • Carbon dioxide emissionsare emissions from the burning of fossil fuels and the manufactureof cement and include carbon dioxide produced during consumptionof solid, liquid, and gas fuels and gas flaring. • Energy userefers to the use of primary energy before transformation to otherend use fuels, which equals indigenous production plus importsand stock changes, minus exports and fuels supplied to ships andaircraft engaged in international transport. • Electricity productionis measured at the terminals of all alternator sets in a station. Inaddition to hydropower, coal, oil, gas, and nuclear power generation,it covers generation by geothermal, solar, wind, and tide and waveenergy as well as that from combustible renewables and waste. Productionincludes the output of electric plants designed to produceelectricity only, as well as that of combined heat and power plants.Data sourcesData on deforestation are from FAO (2010) and the FAO’s datawebsite. Data on protected areas, derived from the UNEP andWCMC online databases, are based on data from national authorities,national legislation, and international agreements. Data onfreshwater resources are from the FAO’s AQUASTAT database. Dataon access to water and sanitation are from WHO and UNICEF (2012).Data on urban population are from the United Nations PopulationDivision (2011). Data on particulate matter concentrations are <strong>World</strong>Bank estimates. Data on carbon dioxide emissions are from theCDIAC. Data on energy use and electricity production are from IEAelectronic files and published in IEA’s annual publications, EnergyStatistics of Non-OECD Countries, Energy Balances of Non-OECDCountries, Energy Statistics of OECD Countries, and Energy Balancesof OECD Countries.ReferencesCDIAC (Carbon Dioxide Information Analysis Center). n.d. Online database.http://cdiac.ornl.gov/home.html. Oak Ridge National Laboratory,Environmental Science Division, Oak Ridge, TN.FAO (Food and Agriculture Organization of the United Nations). 2010.Global Forest Resources Assessment 2010. Rome.———. n.d. AQUASTAT. Online database. www.fao.org/nr/water/aquastat/data/query/index.html. Rome.IEA (International Energy Agency). Various years. Energy Balances ofNon-OECD Countries. Paris.———.Various years. Energy Balances of OECD Countries. Paris.———. Various years. Energy Statistics of Non-OECD Countries. Paris.———.Various years. Energy Statistics of OECD Countries. Paris.UNEP (United Nations Environment Programme) and WCMC (<strong>World</strong>Conservation Monitoring Centre). 2012. Online databases www.unep-wcmc-apps.org/species/dbases/about.cfm. Nairobi.United Nations Population Division. 2011. <strong>World</strong> Urbanization Prospects:The 2011 Revision. New York: United Nations, Department ofEconomic and Social Affairs.WHO (<strong>World</strong> Health Organization). 2004. Inheriting the <strong>World</strong>: TheAtlas of Children’s Health and the Environment. www.who.int/ceh/publications/atlas/en/index.html. Geneva.WHO (<strong>World</strong> Health Organization) and UNICEF (United Nations Children’sFund). 2012. Progress on Sanitation and Drinking Water.Geneva: WHO.Economy States and markets Global links Back<strong>World</strong> <strong>Development</strong> <strong>Indicators</strong> <strong>2013</strong> 61
3 EnvironmentOnline tables and indicatorsTo access the <strong>World</strong> <strong>Development</strong> <strong>Indicators</strong> online tables, usethe URL http://wdi.worldbank.org/table/ and the table number (forexample, http://wdi.worldbank.org/table/3.1). To view a specificindicator online, use the URL http://data.worldbank.org/indicator/and the indicator code (for example, http://data.worldbank.org/indicator/SP.RUR.TOTL.ZS).3.1 Rural environment and land useRural populationSP.RUR.TOTL.ZSAnnual freshwater withdrawals, % foragricultureER.H2O.FWAG.ZSRural population growthLand areaForest areaPermanent croplandArable land, % of land areaArable land, hectares per personSP.RUR.TOTL.ZGAG.LND.TOTL.K2AG.LND.FRST.ZSAG.LND.CROP.ZSAG.LND.ARBL.ZSAG.LND.ARBL.HA.PCAnnual freshwater withdrawals, % forindustryAnnual freshwater withdrawals, % ofdomesticWater productivity, GDP/water useAccess to an improved water source, % ofrural populationER.H2O.FWIN.ZSER.H2O.FWDM.ZSER.GDP.FWTL.M3.KDSH.H2O.SAFE.RU.ZS3.2 Agricultural inputsAgricultural land, % of land areaAG.LND.AGRI.ZSAccess to an improved water source, % ofurban populationSH.H2O.SAFE.UR.ZSAgricultural land, % irrigatedAverage annual precipitationLand under cereal productionFertilizer consumption, % of fertilizerproductionFertilizer consumption, kilograms perhectare of arable landAgricultural employmentTractorsAG.LND.IRIG.AG.ZSAG.LND.PRCP.MMAG.LND.CREL.HAAG.CON.FERT.PT.ZSAG.CON.FERT.ZSSL.AGR.EMPL.ZSAG.LND.TRAC.ZS3.6 Energy production and useEnergy productionEnergy useEnergy use, Average annual growthEnergy use, Per capitaFossil fuelCombustible renewable and wasteAlternative and nuclear energy productionEG.EGY.PROD.KT.OEEG.USE.COMM.KT.OE.. a,bEG.USE.PCAP.KG.OEEG.USE.COMM.FO.ZSEG.USE.CRNW.ZSEG.USE.COMM.CL.ZS3.3 Agricultural output and productivityCrop production indexFood production indexLivestock production indexCereal yieldAgriculture value added per worker3.4 Deforestation and biodiversityForest areaAverage annual deforestationThreatened species, MammalsThreatened species, BirdsThreatened species, FishesThreatened species, Higher plantsTerrestrial protected areasMarine protected areas3.5 FreshwaterInternal renewable freshwater resourcesInternal renewable freshwater resources,Per capitaAnnual freshwater withdrawals, cu. mAnnual freshwater withdrawals, % ofinternal resourcesAG.PRD.CROP.XDAG.PRD.FOOD.XDAG.PRD.LVSK.XDAG.YLD.CREL.KGEA.PRD.AGRI.KDAG.LND.FRST.K2.. a,bEN.MAM.THRD.NOEN.BIR.THRD.NOEN.FSH.THRD.NOEN.HPT.THRD.NOER.LND.PTLD.ZSER.MRN.PTMR.ZSER.H2O.INTR.K3ER.H2O.INTR.PCER.H2O.FWTL.K3ER.H2O.FWTL.ZS3.7 Electricity production, sources, and accessElectricity productionCoal sourcesNatural gas sourcesOil sourcesHydropower sourcesRenewable sourcesNuclear power sourcesAccess to electricityEG.ELC.PROD.KHEG.ELC.COAL.ZSEG.ELC.NGAS.ZSEG.ELC.PETR.ZSEG.ELC.HYRO.ZSEG.ELC.RNWX.ZSEG.ELC.NUCL.ZSEG.ELC.ACCS.ZS3.8 Energy dependency, efficiency and carbon dioxideemissionsNet energy importsGDP per unit of energy useCarbon dioxide emissions, TotalCarbon dioxide emissions, Carbon intensityCarbon dioxide emissions, Per capitaEG.IMP.CONS.ZSEG.GDP.PUSE.KO.PP.KDEN.ATM.CO2E.KTEN.ATM.CO2E.EG.ZSEN.ATM.CO2E.PCCarbon dioxide emissions, kilograms per2005 PPP $ of GDP EN.ATM.CO2E.PP.GD.KD3.9 Trends in greenhouse gas emissionsCarbon dioxide emissions, Average annualgrowthCarbon dioxide emissions, % changeMethane emissions, Total.. a,b.. a,bEN.ATM.METH.KT.CE?62 <strong>World</strong> <strong>Development</strong> <strong>Indicators</strong> <strong>2013</strong> Front User guide <strong>World</strong> view People Environment
Environment 3Methane emissions, % changeMethane emissions, From energy processesMethane emissions, AgriculturalNitrous oxide emissions, TotalNitrous oxide emissions, % changeNitrous oxide emissions, Energy and industryNitrous oxide emissions, AgricultureOther greenhouse gas emissions, TotalOther greenhouse gas emissions, % change3.10 Carbon dioxide emissions by sectorElectricity and heat productionManufacturing industries and constructionResidential buildings and commercial andpublic servicesTransportOther sectors.. a,bEN.ATM.METH.EG.ZSEN.ATM.METH.AG.ZSEN.ATM.NOXE.KT.CE.. a,bEN.ATM.NOXE.EI.ZSEN.ATM.NOXE.AG.ZSEN.ATM.GHGO.KT.CE3.11 Climate variability, exposure to impact, andresilienceAverage daily minimum/maximum temperatureProjected annual temperatureProjected annual cool days/cold nightsProjected annual hot days/warm nightsProjected annual precipitationLand area with an elevation of 5 meters or less.. a,bEN.CO2.ETOT.ZSEN.CO2.MANF.ZSEN.CO2.BLDG.ZSEN.CO2.TRAN.ZSEN.CO2.OTHX.ZS.. b.. b.. b.. b.. bAG.LND.EL5M.ZSPopulation living in areas with elevation of5 meters or less EN.POP.EL5M.ZSPopulation affected by droughts, floods,and extreme temperaturesDisaster risk reduction progress score3.12 UrbanizationUrban populationUrban population, % of total populationUrban population, Average annual growthEN.CLC.MDAT.ZSEN.CLC.DRSK.XQSP.URB.TOTLSP.URB.TOTL.IN.ZSSP.URB.GROWPopulation in urban agglomerations ofmore than 1 millionPopulation in the largest cityEN.URB.MCTY.TL.ZSEN.URB.LCTY.UR.ZSAccess to improved sanitation facilities,% of urban population SH.STA.ACSN.URAccess to improved sanitation facilities,% of rural population SH.STA.ACSN.RU3.13 Traffic and congestionMotor vehicles, Per 1,000 peopleMotor vehicles, Per kilometer of roadPassenger carsRoad densityRoad sector energy consumption, % of totalconsumptionRoad sector energy consumption, Per capitaDiesel fuel consumptionGasoline fuel consumptionPump price for super grade gasolinePump price for dieselUrban-population-weighted particulatematter concentrations (PM10)3.14 Air pollutionThis table provides air pollution data formajor cities.IS.VEH.NVEH.P3IS.VEH.ROAD.K1IS.VEH.PCAR.P3IS.ROD.DNST.K2IS.ROD.ENGY.ZSIS.ROD.ENGY.PCIS.ROD.DESL.PCIS.ROD.SGAS.PCEP.PMP.SGAS.CDEP.PMP.DESL.CDEN.ATM.PM10.MC.M33.15 Contribution of natural resources to gross domesticproductTotal natural resources rentsOil rentsNatural gas rentsCoal rentsMineral rentsForest rents.. bNY.GDP.TOTL.RT.ZSNY.GDP.PETR.RT.ZSNY.GDP.NGAS.RT.ZSNY.GDP.COAL.RT.ZSNY.GDP.MINR.RT.ZSNY.GDP.FRST.RT.ZSa. Derived from data elsewhere in the <strong>World</strong> <strong>Development</strong> <strong>Indicators</strong> database.b. Available online only as part of the table, not as an individual indicator.Economy States and markets Global links Back<strong>World</strong> <strong>Development</strong> <strong>Indicators</strong> <strong>2013</strong> 63
ECONOMY64 <strong>World</strong> <strong>Development</strong> <strong>Indicators</strong> <strong>2013</strong> Front ? User guide <strong>World</strong> view People Environment
The data in the Economy section provide a pictureof the global economy and the economicactivity of more than 200 countries and territoriesthat produce, trade, and consumethe world’s output. They include measures ofmacroeconomic performance and stabilityand broader measures of income and savingsadjusted for pollution, depreciation, and depletionof resources.The world economy grew 2.3 percent in 2012,to reach $71 trillion, and the share from developingeconomies grew to 34.3 percent. Growth isexpected to remain around 2.4 percent in <strong>2013</strong>.Low- and middle-income economies, estimatedto have grown 5.1 percent in 2012, are projectedto expand 5.5 percent in <strong>2013</strong>. Growth in highincomeeconomies has been downgraded fromearlier forecasts to 1.3 percent in 2012 and<strong>2013</strong>.Beginning in August 2012, the InternationalMonetary Fund implemented the Balance ofPayments Manual 6 (BPM6) framework in itsmajor statistical publications. The <strong>World</strong> Bankwill implement BPM6 in its online databasesand publications in April <strong>2013</strong>. Balance of paymentsdata for 2005 onward will be presentedin accord with the BPM6. The historical BPM5data series will end with data for 2008, whichcan be accessed through the <strong>World</strong> <strong>Development</strong><strong>Indicators</strong> archives.The change to the BPM6 framework will affectsome components of the balance of payments.In the current account, “merchanting”—the purchaseof goods from a nonresident and the subsequentresale to another nonresident withoutthe goods being present in the economy—hasbeen reclassified from services to goods, whilemanufacturing services performed on physicalinputs owned by others along with maintenanceand repair services were reclassified from goodsto services. In the capital account, reverseinvestment in direct investment has beenreclassified to present assets and liabilities ona gross basis in the balance of payments andinternational investment position. No changeswere made to the balances on current account,capital account, or financial account. Levels ofreserves were not adjusted, nor were net errorsand omissions.For many economies changes to major aggregatesand balancing items will be limited. Thechange in the methodology for “goods for processing”results in increases in imports andexports of services (equivalent to the amountsreceived or paid for manufacturing services) andlarger reductions in gross imports and exports ofgoods (due to the elimination of imputed transactionsin goods that do not change ownership),though net goods and services trade may not beaffected. The change in the recording of reverseinvestment in foreign direct investment will resultin substantial increases in both internationalinvestment position assets and liabilities formany economies under BPM6, though net internationalinvestment position is not affected bythis change.The complete balance of payments methodologycan be accessed through the InternationalMonetary Fund website (www.imf.org/external/np/sta/bop/bop.htm).4Economy States and markets Global links Back<strong>World</strong> <strong>Development</strong> <strong>Indicators</strong> <strong>2013</strong> 65
HighlightsEast Asia & Pacific: Service sector has potential for more growthValue added in services as a share of GDP, 2010 (%)100755025Larger thanexpectedKiribatiFijiPhilippinesMongoliaChinaVietnamCambodiaThailandIndonesiaLao PDRPapua New GuineaTongaSamoaMalaysia0500 5,000 50,000GDP per capita, 2010 (2005 PPP $, log scale)Source: <strong>World</strong> <strong>Development</strong> <strong>Indicators</strong> database.SmallerthanexpectedThe service sector contributed substantially to gross domestic product(GDP) growth in many East Asia and Pacific economies in recent years,constituting nearly half of GDP and contributing 3.7 percentage pointsto an overall growth rate of 8.5 percent. Reflecting strong domesticdemand, continuing growth of services is consistent with long-termtrends of rising incomes in other regions. But despite recent growth,the service sector in many East Asia and Pacific economies is smallerthan expected based on average income. This reflects the relativesuccess of manufacturing among the countries in the region. It mayalso be the result of limited adoption of high-value, modern services(information and communications technology, finance and professionalbusiness services). Few East Asia and Pacific countries besides thePhilippines have developed robust industries focused on exportingmodern services (<strong>World</strong> Bank 2012a; Asian <strong>Development</strong> Bank 2012).Europe & Central Asia: Volatile food and energy prices pose a challengeNet energy exports or imports, 2010 (% of energy use)AzerbaijanTurkmenistanKazakhstanRussian FederationUzbekistanMontenegroRomaniaAlbaniaKosovoBosnia & HerzegovinaSerbiaPolandTajikistanBulgariaUkraineMacedonia, FYRCroatiaGeorgiaKyrgyz Rep.ArmeniaTurkeyBelarusMoldovaNet energyexportersNet energyimporters–500 –250 0 250Europe and Central Asia is in general a net exporter of energy, but manyeconomies in the region depend heavily on energy imports and arethus vulnerable to sudden price changes. Azerbaijan, Kazakhstan, theRussian Federation, Turkmenistan, and Uzbekistan, the main exporters,stand to benefit from rising world energy prices. But net energyimports account for 96 percent of energy use in Moldova, 84 percentin Belarus, 69 percent in Turkey, 64 percent in Armenia, and 59 percentin the Kyrgyz Republic. Most energy imports are oil, but Belarus,Croatia, Poland, and Serbia are also large importers of electricity.Some of these economies may face an acute deterioration of theirbalance of payments positions if oil prices rise. And some are alsovulnerable to rising food prices, triggered by the substitution of cropbasedfuels for petroleum-based fuels.Source: Online table 3.9.Latin America & Caribbean: Tracking global uncertaintiesGDP growth (%)10GDP growth in Latin America and the Caribbean fell 1.7 percentagepoints from 2011 to 3.0 percent in 2012, the second largest dropamong developing country regions after Europe and Central Asia, where50Latin America& CaribbeanChileBrazilgrowth fell 2.8 percentage points. The region’s GDP growth decelerateddue to slowing domestic demand and a weak external environment. Theslowdown was particularly severe in Brazil, the region’s largest economy,where global uncertainties and earlier fiscal, monetary, and creditpolicy tightening to contain inflation risks had a large impact, especially–5Mexicoon private investment. In Chile growth remained buoyant and continuedto expand briskly, if slightly slower than in 2011. Growth in CentralAmerica and the Caribbean slowed modestly, while growth in Mexico(the second largest economy in the region) rose slightly in 2012, to 4–102007 2008Source: Online table 4.1.2009201020112012percent, benefiting from the fairly strong recovery in U.S. manufacturing(De la Torre, Didier, and Pienknagura 2012; <strong>World</strong> Bank <strong>2013</strong>).66 <strong>World</strong> <strong>Development</strong> <strong>Indicators</strong> <strong>2013</strong>Front ? User guide <strong>World</strong> view People Environment
Middle East & North Africa: Recovery has been slowMacroeconomic fundamentals weakened in most Middle East andNorth Africa countries in 2011 and 2012, as growth slowed andgovernments responded to social pressures with expansionary fis-GDP growth (%)10Lebanoncal policies. High oil prices heightened current account and fiscaldeficits in oil importers, especially in places where governments5Moroccosubsidize energy use. Domestic pressures coupled with a challengingglobal environment and spillovers from regional events alsoweighed heavily on the economies of some oil importers such as0Egypt, Arab Rep.AlgeriaJordanTunisiaJordan, Lebanon, and Morocco. Postrevolutionary economies such–5as the Arab Republic of Egypt, Tunisia, and the Republic of Yemenare recovering after the Arab Spring turmoil. However, recovery has–10Yemen, Rep.taken place in a weak global environment. The transition in thesecountries is far from complete, and uncertainty around the reform processcontinues to constrain private investment (<strong>World</strong> Bank 2012b).–152007 2008Source: Online table 4.1.2009201020112012South Asia: Revenues are low and stagnatingSouth Asian countries collect exceptionally low levels of tax revenue.Revenue collection by central governments in the region averages10–15 percent of GDP, compared with 20 percent in similar develop-Tax revenue (% of GDP)20ing economies and higher rates in more developed economies. In mostSouth Asian countries the major source of revenue is the value addedtax. Some are changing their tax structures—India is adopting a goodsand services tax, for example—but the main problem remains lowcollection rates for the value added tax and income tax. Most South1510Sri LankaMaldivesPakistanIndiaNepalAsian countries have outdated tax laws and inadequate institutionalarrangements unsuitable to the growing complexity of their economies.South Asian countries all need to upgrade their infrastructure andimprove social services such as education and health care, which will5BangladeshBhutanAfghanistanrequire a substantial increase in fiscal spending and better sourcesof revenue (<strong>World</strong> Bank 2012c).02000 2002Source: Online table 5.6.2004200620082010 2011Sub- Saharan Africa: Resilient growth in an uncertain global economic environmentDespite a sluggish global economy, economic conditions in Sub-Saharan Africa held up well in 2011–12. Robust domestic demand,high commodity prices, rising export volumes (due to new capacity inthe natural resources sector), and steady remittance flows supportedgrowth in 2012. GDP in Sub- Saharan Africa expanded at an average ofGDP growth (%)25Angola204.9 percent a year over 2000–11 and rose an estimated 4.6 percentin 2012, the third most among developing regions. Excluding SouthAfrica, the region’s largest economy, GDP output rose 5.8 percentin 2012, with a third of countries growing at least 6 percent. Growthvaried across the region, with steady expansion in most low-incomecountries but slow growth in middle-income countries, such as SouthAfrica, that are more tightly integrated with the global economy and151050Sub-Saharan AfricaSouth AfricaNigeriaMaliin some countries affected by political instability, such as Mali (IMF2012; <strong>World</strong> Bank <strong>2013</strong>).–52007 2008Source: Online table 4.1.2009201020112012Economy States and markets Global links Back<strong>World</strong> <strong>Development</strong> <strong>Indicators</strong> <strong>2013</strong> 67
4 EconomyGross domestic productGrosssavingsAdjustednet savingsCurrentaccountbalanceCentralgovernmentcash surplusor deficitCentralgovernmentdebtConsumerprice indexBroadmoneyaverage annual % growthEstimate Forecast % of GDP % of GNI % of GDP % of GDP % of GDP % growth % of GDP2000–11 2011–12 2012–13 2011 2011 2011 2011 2011 2011 2011Afghanistan .. .. .. .. .. .. –0.6 .. 5.7 35.8Albania 5.2 0.8 1.6 12.7 0.9 –12.1 .. .. 3.5 81.8Algeria 3.7 3.0 3.4 48.4 25.3 10.4 –0.3 .. 4.5 64.6American Samoa .. .. .. .. .. .. .. .. .. ..Andorra 5.9 .. .. .. .. .. .. .. .. ..Angola 12.2 8.1 7.2 20.2 –21.4 12.5 .. .. 13.5 35.9Antigua and Barbuda 2.7 1.7 2.4 26.8 .. –10.7 .. .. 3.5 101.4Argentina .. .. .. 22.3 11.3 0.0 .. .. .. 28.8Armenia 8.2 6.8 4.3 19.3 8.7 –10.8 –2.7 .. 7.7 29.5Aruba .. .. .. .. .. .. .. .. 4.4 ..Australia 3.1 .. .. 22.9 6.8 –2.8 –3.7 30.7 3.4 105.8Austria a 1.8 .. .. 25.5 16.4 0.5 –2.2 75.0 3.3 ..Azerbaijan 16.0 2.0 4.2 45.9 7.5 27.0 1.4 6.4 7.9 27.8Bahamas, The 0.5 .. .. 11.5 .. –14.0 –3.5 .. 3.2 80.5Bahrain 6.3 .. .. 30.1 9.6 3.4 .. .. –0.4 91.2Bangladesh 6.0 6.1 6.0 36.5 25.0 0.2 –0.9 .. 10.7 68.7Barbados 0.9 .. .. 16.9 .. –5.3 –8.6 104.4 9.4 152.3Belarus 7.8 2.8 4.0 26.3 17.6 –10.5 1.9 44.2 53.2 40.5Belgium a 1.5 .. .. 22.3 14.1 –1.4 –3.6 91.0 3.5 ..Belize 3.7 4.0 2.8 .. .. –2.2 –1.6 .. –2.5 76.0Benin 3.8 3.5 3.8 13.1 7.7 –8.1 –1.4 .. 2.7 40.0Bermuda 1.9 .. .. .. .. .. .. .. .. ..Bhutan 8.5 .. .. .. .. .. 0.5 56.8 8.8 67.1Bolivia 4.2 4.7 4.4 26.1 6.9 2.2 .. .. 9.8 68.7Bosnia and Herzegovina 4.2 .. .. 13.1 .. –8.8 –1.2 .. 3.7 56.7Botswana 4.0 5.8 5.1 27.7 20.4 0.3 –1.7 .. 8.9 37.8Brazil 3.8 0.9 3.4 17.2 6.8 –2.1 –2.6 52.8 6.6 74.4Brunei Darussalam 1.2 .. .. 50.9 10.1 37.1 .. .. 2.0 67.2Bulgaria 4.3 0.8 1.8 23.6 13.7 0.4 –2.0 15.5 4.2 75.6Burkina Faso 5.8 6.4 6.7 15.6 5.5 –4.6 –2.4 .. 2.8 29.0Burundi 3.5 4.1 4.3 1.7 –6.1 –12.2 .. .. 9.7 24.2Cambodia 8.4 6.6 6.7 10.6 3.4 –5.5 –4.2 .. 5.5 39.1Cameroon 3.2 4.6 4.8 12.2 0.8 –3.8 .. .. 2.9 23.1Canada 1.9 .. .. 19.6 6.7 –2.8 –1.3 53.8 2.9 ..Cape Verde 6.2 4.8 4.9 22.2 16.7 –16.0 –3.7 .. 4.5 77.0Cayman Islands .. .. .. .. .. .. .. .. .. ..Central African Republic 1.3 3.8 4.0 .. .. .. .. .. 1.3 19.2Chad 8.7 .. .. .. .. .. .. .. –4.9 13.8Channel Islands 0.5 .. .. .. .. .. .. .. .. ..Chile 4.1 5.8 5.1 24.9 5.4 1.8 1.3 .. 3.3 76.1China 10.8 7.9 8.4 52.7 36.4 2.8 .. .. 5.4 180.1Hong Kong SAR, China 4.6 .. .. 29.4 18.1 5.2 4.1 35.5 5.3 328.2Macao SAR, China 12.5 .. .. 55.9 .. 42.7 25.0 .. 5.8 101.9Colombia 4.5 3.5 3.8 19.1 1.3 –3.0 0.3 53.2 3.4 39.9Comoros 1.9 2.5 3.5 .. .. .. .. .. 0.9 34.9Congo, Dem. Rep. 5.6 6.6 8.2 .. .. .. 3.8 .. .. 16.8Congo, Rep. 4.5 4.7 5.6 .. .. .. .. .. 1.3 27.068 <strong>World</strong> <strong>Development</strong> <strong>Indicators</strong> <strong>2013</strong> Front ? User guide <strong>World</strong> view People Environment
Economy 4Gross domestic productGrosssavingsAdjustednet savingsCurrentaccountbalanceCentralgovernmentcash surplusor deficitCentralgovernmentdebtConsumerprice indexBroadmoneyaverage annual % growthEstimate Forecast % of GDP % of GNI % of GDP % of GDP % of GDP % growth % of GDP2000–11 2011–12 2012–13 2011 2011 2011 2011 2011 2011 2011Costa Rica 4.8 4.6 4.0 14.7 9.0 –5.3 –3.5 .. 4.9 49.8Côte d’Ivoire 1.0 8.2 7.0 12.7 4.1 2.0 .. .. 4.9 40.5Croatia 2.6 .. .. 19.9 10.7 –0.7 –4.6 .. 2.3 72.9Cuba 6.1 .. .. .. .. .. .. .. .. ..Curaçao .. .. .. .. .. .. .. .. .. ..Cyprus a 2.9 b .. .. 8.8 b 4.6 b –4.7 –6.3 114.0 3.3 ..Czech Republic 3.7 .. .. 21.7 12.6 –2.9 –4.4 38.1 1.9 73.9Denmark 0.8 .. .. 23.5 15.0 5.7 –2.0 50.6 2.8 74.0Djibouti 4.0 .. .. .. .. –6.8 .. .. 4.4 89.7Dominica 3.5 0.4 1.2 5.0 –3.7 –17.5 .. .. 2.4 86.7Dominican Republic 5.7 3.0 4.3 8.4 –1.7 –8.1 –2.9 .. 8.5 33.4Ecuador 4.8 4.5 3.9 22.8 –3.2 –0.4 .. .. 4.5 35.6Egypt, Arab Rep. 5.0 2.4 3.2 16.9 1.4 –2.4 –10.1 .. 10.1 76.1El Salvador 2.0 1.8 2.3 8.9 0.7 –4.6 –2.2 48.0 5.1 45.7Equatorial Guinea 14.4 .. .. .. .. .. .. .. 6.9 11.5Eritrea 0.9 7.5 6.0 .. .. .. .. .. .. 114.7Estonia a 3.9 .. .. 25.1 16.3 2.2 1.0 7.1 5.0 59.8Ethiopia 8.9 7.8 7.5 27.3 17.6 –2.6 –1.4 .. 33.2 ..Faeroe Islands .. .. .. .. .. –0.7 .. .. .. ..Fiji 1.2 .. .. .. .. –13.0 .. .. 8.7 66.3Finland a 1.9 .. .. 19.7 11.5 –1.2 –0.5 47.8 3.4 ..France a 1.2 .. .. 17.9 9.0 –2.0 –5.2 93.9 2.1 ..French Polynesia .. .. .. .. .. .. .. .. .. ..Gabon 2.4 4.7 3.5 .. .. .. .. .. 1.3 22.1Gambia, The 3.4 3.9 10.7 12.1 6.6 7.5 .. .. 4.8 54.9Georgia 6.6 c 4.9 c 5.1 c 13.9 c 4.9 c –11.8 –1.2 32.6 49.4 29.3Germany a 1.1 .. .. 23.9 13.8 5.6 –0.4 55.6 2.1 ..Ghana 6.3 7.5 7.8 8.8 –6.6 –8.9 –4.0 .. 8.7 30.8Greece a 1.8 .. .. 5.4 –5.5 –9.9 –9.8 106.5 3.3 ..Greenland 1.7 .. .. .. .. .. .. .. .. ..Grenada 2.2 .. .. –5.7 .. –26.6 –3.0 .. 3.0 94.3Guam .. .. .. .. .. .. .. .. .. ..Guatemala 3.6 3.1 3.2 10.7 0.9 –3.1 –2.8 24.6 6.2 45.5Guinea 2.6 4.8 5.0 –6.5 –27.7 –22.8 .. .. 21.4 36.4Guinea-Bissau 2.5 –2.8 3.0 .. .. –8.5 .. .. 5.0 40.5Guyana 2.5 .. .. 14.5 –1.3 –7.1 .. .. 5.0 65.8Haiti 0.7 2.2 6.0 24.6 17.0 –4.6 .. .. 8.4 47.2Honduras 4.4 3.3 3.7 17.9 11.0 –8.6 –2.6 .. 6.8 52.2Hungary 1.9 .. .. 20.6 13.0 0.9 3.6 80.9 4.0 63.7Iceland 2.7 .. .. 7.3 0.9 –6.9 –5.3 119.3 4.0 96.3India 7.8 5.5 5.9 34.6 22.5 –3.0 –3.7 48.5 8.9 76.7Indonesia 5.4 6.1 6.3 31.8 17.1 0.2 –1.1 26.2 5.4 38.8Iran, Islamic Rep. 5.4 .. .. .. .. .. 0.5 .. 20.6 45.0Iraq 1.1 .. .. .. .. 22.7 .. .. 2.9 54.9Ireland a 2.4 .. .. 14.0 5.5 1.2 –13.5 106.0 2.6 ..Isle of Man 6.2 .. .. .. .. .. .. .. .. ..Israel 3.6 .. .. 14.7 6.3 0.1 –4.4 .. 3.5 104.5Economy States and markets Global links Back<strong>World</strong> <strong>Development</strong> <strong>Indicators</strong> <strong>2013</strong> 69
4 EconomyGross domestic productGrosssavingsAdjustednet savingsCurrentaccountbalanceCentralgovernmentcash surplusor deficitCentralgovernmentdebtConsumerprice indexBroadmoneyaverage annual % growthEstimate Forecast % of GDP % of GNI % of GDP % of GDP % of GDP % growth % of GDP2000–11 2011–12 2012–13 2011 2011 2011 2011 2011 2011 2011Italy a 0.4 .. .. 16.4 6.8 –3.1 –3.5 110.8 2.7 ..Jamaica .. .. .. 8.4 1.3 –14.3 –5.1 .. 7.5 50.8Japan 0.7 .. .. 21.7 10.4 2.0 –8.3 175.0 –0.3 239.2Jordan 6.5 3.0 3.3 13.4 5.8 –12.0 –6.8 61.9 4.4 129.6Kazakhstan 8.0 5.0 5.5 29.7 –4.3 7.5 7.7 9.9 8.3 35.4Kenya 4.4 4.3 4.9 13.5 11.3 –9.9 –4.6 .. 14.0 51.0Kiribati 0.4 .. .. .. .. .. .. .. .. ..Korea, Dem. Rep. .. .. .. .. .. .. .. .. .. ..Korea, Rep. 4.0 .. .. 31.5 22.2 2.4 1.8 .. 4.0 78.1Kosovo 5.2 .. .. .. .. .. .. .. 7.3 41.0Kuwait 6.0 .. .. 48.7 12.2 29.6 25.0 .. 4.7 56.9Kyrgyz Republic 4.4 1.0 8.5 18.2 5.6 –6.1 –4.8 .. 16.5 ..Lao PDR 7.3 8.2 7.5 16.3 –1.7 –2.5 –0.9 .. 7.6 35.9Latvia 4.1 5.3 3.0 26.1 18.5 –2.2 –2.9 42.5 4.4 47.0Lebanon 5.0 1.7 2.8 11.5 0.8 –12.1 –5.9 .. 4.0 242.0Lesotho 3.8 4.3 5.2 15.1 .. –21.4 .. .. 5.0 37.9Liberia 6.0 .. .. 30.4 23.0 –48.9 0.0 .. 8.5 38.2Libya 5.4 .. .. .. .. 15.0 .. .. 2.5 58.0Liechtenstein 2.5 .. .. .. .. .. .. .. .. ..Lithuania 4.7 3.3 2.5 17.5 9.6 –1.4 –5.2 43.7 4.1 47.6Luxembourg a 2.9 .. .. 22.0 12.4 7.1 –0.4 16.8 3.4 ..Macedonia, FYR 3.3 0.0 1.0 25.6 14.9 –3.0 .. .. 3.9 55.7Madagascar 3.2 2.2 4.5 .. .. .. .. .. 9.5 24.9Malawi 5.1 4.1 5.4 13.5 9.8 –13.6 .. .. 7.6 35.7Malaysia 4.9 5.1 5.0 34.6 20.6 11.0 –4.8 51.8 3.2 138.5Maldives 7.2 .. .. .. .. –23.9 –16.7 68.4 12.8 63.7Mali 5.1 –1.5 3.5 8.5 –5.2 –12.6 –2.5 .. 2.9 29.1Malta a 1.8 .. .. 9.5 .. –0.2 –2.8 86.5 2.7 ..Marshall Islands 1.5 .. .. .. .. .. .. .. .. ..Mauritania 5.6 4.8 5.2 .. .. .. .. .. 5.7 32.8Mauritius 3.9 3.3 3.6 13.8 4.8 –12.6 –1.1 36.3 6.5 103.3Mexico 2.1 4.0 3.3 26.6 12.4 –1.0 .. .. 3.4 31.4Micronesia, Fed. Sts. 0.0 .. .. .. .. .. .. .. .. 38.2Moldova 5.1 d 1.0 d 3.0 d 13.0 d 10.2 d –11.3 –1.8 23.8 7.7 49.9Monaco 4.3 .. .. .. .. .. .. .. .. ..Mongolia 7.4 11.8 16.2 31.1 –5.5 –31.5 –3.1 46.9 9.5 57.8Montenegro 4.2 .. .. .. .. .. .. .. 3.2 47.4Morocco 4.8 e 3.0 e 4.4 e 28.1 e 20.2 e –8.0 –4.1 56.3 0.9 112.4Mozambique 7.5 7.5 8.0 12.4 5.6 –19.1 .. .. 10.4 38.8Myanmar .. .. .. .. .. .. .. .. 5.0 ..Namibia 4.9 4.2 4.3 18.6 14.6 –1.2 .. .. 5.0 66.6Nepal 3.9 4.2 4.0 34.2 27.9 1.5 –1.0 33.8 9.5 75.7Netherlands a 1.5 .. .. 26.1 15.1 9.7 –3.9 66.0 2.4 ..New Caledonia .. .. .. .. .. .. .. .. .. ..New Zealand 2.0 .. .. 18.8 11.2 –4.2 –7.3 63.6 4.4 95.8Nicaragua 3.2 4.0 4.2 19.0 11.2 –14.0 0.5 .. 8.1 34.5Niger 4.2 12.0 6.8 .. .. –25.1 .. .. 2.9 21.470 <strong>World</strong> <strong>Development</strong> <strong>Indicators</strong> <strong>2013</strong> Front ? User guide <strong>World</strong> view People Environment
Economy 4Gross domestic productGrosssavingsAdjustednet savingsCurrentaccountbalanceCentralgovernmentcash surplusor deficitCentralgovernmentdebtConsumerprice indexBroadmoneyaverage annual % growthEstimate Forecast % of GDP % of GNI % of GDP % of GDP % of GDP % growth % of GDP2000–11 2011–12 2012–13 2011 2011 2011 2011 2011 2011 2011Nigeria 6.8 6.5 6.6 .. .. 3.6 .. .. 10.8 33.6Northern Mariana Islands .. .. .. .. .. .. .. .. .. ..Norway 1.6 .. .. 37.7 19.2 14.5 14.7 20.4 1.3 ..Oman 4.9 .. .. .. .. 14.3 –0.8 5.1 4.1 35.7Pakistan 4.9 3.8 3.9 20.4 9.3 –1.1 –6.5 .. 11.9 38.0Palau 0.3 .. .. .. .. .. .. .. .. ..Panama 7.2 10.0 7.5 17.7 9.4 –14.5 .. .. 5.9 98.1Papua New Guinea 4.3 8.0 4.0 20.3 .. –6.7 .. .. 8.4 49.9Paraguay 4.1 –1.0 8.5 10.6 3.6 –1.1 1.1 .. 8.3 45.0Peru 6.2 6.3 5.8 23.4 5.4 –1.9 1.3 19.5 3.4 35.8Philippines 4.9 6.0 6.2 25.1 14.6 3.1 –1.8 .. 4.6 59.8Poland 4.3 .. .. 16.9 9.2 –4.9 –4.3 .. 4.2 58.0Portugal a 0.5 .. .. 11.7 –1.6 –6.5 –4.0 92.6 3.7 ..Puerto Rico 0.0 .. .. .. .. .. .. .. .. ..Qatar 13.6 .. .. .. .. .. 2.9 .. 1.9 49.2Romania 4.4 0.6 1.6 24.8 14.4 –4.4 –4.9 .. 5.8 37.3Russian Federation 5.1 3.5 3.6 30.3 7.2 5.3 3.4 9.5 8.4 52.7Rwanda 7.9 7.7 7.5 11.3 4.5 –7.5 .. .. 5.7 ..Samoa 2.6 .. .. .. .. –11.9 .. .. 5.2 47.2San Marino 3.2 .. .. .. .. .. .. .. 2.6 ..São Tomé and Príncipe .. .. .. .. .. –43.5 .. .. 11.9 35.8Saudi Arabia 3.7 .. .. 46.8 3.8 27.5 .. .. 5.0 57.2Senegal 4.1 3.7 4.8 21.8 17.3 –4.7 .. .. 3.4 40.2Serbia 3.7 .. .. 16.4 .. –8.4 –4.2 .. 11.1 44.7Seychelles 2.9 3.3 4.2 .. .. –21.4 5.6 75.3 2.6 57.9Sierra Leone 6.6 25.0 11.1 9.8 –6.0 –37.9 –4.6 .. 16.2 21.6Singapore 6.0 .. .. 46.6 35.7 23.3 9.8 112.7 5.3 135.7Sint Maarten .. .. .. .. .. .. .. .. .. ..Slovak Republic a 5.1 .. .. 16.5 7.2 0.0 –4.9 45.6 3.9 ..Slovenia a 2.9 .. .. 21.4 13.2 0.0 –6.0 .. 1.8 ..Solomon Islands 4.9 5.3 4.0 .. .. –30.1 .. .. 7.3 40.8Somalia .. .. .. .. .. .. .. .. .. ..South Africa 3.7 2.4 2.7 16.4 1.5 –3.4 –4.4 .. 5.0 76.1South Sudan .. –2.0 11.0 .. .. .. .. .. .. ..Spain a 2.1 .. .. 18.2 9.1 –3.5 –3.5 55.2 3.2 ..Sri Lanka 5.8 6.1 6.8 22.1 13.4 –7.8 –6.4 .. 6.7 38.1St. Kitts and Nevis 2.5 .. .. 23.4 .. –8.6 2.6 .. 5.9 138.3St. Lucia 2.9 0.7 1.2 11.8 .. –22.5 .. .. 2.8 91.3St. Martin .. .. .. .. .. .. .. .. .. ..St. Vincent and Grenadines 3.1 1.2 1.5 –4.8 –12.2 –30.2 –3.7 .. 4.0 67.8Sudan 7.1 f 3.0 f 3.2 f 20.9 f 0.1 f 0.2 .. .. 13.0 24.5Suriname 4.9 4.0 4.5 .. .. 5.8 .. .. 17.7 47.5Swaziland 2.4 –2.0 1.0 –0.5 –5.1 –10.0 .. .. 6.1 29.6Sweden 2.3 .. .. 26.2 18.7 6.5 0.5 38.2 3.0 86.6Switzerland 1.9 .. .. 32.1 22.0 7.5 .. .. 0.2 167.8Syrian Arab Republic 5.0 .. .. 16.8 –5.7 –0.6 .. .. 4.8 73.9Tajikistan 8.0 .. .. 23.2 16.4 –12.1 .. .. 12.4 ..Economy States and markets Global links Back<strong>World</strong> <strong>Development</strong> <strong>Indicators</strong> <strong>2013</strong> 71
4 EconomyGross domestic productGrosssavingsAdjustednet savingsCurrentaccountbalanceCentralgovernmentcash surplusor deficitCentralgovernmentdebtConsumerprice indexBroadmoneyaverage annual % growthEstimate Forecast % of GDP % of GNI % of GDP % of GDP % of GDP % growth % of GDP2000–11 2011–12 2012–13 2011 2011 2011 2011 2011 2011 2011Tanzania g 7.0 6.5 6.8 20.3 10.5 –16.6 .. .. 12.7 34.7Thailand 4.2 4.7 5.0 31.0 20.8 4.1 –1.2 30.2 3.8 128.2Timor-Leste 5.6 .. .. .. .. .. .. .. 13.5 30.6Togo 2.6 4.0 4.4 12.2 5.3 –6.3 –1.1 .. 3.6 48.5Tonga 1.0 .. .. 3.9 .. –17.0 .. .. 6.3 39.0Trinidad and Tobago 5.6 .. .. .. .. 19.9 –4.8 21.3 5.1 65.1Tunisia 4.4 2.4 3.2 15.9 5.8 –7.3 –3.7 44.0 3.6 67.6Turkey 4.7 2.9 4.0 14.1 4.0 –10.0 –1.3 45.9 6.5 54.7Turkmenistan 8.7 .. .. .. .. .. .. .. .. ..Turks and Caicos Islands .. .. .. .. .. .. .. .. .. ..Tuvalu 1.1 .. .. .. .. .. .. .. .. ..Uganda 7.7 3.4 6.2 20.8 11.2 –13.5 –3.9 42.7 18.7 26.5Ukraine 4.3 0.5 2.2 16.0 6.2 –5.5 –2.3 27.1 8.0 52.1United Arab Emirates 4.8 .. .. .. .. .. .. .. 0.9 62.4United Kingdom 1.7 .. .. 12.9 2.7 –1.9 –7.7 101.2 4.5 165.7United States 1.6 .. .. 11.7 0.9 –3.2 –9.3 81.8 3.2 89.8Uruguay 4.0 4.0 4.0 16.5 5.9 –3.1 –0.6 46.6 8.1 44.6Uzbekistan 7.3 8.0 6.5 .. .. .. .. .. .. ..Vanuatu 3.9 2.0 2.5 .. .. –15.2 .. .. 0.9 84.2Venezuela, RB 4.4 5.2 1.8 30.7 1.4 8.6 .. .. 26.1 36.6Vietnam 7.3 5.2 5.5 33.1 17.4 0.2 .. .. 18.7 109.3Virgin Islands (U.S.) .. .. .. .. .. .. .. .. .. ..West Bank and Gaza .. .. .. .. .. .. .. .. 2.8 ..Yemen, Rep. 3.6 0.1 4.0 8.3 –10.0 –3.0 .. .. 16.4 30.1Zambia 5.7 6.7 7.1 27.8 4.0 1.1 –1.5 .. 6.4 23.4Zimbabwe –5.1 5.0 6.0 .. .. .. .. .. .. ..<strong>World</strong> 2.7 w 2.3 w 2.4 w 19.4 w 6.7 wLow income 5.5 5.6 6.1 26.5 15.6Middle income 6.4 4.9 5.5 30.0 15.1Lower middle income 6.2 4.8 5.5 28.1 13.4Upper middle income 6.5 5.0 5.5 31.0 15.6Low & middle income 6.4 4.9 5.5 29.9 15.1East Asia & Pacific 9.4 7.5 7.9 47.7 30.3Europe & Central Asia 5.2 3.0 3.6 22.9 6.2Latin America & Carib. 3.9 3.0 3.6 21.5 8.6Middle East & N. Africa 4.7 0.2 2.4 .. ..South Asia 7.3 5.4 5.7 33.3 21.2Sub- Saharan Africa 4.9 4.6 4.9 16.8 –2.4High income 1.6 1.3 1.3 17.6 5.7Euro area 1.2 –0.4 –0.1 20.1 8.6a. As members of the European Monetary Union, these countries share a single currency, the euro. b. Refers to the area controlled by the government of the Republic of Cyprus. c. ExcludesAbkhazia and South Ossetia. d. Excludes Transnistria. e. Includes Former Spanish Sahara. f. Excludes South Sudan after July 9, 2011. g. Covers mainland Tanzania only.72 <strong>World</strong> <strong>Development</strong> <strong>Indicators</strong> <strong>2013</strong> Front ? User guide <strong>World</strong> view People Environment
Economy 4About the dataEconomic data are organized by several different accounting conventions:the system of national accounts, the balance of payments,government finance statistics, and international financestatistics. There has been progress in unifying the concepts in thesystem of national accounts, balance of payments, and governmentfinance statistics, but there are many national variations in theimplementation of these standards. For example, even though theUnited Nations recommends using the 2008 System of NationalAccounts (2008 SNA) methodology in compiling national accounts,many are still using earlier versions, some as old as 1968. TheInternational Monetary Fund (IMF) has recently published a newbalance of payments methodology (BPM6), but many countries arestill using the previous version. Similarly, the standards and definitionsfor government finance statistics were updated in 2001, butseveral countries still report using the 1986 version. For individualcountry information about methodology used, refer to Primary datadocumentation.Economic growthAn economy’s growth is measured by the change in the volume of itsoutput or in the real incomes of its residents. The 2008 SNA offersthree plausible indicators for calculating growth: the volume of grossdomestic product (GDP), real gross domestic income, and real grossnational income. Only growth in GDP is reported here.Growth rates of GDP and its components are calculated using theleast squares method and constant price data in the local currencyfor countries and using constant price U.S. dollar series for regionaland income groups. Local currency series are converted to constantU.S. dollars using an exchange rate in the common reference year.The growth rates are average annual and compound growth rates.Methods of computing growth are described in Statistical methods.Forecasts of growth rates come from <strong>World</strong> Bank (<strong>2013</strong>).Rebasing national accountsRebasing of national accounts can alter the measured growth rate ofan economy and lead to breaks in series that affect the consistencyof data over time. When countries rebase their national accounts,they update the weights assigned to various components to betterreflect current patterns of production or uses of output. The newbase year should represent normal operation of the economy—itshould be a year without major shocks or distortions. Some developingcountries have not rebased their national accounts for manyyears. Using an old base year can be misleading because implicitprice and volume weights become progressively less relevant anduseful.To obtain comparable series of constant price data for computingaggregates, the <strong>World</strong> Bank rescales GDP and value added byindustrial origin to a common reference year. This year’s <strong>World</strong> <strong>Development</strong><strong>Indicators</strong> continues to use 2000 as the reference year.Because rescaling changes the implicit weights used in formingregional and income group aggregates, aggregate growth rates inthis year’s edition are not comparable with those from earlier editionswith different base years.Rescaling may result in a discrepancy between the rescaled GDPand the sum of the rescaled components. To avoid distortions in thegrowth rates, the discrepancy is left unallocated. As a result, theweighted average of the growth rates of the components generallydoes not equal the GDP growth rate.Adjusted net savingsAdjusted net savings measure the change in a country’s real wealthafter accounting for the depreciation and depletion of a full rangeof assets in the economy. If a country’s adjusted net savings arepositive and the accounting includes a sufficiently broad range ofassets, economic theory suggests that the present value of socialwelfare is increasing. Conversely, persistently negative adjustednet savings indicate that the present value of social welfare isdecreasing, suggesting that an economy is on an unsustainablepath.Adjusted net savings are derived from standard national accountingmeasures of gross savings by making four adjustments. First,estimates of fixed capital consumption of produced assets arededucted to obtain net savings. Second, current public expenditureson education are added to net savings (in standard nationalaccounting these expenditures are treated as consumption). Third,estimates of the depletion of a variety of natural resources arededucted to reflect the decline in asset values associated with theirextraction and harvest. And fourth, deductions are made for damagesfrom carbon dioxide emissions and local pollution. By accountingfor the depletion of natural resources and the degradation ofthe environment, adjusted net savings goes beyond the definitionof savings or net savings in the SNA.Balance of paymentsThe balance of payments records an economy’s transactions withthe rest of the world. Balance of payments accounts are dividedinto two groups: the current account, which records transactionsin goods, services, primary income, and secondary income, andthe capital and financial account, which records capital transfers,acquisition or disposal of nonproduced, nonfinancial assets, andtransactions in financial assets and liabilities. The current accountbalance is one of the most analytically useful indicators of an externalimbalance.A primary purpose of the balance of payments accounts is toindicate the need to adjust an external imbalance. Where to drawthe line for analytical purposes requires a judgment concerning theimbalance that best indicates the need for adjustment. There are anumber of definitions in common use for this and related analyticalpurposes. The trade balance is the difference between exports andimports of goods. From an analytical view it is arbitrary to distinguishgoods from services. For example, a unit of foreign exchange earnedby a freight company strengthens the balance of payments to theEconomy States and markets Global links Back<strong>World</strong> <strong>Development</strong> <strong>Indicators</strong> <strong>2013</strong> 73
4 Economysame extent as the foreign exchange earned by a goods exporter.Even so, the trade balance is useful because it is often the mosttimely indicator of trends in the current account balance. Customsauthorities are typically able to provide data on trade in goods longbefore data on trade in services are available.Beginning in August 2012, the International Monetary Fund implementedthe Balance of Payments Manual 6 (BPM6) framework inits major statistical publications. The <strong>World</strong> Bank will implementBPM6 in its online databases and publications in April <strong>2013</strong>. Balanceof payments data for 2005 onward will be presented in accordwith the BPM6. The historical BPM5 data series will end with datafor 2008, which can be accessed through the <strong>World</strong> <strong>Development</strong><strong>Indicators</strong> archives.The complete balance of payments methodology can be accessedthrough the International Monetary Fund website (www.imf.org/external/np/sta/bop/bop.htm).Government financeCentral government cash surplus or deficit, a summary measure ofthe ongoing sustainability of government operations, is comparableto the national accounting concept of savings plus net capital transfersreceivable, or net operating balance in the 2001 update of theIMF’s Government Finance Statistics Manual.The 2001 manual, harmonized with the 1993 SNA, recommendsan accrual accounting method, focusing on all economic eventsaffecting assets, liabilities, revenues, and expenses, not just thoserepresented by cash transactions. It accounts for all changes instocks, so stock data at the end of an accounting period equal stockdata at the beginning of the period plus flows over the period. The1986 manual considered only debt stocks.For most countries central government finance data have beenconsolidated into one account, but for others only budgetary centralgovernment accounts are available. Countries reporting budgetarydata are noted in Primary data documentation. Because budgetaryaccounts may not include all central government units (such associal security funds), they usually provide an incomplete picture.In federal states the central government accounts provide an incompleteview of total public finance.Data on government revenue and expense are collected by the IMFthrough questionnaires to member countries and by the Organisationfor Economic Co-operation and <strong>Development</strong> (OECD). DespiteIMF efforts to standardize data collection, statistics are often incomplete,untimely, and not comparable across countries.Government finance statistics are reported in local currency. Theindicators here are shown as percentages of GDP. Many countriesreport government finance data by fiscal year; see Primary datadocumentation for information on fiscal year end by country.Financial accountsMoney and the financial accounts that record the supply of moneylie at the heart of a country’s financial system. There are severalcommonly used definitions of the money supply. The narrowest, M1,encompasses currency held by the public and demand deposits withbanks. M2 includes M1 plus time and savings deposits with banksthat require prior notice for withdrawal. M3 includes M2 as well asvarious money market instruments, such as certificates of depositissued by banks, bank deposits denominated in foreign currency,and deposits with financial institutions other than banks. Howeverdefined, money is a liability of the banking system, distinguishedfrom other bank liabilities by the special role it plays as a mediumof exchange, a unit of account, and a store of value.A general and continuing increase in an economy’s price level iscalled inflation. The increase in the average prices of goods andservices in the economy should be distinguished from a changein the relative prices of individual goods and services. Generallyaccompanying an overall increase in the price level is a change inthe structure of relative prices, but it is only the average increase,not the relative price changes, that constitutes inflation. A commonlyused measure of inflation is the consumer price index, which measuresthe prices of a representative basket of goods and servicespurchased by a typical household. The consumer price index is usuallycalculated on the basis of periodic surveys of consumer prices.Other price indices are derived implicitly from indexes of current andconstant price series.Consumer price indexes are produced more frequently and soare more current. They are constructed explicitly, using surveysof the cost of a defined basket of consumer goods and services.Nevertheless, consumer price indexes should be interpreted withcaution. The definition of a household, the basket of goods, and thegeographic (urban or rural) and income group coverage of consumerprice surveys can vary widely by country. In addition, weights arederived from household expenditure surveys, which, for budgetaryreasons, tend to be conducted infrequently in developing countries,impairing comparability over time. Although useful for measuringconsumer price inflation within a country, consumer price indexesare of less value in comparing countries.74 <strong>World</strong> <strong>Development</strong> <strong>Indicators</strong> <strong>2013</strong> Front ? User guide <strong>World</strong> view People Environment
Economy 4Definitions• Gross domestic product (GDP) at purchaser prices is the sum ofgross value added by all resident producers in the economy plus anyproduct taxes (less subsidies) not included in the valuation of output.It is calculated without deducting for depreciation of fabricated capitalassets or for depletion and degradation of natural resources. Valueadded is the net output of an industry after adding up all outputs andsubtracting intermediate inputs. • Gross savings are the differencebetween gross national income and public and private consumption,plus net current transfers. • Adjusted net savings measurethe change in value of a specified set of assets, excluding capitalgains. Adjusted net savings are net savings plus education expenditureminus energy depletion, mineral depletion, net forest depletion,and carbon dioxide and particulate emissions damage. • Currentaccount balance is the sum of net exports of goods and services, netprimary income, and net secondary income. • Central governmentcash surplus or deficit is revenue (including grants) minus expense,minus net acquisition of nonfinancial assets. In editions before 2005nonfinancial assets were included under revenue and expenditure ingross terms. This cash surplus or deficit is close to the earlier overallbudget balance (still missing is lending minus repayments, which areincluded as a financing item under net acquisition of financial assets).• Central government debt is the entire stock of direct governmentfixed-term contractual obligations to others outstanding on a particulardate. It includes domestic and foreign liabilities such as currencyand money deposits, securities other than shares, and loans. It isthe gross amount of government liabilities reduced by the amountof equity and financial derivatives held by the government. Becausedebt is a stock rather than a flow, it is measured as of a given date,usually the last day of the fiscal year. • Consumer price index reflectschanges in the cost to the average consumer of acquiring a basketof goods and services that may be fixed or may change at specifiedintervals, such as yearly. The Laspeyres formula is generally used.• Broad money (IFS line 35L..ZK) is the sum of currency outsidebanks; demand deposits other than those of the central government;the time, savings, and foreign currency deposits of resident sectorsother than the central government; bank and traveler’s checks; andother securities such as certificates of deposit and commercial paper.Data sourcesData on GDP for most countries are collected from national statisticalorganizations and central banks by visiting and resident <strong>World</strong>Bank missions; data for selected high-income economies are fromthe OECD. Data on gross savings are from <strong>World</strong> Bank nationalaccounts data files. Data on adjusted net savings are based ona conceptual underpinning by Hamilton and Clemens (1999) andcalculated using data on consumption of fixed capital from theUnited Nations Statistics Division’s National Accounts Statistics:Main Aggregates and Detailed Tables, extrapolated to 2010; dataon education expenditure from the United Nations Educational,Scientific, and Cultural Organization Institute for Statistics onlinedatabase, with missing data estimated by <strong>World</strong> Bank staff; data onforest, energy, and mineral depletion based on sources and methodsin <strong>World</strong> Bank (2011); data on carbon dioxide damage fromFankhauser (1994); data on local pollution damage from Pandey andothers (2006). Data on current account balance are from the IMF’sBalance of Payments Statistics Yearbook and International FinancialStatistics. Data on central government finances are from the IMF’sGovernment Finance Statistics database. Data on the consumerprice index are from the IMF’s International Financial Statistics. Dataon broad money are from the IMF’s monthly International FinancialStatistics and annual International Financial Statistics Yearbook.ReferencesAsian <strong>Development</strong> Bank. 2012. Asian <strong>Development</strong> Outlook 2012Update: Services and Asia’s Future Growth. Manila.De la Torre, Augusto, Tatiana Didier, and Samuel Pienknagura. 2012.Latin America Copes with Volatility, the Dark Side of Globalization.Washington, DC: <strong>World</strong> Bank.Fankhauser, Samuel. 1994. “The Social Costs of Greenhouse Gas Emissions:An Expected Value Approach.” Energy Journal 15 (2): 157–84.Hamilton, Kirk, and Michael Clemens. 1999. “Genuine Savings Rates inDeveloping Countries.” <strong>World</strong> Bank Economic Review 13 (2): 333–56.IMF (International Monetary Fund). 2001. Government Finance StatisticsManual. Washington, DC.———. 2012. Regional Economic Outlook: Sub- Saharan Africa—MaintainingGrowth in an Uncertain <strong>World</strong>, October 2012. Washington, DC.www.imf.org/external/pubs/ft/reo/2012/afr/eng/sreo1012.htm.Pandey, Kiran D., Katharine Bolt, Uwe Deichmann, Kirk Hamilton, BartOstro, and David Wheeler. 2006. “The Human Cost of Air Pollution:New Estimates for Developing Countries.” <strong>World</strong> Bank, <strong>Development</strong>Research Group and Environment Department, Washington, DC.United Nations Statistics Division. Various years. National AccountsStatistics: Main Aggregates and Detailed Tables. Parts 1 and 2. NewYork: United Nations.<strong>World</strong> Bank. 2011. The Changing Wealth of Nations: Measuring Sustainable<strong>Development</strong> for the New Millennium. Washington, DC.———. 2012a. East Asia and Pacific Economic Update 2012, Volume 2:Remaining Resilient. Washington, DC.———. 2012b. Middle East and North Africa Region Economic <strong>Development</strong>sand Prospects, October 2012: Looking Ahead After a Yearin Transition. Washington, DC.———. 2012c. South Asia Economic Focus—A Review of Economic<strong>Development</strong>s in South Asian Countries: Creating Fiscal Spacethrough Revenue Mobilization. Washington, DC.———. <strong>2013</strong>. Global Economic Prospects, Volume 6, January 13:Assuring Growth over the Medium Term. Washington, DC.———. Various years. <strong>World</strong> <strong>Development</strong> <strong>Indicators</strong>. Washington, DC.Economy States and markets Global links Back<strong>World</strong> <strong>Development</strong> <strong>Indicators</strong> <strong>2013</strong> 75
4 EconomyOnline tables and indicatorsTo access the <strong>World</strong> <strong>Development</strong> <strong>Indicators</strong> online tables, usethe URL http://wdi.worldbank.org/table/ and the table number (forexample, http://wdi.worldbank.org/table/4.1). To view a specificindicator online, use the URL http://data.worldbank.org/indicator/and the indicator code (for example, http://data.worldbank.org/indicator/NY.GDP.MKTP.KD.ZG).4.1 Growth of outputGross domestic productAgricultureIndustryManufacturingServices4.2 Structure of outputGross domestic productAgricultureIndustryManufacturingServices4.3 Structure of manufacturingManufacturing value addedFood, beverages and tobaccoTextiles and clothingMachinery and transport equipmentChemicalsOther manufacturing4.4 Structure of merchandise exportsMerchandise exportsFoodAgricultural raw materialsFuelsOres and metalsManufactures4.5 Structure of merchandise importsMerchandise importsFoodAgricultural raw materialsFuelsOres and metalsManufactures4.6 Structure of service exportsCommercial service exportsTransportTravelInsurance and financial servicesComputer, information, communications,and other commercial servicesNY.GDP.MKTP.KD.ZGNV.AGR.TOTL.KD.ZGNV.IND.TOTL.KD.ZGNV.IND.MANF.KD.ZGNV.SRV.TETC.KD.ZGNY.GDP.MKTP.CDNV.AGR.TOTL.ZSNV.IND.TOTL.ZSNV.IND.MANF.ZSNV.SRV.TETC.ZSNV.IND.MANF.CDNV.MNF.FBTO.ZS.UNNV.MNF.TXTL.ZS.UNNV.MNF.MTRN.ZS.UNNV.MNF.CHEM.ZS.UNNV.MNF.OTHR.ZS.UNTX.VAL.MRCH.CD.WTTX.VAL.FOOD.ZS.UNTX.VAL.AGRI.ZS.UNTX.VAL.FUEL.ZS.UNTX.VAL.MMTL.ZS.UNTX.VAL.MANF.ZS.UNTM.VAL.MRCH.CD.WTTM.VAL.FOOD.ZS.UNTM.VAL.AGRI.ZS.UNTM.VAL.FUEL.ZS.UNTM.VAL.MMTL.ZS.UNTM.VAL.MANF.ZS.UNTX.VAL.SERV.CD.WTTX.VAL.TRAN.ZS.WTTX.VAL.TRVL.ZS.WTTX.VAL.INSF.ZS.WTTX.VAL.OTHR.ZS.WT4.7 Structure of service importsCommercial service importsTransportTravelInsurance and financial servicesComputer, information, communications,and other commercial services4.8 Structure of demandHousehold final consumption expenditureGeneral government final consumptionexpenditureGross capital formationExports of goods and servicesImports of goods and servicesGross savings4.9 Growth of consumption and investmentHousehold final consumption expenditureHousehold final consumption expenditure,Per capitaGeneral government final consumptionexpenditureGross capital formationExports of goods and servicesImports of goods and servicesTM.VAL.SERV.CD.WTTM.VAL.TRAN.ZS.WTTM.VAL.TRVL.ZS.WTTM.VAL.INSF.ZS.WTTM.VAL.OTHR.ZS.WTNE.CON.PETC.ZSNE.CON.GOVT.ZSNE.GDI.TOTL.ZSNE.EXP.GNFS.ZSNE.IMP.GNFS.ZSNY.GNS.ICTR.ZSNE.CON.PRVT.KD.ZGNE.CON.PRVT.PC.KD.ZGNE.CON.GOVT.KD.ZGNE.GDI.TOTL.KD.ZGNE.EXP.GNFS.KD.ZGNE.IMP.GNFS.KD.ZG4.10 Toward a broader measure of national incomeGross domestic product, $Gross national income, $Consumption of fixed capitalNatural resource depletionAdjusted net national incomeGross domestic product, % growthGross national income, % growthAdjusted net national income4.11 Toward a broader measure of savingsGross savingsConsumption of fixed capitalEducation expenditureNet forest depletionEnergy depletionMineral depletionCarbon dioxide damageLocal pollution damageAdjusted net savingsNY.GDP.MKTP.CDNY.GNP.MKTP.CDNY.ADJ.DKAP.GN.ZSNY.ADJ.DRES.GN.ZSNY.ADJ.NNTY.CDNY.GDP.MKTP.KD.ZGNY.GNP.MKTP.KD.ZGNY.ADJ.NNTY.KD.ZGNY.ADJ.ICTR.GN.ZSNY.ADJ.DKAP.GN.ZSNY.ADJ.AEDU.GN.ZSNY.ADJ.DFOR.GN.ZSNY.ADJ.DNGY.GN.ZSNY.ADJ.DMIN.GN.ZSNY.ADJ.DCO2.GN.ZSNY.ADJ.DPEM.GN.ZSNY.ADJ.SVNG.GN.ZS76 <strong>World</strong> <strong>Development</strong> <strong>Indicators</strong> <strong>2013</strong> Front ? User guide <strong>World</strong> view People Environment
Economy 44.12 Central government financesRevenueExpenseCash surplus or deficitNet incurrence of liabilities, DomesticNet incurrence of liabilities, ForeignDebt and interest payments, Total debtDebt and interest payments, Interest4.13 Central government expenditureGoods and servicesCompensation of employeesInterest paymentsSubsidies and other transfersOther expense4.14 Central government revenuesTaxes on income, profits and capital gainsTaxes on goods and servicesTaxes on international tradeOther taxesSocial contributionsGrants and other revenueGC.REV.XGRT.GD.ZSGC.XPN.TOTL.GD.ZSGC.BAL.CASH.GD.ZSGC.FIN.DOMS.GD.ZSGC.FIN.FRGN.GD.ZSGC.DOD.TOTL.GD.ZSGC.XPN.INTP.RV.ZSGC.XPN.GSRV.ZSGC.XPN.COMP.ZSGC.XPN.INTP.ZSGC.XPN.TRFT.ZSGC.XPN.OTHR.ZSGC.TAX.YPKG.RV.ZSGC.TAX.GSRV.RV.ZSGC.TAX.INTT.RV.ZSGC.TAX.OTHR.RV.ZSGC.REV.SOCL.ZSGC.REV.GOTR.ZS4.15 Monetary indicatorsBroad moneyClaims on domestic economyClaims on central governmentsInterest rate, DepositInterest rate, LendingInterest rate, Real4.16 Exchange rates and priceOfficial exchange ratePurchasing power parity (PPP) conversionfactorRatio of PPP conversion factor to marketexchange rateReal effective exchange rateGDP implicit deflatorConsumer price indexWholesale price index4.17 Balance of payments current accountGoods and services, ExportsGoods and services, ImportsBalance on primary incomeBalance on secondary incomeCurrent account balanceTotal reservesFM.LBL.BMNY.ZGFM.AST.DOMO.ZG.M3FM.AST.CGOV.ZG.M3FR.INR.DPSTFR.INR.LENDFR.INR.RINRPA.NUS.FCRFPA.NUS.PPPPA.NUS.PPPC.RFPX.REX.REERNY.GDP.DEFL.KD.ZGFP.CPI.TOTL.ZGFP.WPI.TOTLBX.GSR.GNFS.CDBM.GSR.GNFS.CDBN.GSR.FCTY.CDBN.TRF.CURR.CDBN.CAB.XOKA.CDFI.RES.TOTL.CDEconomy States and markets Global links Back<strong>World</strong> <strong>Development</strong> <strong>Indicators</strong> <strong>2013</strong> 77
STATES ANDMARKETS78 <strong>World</strong> <strong>Development</strong> <strong>Indicators</strong> <strong>2013</strong>Front ? User guide <strong>World</strong> view People Environment
States and markets includes indicators of privatesector investment and performance, therole of the public sector in nurturing investmentand growth, and the quality and availability ofinfrastructure essential for growth and development.These indicators measure the businessenvironment, the functions of government, financialsystem development, infrastructure, informationand communication technology, science andtechnology, performance of governments andtheir policies, and conditions in fragile countrieswith weak institutions.Measures of investment in infrastructureprojects with private participation show theprivate sector’s contributions to providing publicservices and easing fiscal constraints. Forexample, private investment in the dynamic telecommunicationssector has increased more than50 percent since 2006, reaching $158.5 billionin 2011.Data on access to finance, availability ofcredit, cost of service, and stock markets helpimprove understanding of the state of financialdevelopment. In 2011 people had greateraccess to finance in Europe and Central Asia,with 19 commercial bank branches and 47 automatedteller machines per 100,000 people,than in other developing regions. Stock marketmeasures show the effects of the global financialcrises: the market capitalization of listedcompanies dropped from $64.6 trillion in 2007to $34.9 trillion in 2008, recovering to only$46.8 trillion in 2011.Economic health is measured not only inmacroeconomic terms but also by laws, regulations,and institutional arrangements. Firmsevaluating investment options, governmentsinterested in improving business conditions,and economists seeking to explain economicperformance have all grappled with defining andmeasuring the business environment and howconstraints affect productivity and job creation.The <strong>World</strong> <strong>Development</strong> <strong>Indicators</strong> databaseincludes results from enterprise surveys andexpert assessments of the business environmentfrom the Doing Business project.States and markets also includes data on thesize of the transportation and power sectors, aswell as the spread of new information technology.To become competitive suppliers to the restof the world, many developing countries need toimprove their road, rail, port, and air transportfacilities. Expanding electricity supply to meetthe growing demand of increasingly urban andindustrialized economies without unacceptablesocial, economic, and environmental costs isone of the greatest challenges facing developedand developing countries. Data on electric powerconsumption per capita show that consumptionin developing countries has doubled since 1995,to 1,660 kilowatt-hours in 2010.With rapid growth of mobile telephony andthe global expansion of the Internet, informationand communication technologies areincreasingly recognized as essential for development.<strong>World</strong> <strong>Development</strong> <strong>Indicators</strong> includesdata showing the rapid changes in this sector.For instance, mobile cellular subscriptionsincreased from 16 percent of the global populationin 2001 to 85 percent in 2011, and Internetusers from 8 percent to 33 percent over thesame period.5Economy States and markets Global links Back<strong>World</strong> <strong>Development</strong> <strong>Indicators</strong> <strong>2013</strong> 79
HighlightsEast Asia & Pacific: Patent applications are rising, especially in ChinaPatent applications, 2011 (thousands)6004002000ChinaUnited StatesJapanKorea, Rep.GermanyIndiaSource: Online table 5.13.Russian FederationCanadaAustraliaUnited KingdomFranceMexicoHong Kong SAR, ChinaSingaporeItalySouth AfricaIsraelMalaysiaNew ZealandIndonesiaEurope & Central Asia: Container traffic picks upWhile the global economy continued to underperform, intellectualproperty filings worldwide grew strongly in 2011. Demand for patentsrose from 800,000 applications in the early 1980s to 2.14 million in2011, topping 2 million for the first time. After dropping 4 percent in2009, patent applications rebounded strongly in 2010 and 2011, averaging7 percent growth a year. In 2011 China’s patent office becamethe world’s largest, measured by patent applications received, accordingto <strong>World</strong> Intellectual Property Organization (2012). China received526,412 applications, compared with 503,582 for the United Statesand 342,610 for Japan. Of the 20 busiest patent offices, 7 were inEast Asia and Pacific, accounting for 58 percent of total applicationsfiled worldwide in 2011.Container port traffic (millions of twenty-foot equivalent units)86420LithuaniaRomania20092011RussianFederationTurkeyUkraineMeasures of port container traffic, much of it commodity shipmentsof medium to high value added, give some indication of a country’seconomic status, though much of the economic benefit from transshipmentsgoes to the terminal operator and ancillary services forships and containers rather than to the country more broadly. Afterthe 2008 fiscal crisis, worldwide container shipments fell to472 million in 2009, an almost 9 percent drop from 2008, affectingall ports, operators, and countries. But shipments rebounded in2010, growing 15 percent and reaching precrisis levels. Most of thegrowth came from intercontinental shipments by developing countries.In 2011 the Russian Federation (3.8 million) and Turkey(6.1 million) led the market in container shipments in Europe andCentral Asia.80 <strong>World</strong> <strong>Development</strong> <strong>Indicators</strong> <strong>2013</strong>Source: Online table 5.10.Latin America & Caribbean: Homicide rates mountIntentional homicides, 2011 or latest available (per 100,000 people)1007550250Source: Online table 5.8.HondurasEl SalvadorCôte d’IvoireVenezuela, RBBelizeJamaicaGuatemalaSt. Kitts & NevisZambiaUgandaMalawiLesothoTrinidad & TobagoSouth AfricaHomicide rates are very high in Latin America and the Caribbean andSub- Saharan Africa, where they add to the death toll caused by armedconflicts. According to the Geneva Declaration on Armed Violence and<strong>Development</strong> (2011), a quarter of all violent deaths occur in just 14countries, averaging more than 30 violent deaths per 100,000 peoplea year, half of them in Latin America and the Caribbean. In many ofthese countries, homicides, not armed conflicts, account for themajority of violent deaths. The links between violent death rates andsocioeconomic development show that homicide rates are higherwhere income disparity, extreme poverty, and hunger are high. Countriesthat have strengthened their rule of law have seen a decline inhomicide rates.Front ? User guide <strong>World</strong> view People Environment
Middle East & North Africa: Military spending share continues to riseDemanding open government and good governance from their headMilitary spending (% of GDP)of states, citizens of countries in the Middle East and North Africabrought about the Arab Spring in late 2010 and 2011. Although it4is still too soon to estimate the effects of the turbulent years, thereare signs of higher military spending and arms imports. From 20103to 2011 all regions except the Middle East and North Africa reducedmilitary spending as a share of gross domestic product (GDP). Algeriaincreased military spending from 3.5 percent of GDP in 2010 to24.6 percent in 2011, and Tunisia from 1.2 percent of GDP in 2010to 1.3 percent in 2011. Saudi Arabia (8.4 percent of GDP) and Israel1(6.8 percent), both high-income economies, spend the most on themilitary, followed by Iraq (5.1 percent), Jordan (4.7 percent), and Lebanon(4.4 percent).020102011East Asia& PacificEurope& CentralAsiaLatinAmerica &CaribbeanMiddle East& NorthAfricaSouthAsiaSub-SaharanAfricaSource: Online table 5.7.South Asia: Mobile phone access growing rapidlyMobile phone subscriptions have roughly doubled every two yearssince 2002 and now exceed the number of fixed-line subscriptionsin 2002. By the end of 2011 there were 5.9 billion mobile phonesubscriptions worldwide, almost one for every person if distributedequally. Developing economies have lagged behind, but they are catchingup. Sub- Saharan Africa, where 53 per 100 people have mobilephone subscriptions, started far behind but has reached the samesubscription rate as high-income economies did 11 years ago. SouthAsia is only eight years behind. In recent years South Asia has hadthe largest growth in mobile subscription coverage among developingregions, with 69 mobile phone subscriptions per 100 people in 2011,up from 8 in 2005.Mobile phone subscriptions (per 100 people)1501005002000High income2002Latin America & CaribbeanMiddle East & North AfricaEast Asia & Pacific2004South Asia2006Europe & Central Asia2008Sub-SaharanAfrica2010 2011Source: Online table 5.11.Sub- Saharan Africa: Growth with good policiesThe <strong>World</strong> Bank’s Country Policy and Institutional Assessment (CPIA)score reflects country performance in promoting economic growthand reducing poverty. Data for Sub- Saharan countries show a positiveassociation between average CPIA score and average GDP growth over2006–11. In 2011 the region’s average CPIA score for International<strong>Development</strong> Association countries was 3.2 on a scale of 1 (low) to6 (high). The regional average masks the wide variation across countries,from 2.2 in Eritrea and Zimbabwe to 4.0 in Cape Verde. Forseveral countries the policy environment is the best in recent years.Thirteen countries saw an improvement in the 2011 score by at least0.1, 20 countries saw no change, and 5 saw a decline of 0.1 or more(<strong>World</strong> Bank 2012).Average GDP growth, 2006–11 (%)1510502.0 2.5 3.0 3.5 4.0Average CPIA score, 2006–11 (1, low, to 6, high)Source: Online table 5.9.Economy States and markets Global links Back<strong>World</strong> <strong>Development</strong> <strong>Indicators</strong> <strong>2013</strong> 81
5 States and marketsBusinessentrydensityTimerequiredto start abusinessStock marketcapitalizationDomesticcreditprovidedby bankingsectorTax revenuecollectedby centralgovernmentMilitaryexpendituresElectricpowerconsumptionper capitaper 1,000peopleages15–64 days % of GDP % of GDP % of GDP % of GDP kilowatt-hoursMobile Individualscellular using thesubscriptions a Internet aper100 people% ofpopulationHigh-technologyexports% of manufacturedexports2011 June 2012 2011 2011 2011 2011 2010 2011 2011 2011Afghanistan 0.12 7 .. –2.9 8.7 4.7 .. 54 5 ..Albania 0.96 4 .. 69.1 .. 1.5 1,770 96 49 0.5Algeria 0.19 25 .. –4.7 39.4 b 4.6 1,026 99 14 0.2American Samoa .. .. .. .. .. .. .. .. .. ..Andorra .. .. .. .. .. .. .. 75 81 ..Angola .. 68 .. 17.9 .. 3.5 248 48 15 ..Antigua and Barbuda .. 21 .. 101.4 .. .. .. 196 82 0.0Argentina 0.46 26 9.8 31.3 .. 0.7 2,904 135 48 8.0Armenia 1.12 8 0.4 36.0 17.0 4.0 1,606 104 32 2.6Aruba .. .. .. .. .. .. .. 123 57 4.6Australia 6.17 2 86.9 145.1 20.6 b 1.9 10,286 108 79 13.0Austria 0.56 25 19.7 135.3 18.4 b 0.9 8,356 155 80 11.9Azerbaijan 0.63 8 .. 20.0 12.7 4.9 1,603 109 50 1.3Bahamas, The .. 31 .. 108.1 16.8 .. .. 86 65 0.0Bahrain .. 9 89.0 75.2 .. 3.4 9,814 128 77 0.2Bangladesh 0.10 19 21.0 70.4 10.0 1.3 279 56 5 ..Barbados .. 18 124.1 136.3 27.2 .. .. 127 72 13.7Belarus 0.91 5 .. 34.4 16.3 1.1 3,564 112 40 2.6Belgium 3.00 4 44.8 116.9 24.6 b 1.1 8,388 117 78 10.0Belize 4.54 44 .. 66.9 22.3 1.1 .. 70 14 0.4Benin .. 26 .. 21.7 15.7 b 1.0 90 85 4 0.5Bermuda .. .. 26.6 .. .. .. .. 136 88 ..Bhutan 0.06 36 .. 49.2 9.2 .. .. 66 21 0.1Bolivia 0.48 50 17.2 48.6 .. 1.5 616 83 30 13.7Bosnia and Herzegovina 0.71 37 .. 57.7 20.9 b 1.4 3,110 85 60 3.0Botswana 9.44 61 23.7 7.1 20.8 2.1 1,586 143 7 0.9Brazil 2.38 119 49.6 98.3 15.7 1.4 2,384 124 45 9.7Brunei Darussalam .. 101 .. 8.1 .. 2.5 8,759 109 56 ..Bulgaria 7.20 18 15.4 71.4 19.1 1.5 4,476 141 51 7.5Burkina Faso 0.11 13 .. 17.6 14.2 b 1.3 .. 45 3 5.9Burundi .. 8 .. 28.3 .. 2.7 .. 22 1 8.5Cambodia 0.22 85 .. 24.2 10.0 b 1.5 146 96 3 0.1Cameroon .. 15 .. 14.0 .. 1.4 271 52 5 4.9Canada 7.56 5 109.8 177.6 11.9 b 1.4 15,137 80 83 13.4Cape Verde .. 11 .. 80.6 19.8 0.5 .. 79 32 0.6Cayman Islands .. .. .. .. .. .. .. 168 69 ..Central African Republic .. 22 .. 25.4 .. 2.6 .. 41 2 0.0Chad .. 62 .. 7.0 .. 2.3 .. 32 2 ..Channel Islands .. .. .. .. .. .. .. .. .. ..Chile 4.13 8 108.7 71.2 19.1 b 3.2 3,297 130 54 4.6China .. 33 46.3 145.5 10.5 2.0 c 2,944 73 38 25.8Hong Kong SAR, China 27.67 3 357.8 207.1 13.5 b .. 5,923 215 75 13.7Macao SAR, China .. .. .. –28.1 37.9 b .. .. 243 58 0.0Colombia 1.80 13 60.4 65.6 13.9 b 3.3 1,012 98 40 4.3Comoros .. 20 .. 21.2 .. .. .. 29 6 ..Congo, Dem. Rep. .. 58 .. 3.3 13.7 1.5 95 23 1 ..Congo, Rep. .. 161 .. –16.1 .. 1.1 145 94 6 3.782 <strong>World</strong> <strong>Development</strong> <strong>Indicators</strong> <strong>2013</strong> Front ? User guide <strong>World</strong> view People Environment
States and markets 5BusinessentrydensityTimerequiredto start abusinessStock marketcapitalizationDomesticcreditprovidedby bankingsectorTax revenuecollectedby centralgovernmentMilitaryexpendituresElectricpowerconsumptionper capitaper 1,000peopleages15–64 days % of GDP % of GDP % of GDP % of GDP kilowatt-hoursMobile Individualscellular using thesubscriptions a Internet aper100 people% ofpopulationHigh-technologyexports% of manufacturedexports2011 June 2012 2011 2011 2011 2011 2010 2011 2011 2011Costa Rica 17.64 60 3.5 53.3 13.8 b .. 1,855 92 42 40.8Côte d’Ivoire .. 32 26.1 25.3 .. b 1.5 210 86 2 15.1Croatia 2.39 9 34.9 90.3 18.4 1.7 3,813 116 71 7.6Cuba .. .. .. .. .. 3.3 1,299 12 23 ..Curaçao .. .. .. .. .. .. .. .. .. ..Cyprus 24.73 8 11.6 330.1 26.1 b 2.2 4,675 98 58 27.3Czech Republic 2.84 20 17.7 67.4 13.7 1.1 6,321 123 73 16.0Denmark 4.55 6 53.8 205.4 33.8 b 1.5 6,327 128 90 13.9Djibouti .. 37 .. 32.3 .. 3.7 .. 21 7 0.1Dominica 3.30 13 .. 57.9 .. .. .. 164 51 0.0Dominican Republic 0.96 19 .. 43.8 12.7 b 0.6 1,442 87 36 2.2Ecuador .. 56 8.8 28.3 .. 3.5 1,055 105 31 3.2Egypt, Arab Rep. 0.13 7 21.2 74.9 14.1 1.9 1,608 101 39 0.7El Salvador 0.46 17 23.7 66.5 13.5 b 1.0 855 134 18 5.8Equatorial Guinea .. 135 .. –3.0 .. .. .. 59 6 ..Eritrea .. 84 .. 104.0 .. .. 52 4 6 ..Estonia 8.10 7 7.3 85.8 16.0 b 1.7 6,464 139 77 13.4Ethiopia 0.03 15 .. 37.1 9.3 1.1 54 17 1 2.0Faeroe Islands .. .. .. .. .. .. .. 122 81 0.6Fiji .. 58 35.9 114.3 .. 1.6 .. 84 28 4.5Finland 3.60 14 54.4 101.6 20.6 b 1.5 16,483 166 89 9.3France 3.13 7 56.6 133.5 21.3 b 2.2 7,729 95 80 23.7French Polynesia .. .. .. .. .. .. .. 81 49 15.8Gabon 4.27 58 .. 12.2 .. 0.9 1,004 117 8 3.0Gambia, The .. 27 .. 43.8 .. .. .. 79 11 3.3Georgia 4.49 2 5.5 34.3 23.9 3.0 1,743 102 37 1.8Germany 1.35 15 32.9 124.8 11.8 b 1.3 7,215 132 83 15.0Ghana 1.09 12 7.9 27.7 15.0 0.3 298 85 14 1.4Greece 0.85 11 11.6 153.2 21.3 b 2.8 5,242 106 53 9.7Greenland .. .. .. .. .. .. .. 103 64 ..Grenada .. 15 .. 91.3 18.3 .. .. 117 33 11.1Guam .. .. .. .. .. .. .. .. 51 ..Guatemala 0.64 40 .. 39.2 11.0 0.4 567 140 12 4.4Guinea .. 35 .. 32.3 .. .. .. 44 1 0.1Guinea-Bissau .. 9 .. 13.6 .. .. .. 56 3 ..Guyana .. 20 17.1 51.0 .. 1.2 .. 70 32 0.1Haiti .. 105 .. 17.4 .. .. 24 41 8 ..Honduras .. 14 .. 53.3 15.0 b 1.1 671 104 16 1.3Hungary 7.63 5 13.4 75.7 21.0 b 1.0 3,876 117 59 22.7Iceland 7.94 5 14.4 148.2 22.3 0.1 51,440 106 95 20.9India 0.09 27 54.2 74.1 10.4 2.5 616 72 10 6.9Indonesia 0.27 47 46.1 38.5 11.8 0.7 641 103 18 8.3Iran, Islamic Rep. .. 13 19.1 37.4 9.3 1.9 2,652 75 21 4.5Iraq 0.11 74 .. –0.8 .. 5.1 1,183 78 5 ..Ireland 4.78 10 16.3 225.7 23.1 b 0.6 6,025 108 77 21.2Isle of Man 11.65 .. .. .. .. .. .. .. .. ..Israel 4.46 21 59.7 85.9 24.5 b 6.8 6,856 122 70 14.0Economy States and markets Global links Back<strong>World</strong> <strong>Development</strong> <strong>Indicators</strong> <strong>2013</strong> 83
5 States and marketsBusinessentrydensityTimerequiredto start abusinessStock marketcapitalizationDomesticcreditprovidedby bankingsectorTax revenuecollectedby centralgovernmentMilitaryexpendituresElectricpowerconsumptionper capitaper 1,000peopleages15–64 days % of GDP % of GDP % of GDP % of GDP kilowatt-hoursMobile Individualscellular using thesubscriptions a Internet aper100 people% ofpopulationHigh-technologyexports% of manufacturedexports2011 June 2012 2011 2011 2011 2011 2010 2011 2011 2011Italy 1.63 6 19.7 157.0 22.5 b 1.6 5,384 158 57 7.4Jamaica 1.10 7 50.0 49.6 25.6 b 0.8 1,223 108 32 0.6Japan 1.10 23 60.3 341.7 9.8 b 1.0 8,394 105 80 17.5Jordan 0.83 12 94.3 106.7 15.0 4.7 2,226 118 35 2.5Kazakhstan 1.64 19 23.0 40.3 22.5 1.0 4,728 156 45 29.9Kenya 0.85 32 30.3 52.0 19.9 1.5 156 67 28 5.7Kiribati 0.11 31 .. .. .. .. .. 14 10 42.7Korea, Dem. Rep. .. .. .. .. .. .. 749 4 0 ..Korea, Rep. 1.83 7 89.1 102.7 15.6 2.8 9,744 109 84 25.7Kosovo 0.92 52 .. 20.8 .. .. 2,650 .. .. ..Kuwait .. 32 57.1 50.0 0.7 3.2 18,320 175 74 0.5Kyrgyz Republic 0.95 10 2.7 .. 16.1 4.2 1,375 116 20 3.0Lao PDR 0.10 92 .. 26.5 13.6 0.2 .. 87 9 ..Latvia 11.18 16 3.8 79.3 13.3 1.0 3,026 103 72 8.2Lebanon .. 9 25.3 173.7 17.0 b 4.4 3,569 79 52 2.4Lesotho 1.22 24 .. 0.7 58.9 2.4 .. 56 4 0.3Liberia .. 6 .. 30.9 0.2 0.7 .. 49 3 ..Libya .. .. .. –65.9 .. 1.2 4,270 156 17 ..Liechtenstein 25.11 .. .. .. .. .. .. 102 85 ..Lithuania 2.18 20 9.5 57.5 13.4 b 1.0 3,271 151 65 10.3Luxembourg 7.31 19 114.2 172.4 24.3 .. 16,834 148 91 9.7Macedonia, FYR 4.12 2 24.0 45.5 19.1 1.3 3,591 107 57 3.9Madagascar 0.08 8 .. 11.7 13.0 b 0.7 .. 41 2 8.4Malawi 0.08 39 24.6 38.0 .. .. .. 26 3 3.2Malaysia 2.42 6 137.2 128.7 15.3 1.6 4,117 127 61 43.4Maldives 3.09 9 .. 82.5 11.0 .. .. 166 34 ..Mali .. 8 .. 16.6 14.6 b 1.8 .. 68 2 2.4Malta 9.52 40 38.5 159.2 27.7 0.7 4,151 125 69 47.2Marshall Islands .. 17 .. .. .. .. .. .. 4 ..Mauritania .. 19 .. 42.4 .. 3.8 .. 94 5 ..Mauritius 7.88 6 58.1 110.0 18.4 0.1 .. 99 35 0.8Mexico 0.87 9 35.4 45.5 .. 0.5 1,990 82 36 16.5Micronesia, Fed. Sts. .. 16 .. –18.3 .. .. .. 25 20 ..Moldova 1.32 9 .. 39.5 18.3 0.3 1,049 105 38 6.3Monaco .. .. .. .. .. .. .. 90 75 ..Mongolia .. 12 18.0 40.3 21.9 0.9 1,530 105 20 ..Montenegro 10.44 10 73.9 61.8 .. 2.0 5,547 185 40 ..Morocco 1.28 12 60.0 110.9 23.6 b 3.3 781 113 51 7.7Mozambique .. 13 .. 25.0 .. 0.9 444 33 4 26.5Myanmar .. .. .. .. .. .. 131 3 1 0.0Namibia .. 66 9.2 50.9 .. 3.4 1,479 96 12 1.6Nepal .. 29 24.0 66.6 13.2 1.4 93 44 9 0.3Netherlands 3.20 5 71.1 211.4 21.7 b 1.4 7,010 115 92 19.8New Caledonia .. .. .. .. .. .. .. 89 50 15.4New Zealand 14.53 1 44.9 155.8 27.5 b 1.1 9,566 109 86 9.3Nicaragua .. 39 .. 46.1 15.2 0.6 473 82 11 5.3Niger 0.00 17 .. 14.7 .. 0.9 .. 30 1 4.584 <strong>World</strong> <strong>Development</strong> <strong>Indicators</strong> <strong>2013</strong> Front ? User guide <strong>World</strong> view People Environment
States and markets 5BusinessentrydensityTimerequiredto start abusinessStock marketcapitalizationDomesticcreditprovidedby bankingsectorTax revenuecollectedby centralgovernmentMilitaryexpendituresElectricpowerconsumptionper capitaper 1,000peopleages15–64 days % of GDP % of GDP % of GDP % of GDP kilowatt-hoursMobile Individualscellular using thesubscriptions a Internet aper100 people% ofpopulationHigh-technologyexports% of manufacturedexports2011 June 2012 2011 2011 2011 2011 2010 2011 2011 2011Nigeria 0.83 34 16.1 37.5 0.3 1.0 136 59 28 1.1Northern Mariana Islands .. .. .. .. .. .. .. .. .. ..Norway 4.94 7 45.1 .. 28.4 b 1.6 25,175 116 94 18.5Oman 1.67 8 27.5 32.3 2.2 6.0 5,933 169 68 2.6Pakistan 0.03 21 15.6 43.3 9.3 3.0 457 62 9 1.8Palau .. 28 .. .. .. .. .. 75 .. ..Panama 0.08 7 39.9 104.9 .. .. 1,832 189 43 35.4Papua New Guinea .. 51 69.6 27.8 .. 0.5 .. 34 2 ..Paraguay .. 35 4.0 34.7 13.2 1.1 1,134 99 24 7.3Peru 2.54 26 44.8 18.7 15.9 1.2 1,106 110 37 6.2Philippines 0.19 36 73.6 51.8 12.3 1.1 643 99 29 46.4Poland 0.52 32 26.9 66.2 17.0 b 1.9 3,783 131 65 5.9Portugal 3.92 5 26.0 204.1 21.5 b 2.0 4,929 115 55 3.5Puerto Rico .. 6 .. .. .. .. .. 83 48 ..Qatar .. 9 72.5 70.2 14.4 2.2 14,997 123 86 0.0Romania 4.41 10 11.2 52.1 17.2 b 1.1 2,392 109 44 10.2Russian Federation 0.83 18 42.9 39.5 15.4 b 3.9 6,431 179 49 8.0Rwanda 0.78 3 .. .. .. 1.2 .. 41 7 3.4Samoa 1.37 9 .. 47.3 .. .. .. 91 7 0.2San Marino .. .. .. .. 22.3 .. .. 112 50 ..São Tomé and Príncipe 2.56 7 .. 39.5 .. .. .. 68 20 14.0Saudi Arabia .. 21 58.7 –4.8 .. 8.4 7,967 191 48 0.7Senegal 0.19 5 .. 31.5 .. 1.6 195 73 18 0.6Serbia 1.66 12 18.3 54.1 20.5 2.1 4,359 125 42 ..Seychelles .. 39 .. 45.8 31.7 0.9 .. 146 43 3.4Sierra Leone 0.38 12 .. 12.9 11.1 0.9 .. 36 0 ..Singapore 8.45 3 128.6 93.6 14.1 3.6 8,307 150 71 45.2Sint Maarten .. .. .. .. .. .. .. .. .. ..Slovak Republic 4.81 16 4.9 54.1 12.7 b 1.1 5,164 109 74 7.1Slovenia 4.04 6 12.8 94.7 17.9 1.4 6,521 107 72 5.9Solomon Islands .. 9 .. 15.0 .. .. .. 50 6 ..Somalia .. .. .. .. .. .. .. 7 1 ..South Africa 0.77 19 209.6 175.0 25.7 b 1.3 4,803 127 21 5.1South Sudan 0.31 .. .. .. .. 2.9 .. .. .. ..Spain 2.59 28 69.8 230.9 9.5 b 1.0 6,155 113 68 6.4Sri Lanka 0.58 7 32.8 46.2 12.4 2.6 449 87 15 1.0St. Kitts and Nevis 5.69 19 85.8 123.3 19.7 .. .. 153 76 0.1St. Lucia 3.00 15 .. 114.6 .. .. .. 123 42 16.9St. Martin .. .. .. .. .. .. .. .. .. ..St. Vincent and Grenadines .. 10 .. 56.6 22.2 .. .. 121 43 0.0Sudan .. 36 .. 23.0 .. .. 141 56 19 29.4Suriname 1.02 694 .. 24.1 .. .. .. 179 32 6.5Swaziland .. 56 .. 25.8 .. 3.0 .. 64 18 ..Sweden 7.17 16 87.1 142.3 21.9 b 1.3 14,939 119 91 13.3Switzerland 2.52 18 141.4 185.1 10.4 0.8 8,175 131 85 24.4Syrian Arab Republic 0.05 13 .. 47.7 .. 3.9 1,905 63 23 1.3Tajikistan 0.29 24 .. .. .. .. 2,004 91 13 ..Economy States and markets Global links Back<strong>World</strong> <strong>Development</strong> <strong>Indicators</strong> <strong>2013</strong> 85
5 States and marketsBusinessentrydensityTimerequiredto start abusinessStock marketcapitalizationDomesticcreditprovidedby bankingsectorTax revenuecollectedby centralgovernmentMilitaryexpendituresElectricpowerconsumptionper capitaper 1,000peopleages15–64 days % of GDP % of GDP % of GDP % of GDP kilowatt-hoursMobile Individualscellular using thesubscriptions a Internet aper100 people% ofpopulationHigh-technologyexports% of manufacturedexports2011 June 2012 2011 2011 2011 2011 2010 2011 2011 2011Tanzania .. 26 6.4 24.2 .. 1.1 78 56 12 5.4Thailand 0.59 29 77.7 159.0 17.6 b 1.6 2,243 112 24 20.7Timor-Leste .. 94 .. –26.5 .. 2.6 .. 53 1 ..Togo 0.11 38 .. 35.4 17.1 b 1.6 107 50 4 0.2Tonga 1.96 16 .. 29.0 .. .. .. 53 25 0.0Trinidad and Tobago .. 41 65.5 32.3 26.2 .. 5,894 136 55 0.1Tunisia 0.63 11 20.8 82.1 20.9 1.3 1,350 117 39 5.6Turkey 0.96 6 26.0 69.3 20.1 b 2.3 2,477 89 42 1.8Turkmenistan .. .. .. .. .. .. 2,403 69 5 ..Turks and Caicos Islands .. .. .. .. .. .. .. .. .. 2.1Tuvalu .. .. .. .. .. .. .. 22 30 ..Uganda 0.72 33 46.0 18.7 16.1 1.6 .. 48 13 21.9Ukraine 0.60 22 15.5 73.4 18.3 2.5 3,550 123 31 4.4United Arab Emirates 1.37 8 26.0 81.4 .. 5.4 11,044 149 70 3.2United Kingdom 10.41 13 118.7 212.6 27.4 b 2.6 5,733 131 82 21.3United States .. 6 104.3 234.9 10.1 b 4.7 13,394 93 78 18.1Uruguay 3.36 7 0.4 29.9 19.6 1.9 2,763 141 51 5.8Uzbekistan 0.82 12 .. .. .. .. 1,648 92 30 ..Vanuatu 2.18 35 .. 70.5 .. .. .. 56 8 ..Venezuela, RB .. 144 1.6 29.3 .. 0.8 3,287 98 40 2.5Vietnam .. 34 14.8 120.7 .. 2.2 1,035 143 35 8.6Virgin Islands (U.S.) .. .. .. .. .. .. .. .. 27 ..West Bank and Gaza .. 48 .. .. .. .. .. 46 41 ..Yemen, Rep. .. 40 .. 22.7 .. 4.4 249 47 15 0.3Zambia 1.26 17 20.9 18.0 16.6 1.6 623 61 12 24.8Zimbabwe .. 90 112.9 .. .. 1.6 1,022 72 16 1.0<strong>World</strong> 3.42 u 30 u 68.7 w 164.9 w 14.8 w 2.5 w 2,975 w 85 w 33 w 17.6 wLow income 0.32 30 .. 40.4 11.6 1.6 242 42 6 ..Middle income 2.30 35 47.7 92.4 13.2 2.0 1,823 86 27 17.1Lower middle income 1.01 31 43.2 58.9 11.9 2.0 698 80 16 9.3Upper middle income 3.50 40 48.8 101.3 13.6 2.0 2,942 92 38 18.6Low & middle income 2.01 34 47.4 91.6 13.2 2.0 1,661 80 24 17.0East Asia & Pacific 1.04 37 d 50.6 132.5 10.9 1.8 2,337 81 34 26.0Europe & Central Asia 2.82 15 d 32.9 49.2 17.1 3.0 4,059 132 42 6.3Latin America & Carib. 2.84 58 d 42.0 68.5 .. 1.3 1,973 107 39 10.9Middle East & N. Africa 0.36 25 d .. 53.6 23.8 3.5 1,658 89 27 2.9South Asia 0.16 19 d 48.2 69.7 10.3 2.5 555 69 9 6.4Sub- Saharan Africa 1.99 32 d .. 74.7 .. 1.5 553 53 13 2.8High income 6.38 18 78.6 203.2 14.6 2.8 9,415 114 76 17.9Euro area 5.10 13 41.9 153.5 17.6 1.5 6,847 125 73 14.9a. Data are from the International Telecommunication Union’s (ITU) <strong>World</strong> Telecommunication/ICT <strong>Indicators</strong> database. Please cite ITU for third party use of these data. b. Data werereported on a cash basis and have been adjusted to the accrual framework of the International Monetary Fund’s Government Finance Statistics Manual 2001. c. Differs from the officialvalue published by the government of China (1.3 percent; see National Bureau of Statistics of China, www.stats.gov.cn). d. Differs from data reported on the Doing Business websitebecause the regional aggregates on the Doing Business website include developed economies.86 <strong>World</strong> <strong>Development</strong> <strong>Indicators</strong> <strong>2013</strong> Front ? User guide <strong>World</strong> view People Environment
States and markets 5About the dataEntrepreneurial activityThe rate new businesses are added to an economy is a measure ofits dynamism and entrepreneurial activity. Data on business entrydensity are from the <strong>World</strong> Bank’s 2012 Entrepreneurship Database,which includes indicators for more than 150 countries for2004–11. Survey data are used to analyze firm creation, its relationshipto economic growth and poverty reduction, and the impact ofregulatory and institutional reforms. Data on total registered businesseswere collected from national registrars of companies. Forcross-country comparability, only limited liability corporations thatoperate in the formal sector are included. For additional informationon sources, methodology, calculation of entrepreneurship rates,and data limitations see http://www.doingbusiness.org/data/exploretopics/entrepreneurship.Data on time required to start a business are from the Doing Businessdatabase, whose indicators measure business regulation, gaugeregulatory outcomes, and measure the extent of legal protection ofproperty, the flexibility of employment regulation, and the tax burdenon businesses. The fundamental premise is that economic activityrequires good rules and regulations that are efficient, accessible,and easy to implement. Some indicators give a higher score for moreregulation, such as stricter disclosure requirements in related-partytransactions, and others give a higher score for simplified regulations,such as a one-stop shop for completing business startup formalities.There are 11 sets of indicators covering starting a business, registeringproperty, dealing with construction permits, getting electricity,enforcing contracts, getting credit, protecting investors, paying taxes,trading across borders, resolving insolvency, and employing workers.The indicators are available at www.doingbusiness.org.Doing Business data are collected with a standardized surveythat uses a simple business case to ensure comparability acrosseconomies and over time—with assumptions about the legal formof the business, its size, its location, and nature of its operation.Surveys in 185 countries are administered through more than 9,000local experts, including lawyers, business consultants, accountants,freight forwarders, government officials, and other professionals whoroutinely administer or advise on legal and regulatory requirements.The Doing Business methodology has limitations that should beconsidered when interpreting the data. First, the data collected referto businesses in the economy’s largest city and may not representregulations in other locations of the economy. To address this limitation,subnational indicators are being collected for selected economies;they point to significant differences in the speed of reformand the ease of doing business across cities in the same economy.Second, the data often focus on a specific business form—generallya limited liability company of a specified size—and may not representregulation for other types of businesses such as sole proprietorships.Third, transactions described in a standardized business caserefer to a specific set of issues and may not represent all the issuesa business encounters. Fourth, the time measures involve an elementof judgment by the expert respondents. When sources indicatedifferent estimates, the Doing Business time indicators representthe median values of several responses given under the assumptionsof the standardized case. Fifth, the methodology assumes that abusiness has full information on what is required and does not wastetime when completing procedures. In constructing the indicators, it isassumed that entrepreneurs know about all regulations and complywith them. In practice, entrepreneurs may not be aware of all requiredprocedures or may avoid legally required procedures altogether.Financial systemsStock markets and banking systems both enhance growth, the mainfactor in poverty reduction. At low levels of economic development commercialbanks tend to dominate the financial system, while at higherlevels domestic stock markets become more active and efficient.<strong>Open</strong> economies with sound macroeconomic policies, good legalsystems, and shareholder protection attract capital and thus havelarger financial markets. The table includes market capitalizationas a share of gross domestic product (GDP) as a measure of stockmarket size. Market size can be measured in other ways that mayproduce a different ranking of countries. Recent research on stockmarket development shows that modern communications technologyand increased financial integration have resulted in morecross-border capital flows, a stronger presence of financial firmsaround the world, and the migration of trading activities to internationalexchanges. Many firms in emerging markets now cross-liston international exchanges, which provides them with lower costcapital and more liquidity-traded shares. However, this also meansthat exchanges in emerging markets may not have enough financialactivity to sustain them. Comparability across countries may be limitedby conceptual and statistical weaknesses, such as inaccuratereporting and differences in accounting standards.Standard & Poor’s (S&P) Indices provides regular updates on 21emerging stock markets and 36 frontier markets. The S&P GlobalEquity Indices, S&P Indices’s leading emerging markets index, isdesigned to be sufficiently investable to support index tracking portfoliosin emerging market stocks that are legally and practically open toforeign portfolio investment. The S&P Frontier Broad Market Index measuresthe performance of 36 smaller and less liquid markets. Theseindexes are widely used benchmarks for international portfolio management.See www.spindices.com for further information on the indexes.Because markets included in S&P’s emerging markets categoryvary widely in level of development, it is best to look at the entirecategory to identify the most significant market trends. And it isuseful to remember that stock market trends may be distorted bycurrency conversions, especially when a currency has registereda significant devaluation (Demirgüç-Kunt and Levine 2006; Beckand Levine 2001; and Claessens, Klingebiel, and Schmukler 2002).Domestic credit provided by the banking sector as a share of GDPmeasures banking sector depth and financial sector development interms of size. Data are taken from the banking survey of the InternationalMonetary Fund’s (IMF) International Financial Statistics or, whenEconomy States and markets Global links Back<strong>World</strong> <strong>Development</strong> <strong>Indicators</strong> <strong>2013</strong> 87
5 States and marketsunavailable, from its monetary survey. The monetary survey includesmonetary authorities (the central bank), deposit money banks, andother banking institutions, such as finance companies, developmentbanks, and savings and loan institutions. In a few countries governmentsmay hold international reserves as deposits in the bankingsystem rather than in the central bank. Claims on the central governmentare a net item (claims on the central government minuscentral government deposits) and thus may be negative, resulting ina negative value for domestic credit provided by the banking sector.Tax revenuesTaxes are the main source of revenue for most governments. Taxrevenue as a share of GDP provides a quick overview of the fiscalobligations and incentives facing the private sector across countries.The table shows only central government data, which maysignificantly understate the total tax burden, particularly in countrieswhere provincial and municipal governments are large or have considerabletax authority.Low ratios of tax revenue to GDP may reflect weak administration andlarge-scale tax avoidance or evasion. Low ratios may also reflect asizable parallel economy with unrecorded and undisclosed incomes.Tax revenue ratios tend to rise with income, with higher income countriesrelying on taxes to finance a much broader range of socialservices and social security than lower income countries are able to.Military expendituresAlthough national defense is an important function of government,high expenditures for defense or civil conflicts burden the economyand may impede growth. Military expenditures as a share of GDPare a rough indicator of the portion of national resources used formilitary activities. As an “input” measure, military expenditures arenot directly related to the “output” of military activities, capabilities,or security. Comparisons across countries should take into accountmany factors, including historical and cultural traditions, the lengthof borders that need defending, the quality of relations with neighbors,and the role of the armed forces in the body politic.Data are from the Stockholm International Peace Research Institute(SIPRI), whose primary source of military expenditure data is officialdata provided by national governments. These data are derivedfrom budget documents, defense white papers, and other publicdocuments from official government agencies, including governmentresponses to questionnaires sent by SIPRI, the United NationsOffice for Disarmament Affairs, or the Organization for Security andCo-operation in Europe. Secondary sources include international statistics,such as those of the North Atlantic Treaty Organization (NATO)and the IMF’s Government Finance Statistics Yearbook. Other secondarysources include country reports of the Economist Intelligence Unit,country reports by IMF staff, and specialist journals and newspapers.In the many cases where SIPRI cannot make independent estimates,it uses country-provided data. Because of differences in definitionsand the difficulty of verifying the accuracy and completeness of data,data are not always comparable across countries. However, SIPRI putsa high priority on ensuring that the data series for each country is comparableover time. More information on SIPRI’s military expenditureproject can be found at www.sipri.org/research/armaments/milex.InfrastructureThe quality of an economy’s infrastructure, including power and communications,is an important element in investment decisions andeconomic development. The International Energy Agency (IEA) collectsdata on electric power consumption from national energy agenciesand adjusts the values to meet international definitions. Consumptionby auxiliary stations, losses in transformers that are consideredintegral parts of those stations, and electricity produced by pumpinginstallations are included. Where data are available, electricity generatedby primary sources of energy—coal, oil, gas, nuclear, hydro,geothermal, wind, tide and wave, and combustible renewables—areincluded. Consumption data do not capture the reliability of supplies,including breakdowns, load factors, and frequency of outages.The International Telecommunication Union (ITU) estimates thatthere were 5.9 billion mobile subscriptions globally in 2011. Notechnology has ever spread faster around the world. Mobile communicationshave a particularly important impact in rural areas.The mobility, ease of use, flexible deployment, and relatively lowand declining rollout costs of wireless technologies enable them toreach rural populations with low levels of income and literacy. Thenext billion mobile subscribers will consist mainly of the rural poor.Operating companies have traditionally been the main source oftelecommunications data, so information on subscriptions has beenwidely available for most countries. This gives a general idea of access,but a more precise measure is the penetration rate—the share ofhouseholds with access to telecommunications. During the past fewyears more information on information and communication technologyuse has become available from household and business surveys. Alsoimportant are data on actual use of telecommunications services. Thequality of data varies among reporting countries as a result of differencesin regulations covering data provision and availability.High-technology exportsThe method for determining high-technology exports was developedby the Organisation for Economic Co-operation and <strong>Development</strong> incollaboration with Eurostat. It takes a “product approach” (rather thana “sectoral approach”) based on research and development intensity(expenditure divided by total sales) for groups of products from Germany,Italy, Japan, the Netherlands, Sweden, and the United States.Because industrial sectors specializing in a few high-technology productsmay also produce low-technology products, the product approachis more appropriate for international trade. The method takes onlyresearch and development intensity into account, but other characteristicsof high technology are also important, such as knowhow, scientificpersonnel, and technology embodied in patents. Considering thesecharacteristics would yield a different list (see Hatzichronoglou 1997).?88 <strong>World</strong> <strong>Development</strong> <strong>Indicators</strong> <strong>2013</strong> Front User guide <strong>World</strong> view People Environment
States and markets 5Definitions• Business entry density is the number of newly registered limitedliability corporations per 1,000 people ages 15–64. • Timerequired to start a business is the number of calendar days to completethe procedures for legally operating a business using the fastestprocedure, independent of cost. • Stock market capitalization(also known as market value) is the share price times the number ofshares outstanding. • Domestic credit provided by banking sectoris all credit to various sectors on a gross basis, except to the centralgovernment, which is net. The banking sector includes monetaryauthorities, deposit money banks, and other banking institutionsfor which data are available. • Tax revenue collected by centralgovernment is compulsory transfers to the central government forpublic purposes. Certain compulsory transfers such as fines, penalties,and most social security contributions are excluded. Refundsand corrections of erroneously collected tax revenue are treated asnegative revenue. The analytic framework of the IMF’s GovernmentFinance Statistics Manual 2001 (GFSM 2001) is based on accrualaccounting and balance sheets. For countries still reporting governmentfinance data on a cash basis, the IMF adjusts reported data tothe GFSM 2001 accrual framework. These countries are footnotedin the table. • Military expenditures are SIPRI data derived fromNATO’s former definition (in use until 2002), which includes all currentand capital expenditures on the armed forces, including peacekeepingforces; defense ministries and other government agenciesengaged in defense projects; paramilitary forces, if judged to betrained and equipped for military operations; and military spaceactivities. Such expenditures include military and civil personnel,including retirement pensions and social services for military personnel;operation and maintenance; procurement; military researchand development; and military aid (in the military expenditures ofthe donor country). Excluded are civil defense and current expendituresfor previous military activities, such as for veterans benefits,demobilization, and weapons conversion and destruction. This definitioncannot be applied for all countries, however, since that wouldrequire more detailed information than is available about militarybudgets and off-budget military expenditures (for example, whethermilitary budgets cover civil defense, reserves and auxiliary forces,police and paramilitary forces, and military pensions). • Electricpower consumption per capita is the production of power plantsand combined heat and power plants less transmission, distribution,and transformation losses and own use by heat and powerplants, divided by midyear population. • Mobile cellular subscriptionsare the number of subscriptions to a public mobile telephoneservice that provides access to the public switched telephone networkusing cellular technology. Postpaid subscriptions and activeprepaid accounts (that is, accounts that have been used duringthe last three months) are included. The indicator applies to allmobile cellular subscriptions that offer voice communications andexcludes subscriptions for data cards or USB modems, subscriptionsto public mobile data services, private-trunked mobile radio,telepoint, radio paging, and telemetry services. • Individuals usingthe Internet are the percentage of individuals who have used theInternet (from any location) in the last 12 months. Internet canbe used via a computer, mobile phone, personal digital assistant,games machine, digital television, or similar device. • High-technologyexports are products with high research and developmentintensity, such as in aerospace, computers, pharmaceuticals, scientificinstruments, and electrical machinery.Data sourcesData on business entry density are from the <strong>World</strong> Bank’s EntrepreneurshipDatabase (www.doingbusiness.org/data/exploretopics/entrepreneurship). Data on time required to start a business arefrom the <strong>World</strong> Bank’s Doing Business project (www.doingbusiness.org). Data on stock market capitalization are from Standard &Poor’s (2012). Data on domestic credit are from the IMF’s InternationalFinancial Statistics. Data on central government tax revenueare from the IMF’s Government Finance Statistics. Data onmilitary expenditures are from SIPRI’s Military Expenditure Database(www.sipri.org/databases/milex). Data on electricity consumptionare from the IEA’s Energy Statistics of Non-OECD Countries, EnergyBalances of Non-OECD Countries, and Energy Statistics of OECDCountries and from the United Nations Statistics Division’s EnergyStatistics Yearbook. Data on mobile cellular phone subscriptionsand individuals using the Internet are from the ITU’s <strong>World</strong> Telecommunication/ICT<strong>Indicators</strong> database and TeleGeography. Dataon high-technology exports are from the United Nations StatisticsDivision’s Commodity Trade (Comtrade) database.ReferencesBeck, Thorsten, and Ross Levine. 2001. “Stock Markets, Banks, andGrowth: Correlation or Causality?” Policy Research Working Paper2670, <strong>World</strong> Bank, Washington, DC.Claessens, Stijn, Daniela Klingebiel, and Sergio L. Schmukler. 2002.“Explaining the Migration of Stocks from Exchanges in EmergingEconomies to International Centers.” Policy Research Working Paper2816, <strong>World</strong> Bank, Washington, DC.Demirgüç-Kunt, Asli, and Ross Levine. 1996. “Stock Market <strong>Development</strong>and Financial Intermediaries: Stylized Facts.” <strong>World</strong> BankEconomic Review 10 (2): 291–321.Geneva Declaration on Armed Violence and <strong>Development</strong>. 2011.Global Burden of Armed Violence. Geneva.Hatzichronoglou, Thomas. 1997. “Revision of the High-TechnologySector and Product Classification.” STI Working Paper 1997/2.Organisation for Economic Co-operation and <strong>Development</strong>, Directoratefor Science, Technology, and Industry, Paris.Standard & Poors. 2012. Global Stock Markets Factbook 2012. New York.WIPO (<strong>World</strong> Intellectual Property Organization). 2012. <strong>World</strong> IntellectualProperty <strong>Indicators</strong> 2012. Geneva.<strong>World</strong> Bank. 2012. CPIA Africa: Accessing Africa’s Policies and Institutions.Washington, DC.Economy States and markets Global links Back<strong>World</strong> <strong>Development</strong> <strong>Indicators</strong> <strong>2013</strong> 89
5 States and marketsTo access the <strong>World</strong> <strong>Development</strong> <strong>Indicators</strong> online tables, usethe URL http://wdi.worldbank.org/table/ and the table number (forexample, http://wdi.worldbank.org/table/5.1). To view a specificindicator online, use the URL http://data.worldbank.org/indicator/and the indicator code (for example, http://data.worldbank.org/indicator/IE.PPI.TELE.CD).5.1 Private sector in the economyTelecommunications investmentEnergy investmentTransport investmentWater and sanitation investmentDomestic credit to private sectorBusinesses registered, NewBusinesses registered, Entry density5.2 Business environment: enterprise surveysTime dealing with officialsAverage number of times meeting with taxofficialsTime required to obtain operating licenseInformal payments to public officialsLosses due to theft, robbery, vandalism,and arsonFirms competing against unregistered firmsFirms with female top managerFirms using banks to finance investmentValue lost due to electrical outagesInternationally recognized qualitycertification ownershipAverage time to clear exports through customsFirms offering formal trainingIE.PPI.TELE.CDIE.PPI.ENGY.CDIE.PPI.TRAN.CDIE.PPI.WATR.CDFS.AST.PRVT.GD.ZSIC.BUS.NREGIC.BUS.NDNS.ZSIC.GOV.DURS.ZSIC.TAX.METGIC.FRM.DURSIC.FRM.CORR.ZSIC.FRM.CRIM.ZSIC.FRM.CMPU.ZSIC.FRM.FEMM.ZSIC.FRM.BNKS.ZSIC.FRM.OUTG.ZSIC.FRM.ISOC.ZSIC.CUS.DURS.EXIC.FRM.TRNG.ZS5.3 Business environment: Doing Business indicatorsNumber of procedures to start a businessTime required to start a businessCost to start a businessNumber of procedures to register propertyTime required to register propertyNumber of procedures to build a warehouseTime required to build a warehouseTime required to get electricityNumber of procedures to enforce a contractTime required to enforce a contractBusiness disclosure indexTime required to resolve insolvency5.4 Stock marketsMarket capitalization, $Market capitalization, % of GDPValue of shares tradedTurnover ratioListed domestic companiesIC.REG.PROCIC.REG.DURSIC.REG.COST.PC.ZSIC.PRP.PROCIC.PRP.DURSIC.WRH.PROCIC.WRH.DURSIC.ELC.TIMEIC.LGL.PROCIC.LGL.DURSIC.BUS.DISC.XQIC.ISV.DURSCM.MKT.LCAP.CDCM.MKT.LCAP.GD.ZSCM.MKT.TRAD.GD.ZSCM.MKT.TRNRCM.MKT.LDOM.NOS&P/Global Equity Indices5.5 Financial access, stability, and efficiencyStrength of legal rights indexDepth of credit information indexDepositors with commercial banksBorrowers from commercial banksCommercial bank branchesAutomated teller machinesBank capital to assets ratioRatio of bank non-performing loans to totalgross loansDomestic credit provided by banking sectorInterest rate spreadRisk premium on lending5.6 Tax policiesTax revenue collected by central governmentNumber of tax payments by businessesTime for businesses to prepare, file andpay taxesBusiness profit taxBusiness labor tax and contributionsOther business taxesTotal business tax rate5.7 Military expenditures and arms transfersMilitary expenditure, % of GDPMilitary expenditure, % of centralgovernment expenditureArm forces personnelArm forces personnel, % of total labor forceArms transfers, ExportsArms transfers, Imports5.8 Fragile situationsInternational <strong>Development</strong> AssociationResource Allocation IndexPeacekeeping troops, police, and militaryobserversBattle related deathsIntentional homicidesMilitary expendituresLosses due to theft, robbery, vandalism,and arsonFirms formally registered when operationsstartedCM.MKT.INDX.ZGIC.LGL.CRED.XQIC.CRD.INFO.XQFB.CBK.DPTR.P3FB.CBK.BRWR.P3FB.CBK.BRCH.P5FB.ATM.TOTL.P5FB.BNK.CAPA.ZSFB.AST.NPER.ZSFS.AST.DOMS.GD.ZSFR.INR.LNDPFR.INR.RISKGC.TAX.TOTL.GD.ZSIC.TAX.PAYMIC.TAX.DURSIC.TAX.PRFT.CP.ZSIC.TAX.LABR.CP.ZSIC.TAX.OTHR.CP.ZSIC.TAX.TOTL.CP.ZSMS.MIL.XPND.GD.ZSMS.MIL.XPND.ZSMS.MIL.TOTL.P1MS.MIL.TOTL.TF.ZSMS.MIL.XPRT.KDMS.MIL.MPRT.KDIQ.CPA.IRAI.XQVC.PKP.TOTL.UNVC.BTL.DETHVC.IHR.PSRC.P5MS.MIL.XPND.GD.ZSIC.FRM.CRIM.ZSIC.FRM.FREG.ZS?90 <strong>World</strong> <strong>Development</strong> <strong>Indicators</strong> <strong>2013</strong> Front User guide <strong>World</strong> view People Environment
States and markets 5Children in employmentRefugees, By country of originRefugees, By country of asylumInternally displaced personsAccess to an improved water sourceAccess to improved sanitation facilitiesMaternal mortality ratio, National estimateMaternal mortality ratio, Modeled estimateUnder-five mortality rateDepth of food deficitPrimary gross enrollment ratio5.9 Public policies and institutionsInternational <strong>Development</strong> AssociationResource Allocation IndexMacroeconomic managementFiscal policyDebt policyEconomic management, AverageTradeFinancial sectorBusiness regulatory environmentStructural policies, AverageGender equalityEquity of public resource useBuilding human resourcesSocial protection and laborPolicies and institutions for environmentalsustainabilityPolicies for social inclusion and equity, AverageProperty rights and rule-based governanceQuality of budgetary and financial managementEfficiency of revenue mobilizationQuality of public administrationTransparency, accountability, andcorruption in the public sectorPublic sector management and institutions,Average5.10 Transport servicesTotal road networkPaved roadsRoad passengers carriedRoad goods hauledRail linesRailway passengers carriedRailway goods hauledPort container trafficRegistered air carrier departures worldwideAir passengers carriedSL.TLF.0714.ZSSM.POP.REFG.ORSM.POP.REFGVC.IDP.TOTL.HESH.H2O.SAFE.ZSSH.STA.ACSNSH.STA.MMRT.NESH.STA.MMRTSH.DYN.MORTSN.ITK.DFCTSE.PRM.ENRRIQ.CPA.IRAI.XQIQ.CPA.MACR.XQIQ.CPA.FISP.XQIQ.CPA.DEBT.XQIQ.CPA.ECON.XQIQ.CPA.TRAD.XQIQ.CPA.FINS.XQIQ.CPA.BREG.XQIQ.CPA.STRC.XQIQ.CPA.GNDR.XQIQ.CPA.PRES.XQIQ.CPA.HRES.XQIQ.CPA.PROT.XQIQ.CPA.ENVR.XQIQ.CPA.SOCI.XQIQ.CPA.PROP.XQIQ.CPA.FINQ.XQIQ.CPA.REVN.XQIQ.CPA.PADM.XQIQ.CPA.TRAN.XQIQ.CPA.PUBS.XQIS.ROD.TOTL.KMIS.ROD.PAVE.ZSIS.ROD.PSGR.K6IS.ROD.GOOD.MT.K6IS.RRS.TOTL.KMIS.RRS.PASG.KMIS.RRS.GOOD.MT.K6IS.SHP.GOOD.TUIS.AIR.DPRTIS.AIR.PSGRAir freight5.11 Power and communicationsElectric power consumption per capitaElectric power transmission anddistribution lossesFixed telephone subscriptionsMobile cellular subscriptionsFixed telephone international voice trafficMobile cellular network international voicetrafficPopulation covered by mobile cellular networkFixed telephone sub-basketMobile cellular sub-basketTelecommunications revenueMobile cellular and fixed-line subscribersper employee5.12 The information ageHouseholds with televisionHouseholds with a computerIndividuals using the InternetFixed (wired) broadband InternetsubscriptionsInternational Internet bandwidthFixed broadband sub-basketSecure Internet serversInformation and communicationstechnology goods, ExportsInformation and communicationstechnology goods, ImportsInformation and communicationstechnology services, Exports5.13 Science and technologyResearch and development (R&D), ResearchersResearch and development (R&D), TechniciansScientific and technical journal articlesExpenditures for R&DHigh-technology exports, $High-technology exports, % of manufacturedexportsCharges for the use of intellectual property,ReceiptsCharges for the use of intellectual property,PaymentsPatent applications filed, ResidentsPatent applications filed, NonresidentsTrademark applications filed, TotalIS.AIR.GOOD.MT.K1EG.USE.ELEC.KH.PCEG.ELC.LOSS.ZSIT.MLT.MAIN.P2IT.CEL.SETS.P2.. a.. a.. a.. a.. a.. a.. a.. a.. a.. aIT.NET.BBND.P2.. a.. aIT.NET.SECR.P6TX.VAL.ICTG.ZS.UNTM.VAL.ICTG.ZS.UNBX.GSR.CCIS.ZSSP.POP.SCIE.RD.P6SP.POP.TECH.RD.P6IP.JRN.ARTC.SCGB.XPD.RSDV.GD.ZSTX.VAL.TECH.CDTX.VAL.TECH.MF.ZSBX.GSR.ROYL.CDBM.GSR.ROYL.CDIP.PAT.RESDIP.PAT.NRESIP.TMK.TOTLData disaggregated by sex are available inthe <strong>World</strong> <strong>Development</strong> <strong>Indicators</strong> database.a. Available online only as part of the table, not as an individual indicator.Economy States and markets Global links Back<strong>World</strong> <strong>Development</strong> <strong>Indicators</strong> <strong>2013</strong> 91
GLOBALLINKS92 <strong>World</strong> <strong>Development</strong> <strong>Indicators</strong> <strong>2013</strong> Front ? User guide <strong>World</strong> view People Environment
The world economy is bound together by tradein goods and services, financial flows, and themovement of people. As national economiesdevelop, their links expand and grow more complex.The indicators in this section measure thesize and direction of these flows and documentthe effects of policy interventions and aid flowson the world economy.The optimistic economic momentum at thebeginning of 2011 slowed over the course of theyear. The adverse effects of the tsunami in Japancoupled with intensification of the sovereign debtcrisis in the euro area shook confidence at theglobal level. The slowdown became more pronouncedin high-income economies, reducing thegrowth in capital inflows to developing countries.Net debt and equity inflows to developing economiesin 2011 were $1.1 trillion—or 8 percentlower than in 2010 and below the level reachedbefore the global financial crisis. The downturnwas driven by the collapse of portfolio equity,again the most volatile of capital flows. Equityflows to emerging markets with good growth prospects,such as China, Brazil, and India, droppedsubstantially. Low- and middle-income economiesrecorded net inflows of only $8.3 billion in 2011,compared with $130 billion in 2010.Debt net inflows to developing countries in2011 were $437 billion—down 9 percent from2010. The slowdown was led by a drop in lendingby official creditors from $77 billion in 2010 to$30 billion in 2011. However, commercial bankfinancing tripled to $110 billion, and the privatesector created more liquidity through bondissuances, reaching their highest stock levelof $1.5 trillion. Net inflows of short-term debtshrank 27 percent in 2011 after being the fastestgrowing debt component the previous year.Global foreign direct investment (FDI) rose22.7 percent in 2011, to its pre-crisis level.Some 40 percent of those investments weredirected to developing economies. In 2011many developing countries continued to implementpolicy changes to further liberalize andfacilitate FDI entry and operations and to regulateFDI. The largest recipients of FDI inflowswere Brazil, China, India, and the RussianFederation, accounting for more than half ofinflows to developing economies. China wasthe largest recipient, with net FDI inflows of$220 billion, a decline of 10 percent comparedwith 2010.In 2011 world merchandise exports to developingcountries increased 27 percent from 2010,while exports to high-income countries increased20 percent. Brazil, China, India, and the RussianFederation were among the top traders, withChina accounting for 70 percent of East Asia andPacific’s merchandise trade.Official development assistance, a stablesource of development financing and bufferagainst the impact of several financial crises,was $134 billion in 2011, or 0.58 percent ofdeveloping countries’ combined gross nationalincome, down from 0.65 percent in 2010.<strong>World</strong>wide tourism continues to grow andhas become one of the largest and fastestgrowing economic sectors in the world. Thenumber of international tourist arrivals in 2011reached a record high of over 1 billion, andinbound tourism expenditures increased 12 percentto $1.3 trillion from 2010. The only developingregion that saw a drop in tourist arrivalsin 2011 was the Middle East and North Africa,due to political instability and armed conflict inthe region.6Economy States and markets Global links Back<strong>World</strong> <strong>Development</strong> <strong>Indicators</strong> <strong>2013</strong> 93
HighlightsEast Asia & Pacific: Equity investment dropsEquity inflows to East Asia and Pacific ($ billions)300Foreign direct investment250200150100500Portfolio equityAfter recovering from a 2009 low by 2010, equity investment in EastAsia and Pacific fell again in 2011. Turmoil in the euro area and thenatural disaster in Japan caused a large withdrawal of foreign equity.Foreign direct investment (FDI) net inflows combined with portfolioequity inflows in 2011 were 17 percent lower than in 2010. Net FDIflows declined 5 percent, while portfolio equity inflows fell to a fifththeir 2010 level. China, the largest recipient of capital flows into theregion (with 80 percent), recorded a 10 percent decline of FDI inflowscompared with 2010 and portfolio equity inflows a sixth of their 2010level. Investments in the service sector in China maintained theirgrowth rate.–50200020022004200620082010 2011Source: Online table 6.10.Europe & Central Asia: Remittance flows divergeRemittance inflows ($ billions)3025Commonwealth of Independent States2015Eastern Europe10502002 2004 2006 2008 2010 2011Source: Online table 6.14.High unemployment in the developed countries of the European Unionimpaired employment prospects of existing migrants and limited theirability to send money home. Remittance flows to developing countriesin Eastern Europe dropped sharply in 2009 and have yet to recover.Romania, one of the largest recipients of remittances in the EuropeanUnion, experienced an annual average decrease of 30 percent overthe last three years. In contrast, remittances to almost all the membercountries of the Commonwealth of Independent States reboundedstrongly. Rising employment and higher real wages in the RussianFederation gave migrants the opportunity to increase their remittances.Tajikistan, with the most emigrants to the Russian Federation,depends on remittances as a major source of external finance. In2011 it received $3.2 billion in remittances, equivalent to 46 percentof GDP.Latin America & Caribbean: More trade with developing countriesShare of total merchandise exports (%)80Brazil to high-income countries60Brazil to developing countries402002000 2002 2004 2006Source: Online table 6.4.Developing countries tohigh-income countriesDeveloping countries todeveloping countries20082010 2011Trade between developing countries continues to grow. Between 2000and 2010 merchandise exports between developing countries grewmore than 600 percent, while developing country exports to high-incomecountries grew half that amount. By 2011 a third of developing countrytrade went to other developing countries, while the share of merchandiseexports from developing countries to high-income countries fellfrom 77 percent in 2000 to about 63 percent. In Latin America and theCaribbean, Brazil is a leading example. Since 2009 Brazil’s merchandiseexports to developing countries have exceeded those to high-incomecountries—largely due to Brazil’s increased natural resource exports toAsia, particularly to China. In addition, intraregional trade has increasedsince 2009, especially between Common Market of the South members(Argentina, Brazil, Paraguay, Uruguay, and Venezuela), surpassing thelevel reached before the global financial crisis.94 <strong>World</strong> <strong>Development</strong> <strong>Indicators</strong> <strong>2013</strong>Front ? User guide <strong>World</strong> view People Environment
Middle East & North Africa: Tourist arrivals fall due to instabilityDespite increased worldwide tourism, tourist arrivals fell in theMiddle East and North Africa in 2011 due to political instability andarmed conflict in the region (<strong>World</strong> Tourism Organization 2012b).“The Arab Spring,” as it has come to be known, began in Tunisiawith mass demonstrations and riots at the end of 2010. As aresult, international tourist arrivals to Tunisia fell 31 percent, from6.9 million in 2010 to 4.8 million in 2011, the lowest level since1998, and tourist expenditures fell from $3.5 billion to $2.5 billion.In February 2011 Egypt’s government was overthrown. Egyptexperienced a 32 percent drop in tourist arrivals in 2011 after an18 percent increase in 2010. Heavily dependent on tourism, it sawtourist expenditures fall from $51.2 billion in 2010 to $43.1 billionin 2011. 0International tourist arrivals (millions)80604020200920102011Middle East & North Africa EgyptTunisiaSouth Asia: Encouraging investment in China and IndiaSource: Online table 6.15.China and India, the two largest and fastest growing economies inthe developing world, have altered their regulatory systems to attractand keep inflows of foreign direct investment (FDI). China startedfirst. It began opening its economy in 1979 and continued through toits membership in the <strong>World</strong> Trade Organization in 2001, reassuringinvestors of its increasing reliability. While FDI in China was driven byexport-oriented policies, India pursued an import substitution policy,promoting domestic firms and limiting the rights of foreign investors.It was not until the 1990s that India started significantly liberalizingFDI, and it only recently liberalized the FDI policies of its retail sector.Before the financial crisis net FDI inflows as a share of GDP to Indiabegan to catch up with those to China. After bottoming out in 2010,they began to recover, while net FDI inflows as a share of GDP to Chinadropped again.Net inflows of foreign direct investment (% of GDP)5432102000 2002 2004 2006 2008Source: Online table 6.10.ChinaIndia2010 2011Sub- Saharan Africa: Less official development assistance in 2011Official development assistance to Sub- Saharan Africa as a share ofthe region’s gross national income fell in 2011. But aid to three of thefive largest recipients, the Democratic Republic of Congo, São Toméand Príncipe, and Rwanda, rose. The Democratic Republic of Congo wassecond among all countries receiving aid from <strong>Development</strong> AssistanceCommittee (DAC) members (after Afghanistan). But this distinction islikely to be short lived. Like Liberia in 2010, the Democratic Republicof Congo benefited from debt forgiveness after reaching the completionpoint under the enhanced Heavily Indebted Poor Countries initiative inJuly 2010 and the subsequent Paris Club rescheduling agreement atthe end of 2010. As its two major Paris Club creditors, the United Statesand France were also the top DAC donors to the Democratic Republic ofCongo, increasing their aid to the country from $278 million to $1.3 billionand from $135 million to $1.1 billion respectively from 2010.Net official development assistance from all donors (% of GNI)150100500RwandaBurundiSource: Online table 6.12.São Toméand PríncipeCongo,Dem. Rep.200920102011LiberiaEconomy States and markets Global links Back<strong>World</strong> <strong>Development</strong> <strong>Indicators</strong> <strong>2013</strong> 95
6 Global linksMerchandisetradeNet barterterms oftrade indexInboundtourismexpenditureNet officialdevelopmentassistanceNetmigrationPersonaltransfers andcompensationof employees,received% of GDP 2000 = 100 % of exports % of GNI thousands $ millionsForeigndirectinvestmentNet inflow$ millionsPortfolioequityTotalexternaldebt stockNet inflow$ millions $ millionsTotal debtservice% of exportsof goods,services,and primaryincome a2011 2011 2011 2011 2005–10 2011 2011 2011 2011 2011Afghanistan 33.1 146.3 .. 35.0 –381 .. 83 .. 2,623 ..Albania 56.6 94.1 41.7 2.4 –48 1,162 1,370 2 5,938 9.3Algeria 63.5 199.1 0.4 0.1 –140 203 2,721 0 6,072 0.8American Samoa .. 129.0 .. .. .. .. .. .. .. ..Andorra .. .. .. .. .. .. .. .. .. ..Angola 82.9 244.7 1.0 0.2 82 0 –3,024 0 21,115 4.3Antigua and Barbuda 47.0 75.1 58.1 1.4 .. 20 58 .. .. ..Argentina 35.5 135.2 6.2 0.0 –200 686 8,671 –174 114,704 15.3Armenia 53.5 128.5 20.2 3.5 –75 1,994 663 0 7,383 25.4Aruba .. 118.5 19.8 .. 4 5 544 0 .. ..Australia 37.3 200.7 .. .. 1,125 1,871 67,638 –3,308 .. ..Austria 88.8 89.0 9.6 .. 160 2,674 15,734 483 .. ..Azerbaijan 71.3 187.6 4.0 0.5 53 1,893 4,485 0 8,427 4.9Bahamas, The 46.4 108.6 66.0 .. 6 .. 595 .. .. ..Bahrain .. 128.5 7.7 .. 448 .. 781 982 .. ..Bangladesh 54.2 54.8 0.4 1.2 –2,908 12,068 798 –10 27,043 5.5Barbados 62.7 111.0 .. .. 0 82 334 .. .. ..Belarus 156.3 103.8 1.9 0.2 –50 814 4,002 0 29,120 4.5Belgium 182.4 100.1 3.0 .. 200 10,912 102,000 –4,200 .. ..Belize 86.4 104.4 26.7 2.3 –1 76 95 .. 1,278 13.9Benin 61.7 125.1 .. 9.3 50 185 118 .. 1,423 ..Bermuda .. 72.4 .. .. .. 1,253 111 –3 .. ..Bhutan 90.6 151.5 .. 8.7 17 10 16 0 1,035 11.1Bolivia 66.8 175.4 5.5 3.3 –165 1,043 859 0 6,474 4.9Bosnia and Herzegovina 93.4 101.5 9.8 2.3 –10 1,958 380 .. 10,729 10.9Botswana 74.7 82.4 .. 0.7 19 63 587 .. 2,396 ..Brazil 19.9 135.8 2.3 0.0 –500 2,798 71,539 7,174 404,317 19.4Brunei Darussalam 94.7 200.6 .. .. 4 .. 1,208 .. .. ..Bulgaria 112.3 110.7 12.7 .. –50 1,483 2,588 –42 39,930 12.2Burkina Faso 42.3 141.2 .. 9.5 –125 111 7 .. 2,420 ..Burundi 36.1 172.6 1.6 24.8 370 45 3 .. 628 3.4Cambodia 126.7 70.6 24.1 6.5 –255 160 902 0 4,336 1.0Cameroon 44.0 149.6 .. 2.5 –19 115 360 .. 3,074 ..Canada 52.7 122.5 3.7 .. 1,098 .. 39,510 21,313 .. ..Cape Verde 53.7 106.0 55.5 13.3 –17 177 105 .. 1,025 5.0Cayman Islands .. 77.6 .. .. .. .. 7,408 .. .. ..Central African Republic 24.6 82.4 .. 12.4 5 .. 109 .. 573 ..Chad 64.3 208.8 .. 4.9 –75 .. 1,855 .. 1,821 ..Channel Islands .. .. .. .. 5 .. .. .. .. ..Chile 62.3 213.3 .. 0.0 30 4 17,299 4,477 96,245 15.2China 49.8 72.8 2.6 0.0 –1,884 40,483 220,143 5,308 685,418 3.6Hong Kong SAR, China 388.9 95.9 6.0 .. 176 357 95,352 9,814 .. ..Macao SAR, China 24.2 87.1 .. .. 51 48 2,116 0 .. ..Colombia 33.5 142.4 4.9 0.4 –120 4,205 13,605 1,969 76,918 15.6Comoros 49.5 76.1 .. 8.5 –10 .. 7 .. 278 ..Congo, Dem. Rep. 77.3 146.7 .. 38.4 –24 115 1,596 .. 5,448 2.4Congo, Rep. 110.2 214.5 .. 2.4 50 .. 2,931 .. 2,523 ..96 <strong>World</strong> <strong>Development</strong> <strong>Indicators</strong> <strong>2013</strong> Front ? User guide <strong>World</strong> view People Environment
Global links 6MerchandisetradeNet barterterms oftrade indexInboundtourismexpenditureNet officialdevelopmentassistanceNetmigrationPersonaltransfers andcompensationof employees,received% of GDP 2000 = 100 % of exports % of GNI thousands $ millionsForeigndirectinvestmentNet inflow$ millionsPortfolioequityTotalexternaldebt stockNet inflow$ millions $ millionsTotal debtservice% of exportsof goods,services,and primaryincome a2011 2011 2011 2011 2005–10 2011 2011 2011 2011 2011Costa Rica 65.2 78.1 15.4 0.1 76 520 2,157 0 10,292 13.5Côte d’Ivoire 74.0 159.0 .. 6.2 –360 373 344 .. 12,012 ..Croatia 57.7 99.0 36.6 0.0 10 1,378 1,265 17 .. ..Cuba .. 165.6 .. .. –190 .. 110 .. .. ..Curaçao .. 99.9 .. .. .. 34 70 0 .. ..Cyprus 42.1 103.1 25.5 .. 44 127 1,080 429 .. ..Czech Republic 144.6 104.0 5.2 .. 240 1,815 5,380 –2 .. ..Denmark 63.3 106.2 3.4 .. 90 1,273 13,106 –2,250 .. ..Djibouti .. 77.8 4.6 .. 0 32 79 0 767 ..Dominica 54.1 104.3 58.9 5.2 .. 23 34 .. 284 9.8Dominican Republic 47.1 92.4 31.4 0.4 –140 3,650 2,295 0 15,395 10.4Ecuador 70.7 130.4 3.4 0.3 –120 2,681 568 2 16,497 9.7Egypt, Arab Rep. 39.0 159.4 19.8 0.2 –347 14,324 –483 –711 35,001 7.4El Salvador 66.9 90.5 11.3 1.3 –292 3,665 247 0 11,995 21.7Equatorial Guinea 98.5 226.4 .. 0.2 20 .. 737 .. .. ..Eritrea 49.8 81.9 .. 6.3 55 .. 19 .. 1,055 ..Estonia 155.0 141.9 7.6 .. 0 407 436 –112 .. ..Ethiopia 38.1 136.5 34.4 11.8 –300 513 627 .. 8,597 6.1Faeroe Islands .. 103.1 .. .. .. 146 .. .. .. ..Fiji 82.8 107.8 .. 2.0 –29 158 204 .. 861 ..Finland 61.8 74.8 5.3 .. 73 751 –5,758 –5 .. ..France 47.3 95.6 8.0 .. 500 19,307 45,209 3,608 .. ..French Polynesia .. 83.1 .. .. 0 700 40 .. .. ..Gabon 95.6 218.6 .. 0.5 5 .. 728 .. 2,879 ..Gambia, The 48.8 91.7 32.4 15.6 –14 91 36 .. 466 7.5Georgia 64.4 133.8 20.2 3.9 –150 1,537 1,154 –7 11,124 26.9Germany 75.8 99.5 3.0 .. 550 13,160 39,067 7,778 .. ..Ghana 71.4 185.3 5.4 4.8 –51 152 3,222 1 11,289 2.4Greece 30.9 93.9 22.0 .. 154 1,186 1,092 –354 .. ..Greenland .. 72.4 .. .. .. .. .. .. .. ..Grenada 42.4 101.9 57.0 1.6 –5 29 41 .. 567 13.3Guam .. 85.0 .. .. 0 .. .. .. .. ..Guatemala 57.7 90.9 10.5 0.9 –200 4,508 1,081 0 16,286 15.6Guinea 73.7 109.9 0.1 4.5 –300 65 896 .. 3,139 11.2Guinea-Bissau 54.8 80.6 .. 12.3 –10 46 19 .. 284 ..Guyana 114.5 130.0 .. 6.2 –40 373 165 .. 1,846 ..Haiti 49.8 64.5 15.9 23.2 –240 1,551 181 0 783 0.5Honduras 97.2 89.8 8.5 3.8 –100 2,811 1,043 0 4,642 16.0Hungary 152.9 94.1 5.5 .. 75 2,441 9,629 –203 .. ..Iceland 72.5 90.3 9.0 .. 10 21 1,107 –11 .. ..India 40.5 135.9 .. 0.2 –3,000 63,818 32,190 –4,137 334,331 6.5Indonesia 44.6 134.1 4.1 0.1 –1,293 6,924 18,160 –326 213,541 14.5Iran, Islamic Rep. .. 180.9 .. .. –186 1,330 4,150 .. 19,113 1.4Iraq 119.0 211.8 1.9 1.7 –150 386 1,396 94 .. ..Ireland 88.9 86.2 4.2 .. 100 755 11,506 86,184 .. ..Isle of Man .. .. .. .. .. .. .. .. .. ..Israel 58.7 95.0 6.2 .. 274 595 11,374 –821 .. ..Economy States and markets Global links Back<strong>World</strong> <strong>Development</strong> <strong>Indicators</strong> <strong>2013</strong> 97
6 Global linksMerchandisetradeNet barterterms oftrade indexInboundtourismexpenditureNet officialdevelopmentassistanceNetmigrationPersonaltransfers andcompensationof employees,received% of GDP 2000 = 100 % of exports % of GNI thousands $ millionsForeigndirectinvestmentNet inflow$ millionsPortfolioequityTotalexternaldebt stockNet inflow$ millions $ millionsTotal debtservice% of exportsof goods,services,and primaryincome a2011 2011 2011 2011 2005–10 2011 2011 2011 2011 2011Italy 49.2 95.6 7.2 .. 1,999 7,025 28,003 5,978 .. ..Jamaica 55.4 68.6 48.1 0.4 –100 2,106 173 0 14,350 36.5Japan 28.6 60.1 1.3 .. 270 2,132 79 5,645 .. ..Jordan 91.1 76.5 29.4 3.4 203 3,453 1,469 109 17,634 6.7Kazakhstan 67.1 219.9 1.6 0.1 7 180 13,227 39 124,437 34.6Kenya 61.1 90.7 18.6 7.4 –189 934 335 20 10,258 4.2Kiribati 78.0 90.1 .. 27.2 .. .. 4 .. .. ..Korea, Dem. Rep. .. 79.6 .. .. 0 .. 55 .. .. ..Korea, Rep. 96.7 63.1 2.7 .. –30 8,494 4,661 –7,479 .. ..Kosovo .. .. .. 9.9 .. 1,122 546 0 1,531 8.9Kuwait 69.9 219.2 .. .. 278 .. 400 1,099 .. ..Kyrgyz Republic 105.1 109.4 20.3 9.7 –132 1,709 694 5 5,486 11.8Lao PDR 60.9 125.0 17.2 5.2 –75 110 301 11 6,158 ..Latvia 103.0 110.4 6.7 .. –10 695 1,502 38 38,255 47.0Lebanon 65.9 98.1 27.5 1.1 –13 7,322 3,476 240 24,767 19.9Lesotho 152.5 73.7 2.1 9.0 –20 649 132 0 792 ..Liberia 90.7 162.0 18.6 53.6 300 360 1,313 .. 448 ..Libya .. 185.4 .. .. –20 .. 200 0 .. ..Liechtenstein .. .. .. .. .. .. .. .. .. ..Lithuania 139.5 102.3 4.3 .. –36 1,956 1,443 9 29,988 20.1Luxembourg 85.6 98.5 5.3 .. 42 1,740 18,366 32,486 .. ..Macedonia, FYR 112.8 86.7 4.5 1.6 2 434 495 –8 6,286 18.9Madagascar 45.3 74.7 .. 4.2 –5 .. 907 .. 2,769 2.1Malawi 62.8 98.2 2.7 14.5 –20 17 92 –1 1,202 1.3Malaysia 144.0 100.7 7.4 0.0 84 1,198 12,001 .. 94,468 3.9Maldives 88.3 100.1 80.3 2.7 0 3 282 0 983 ..Mali 52.7 177.3 .. 12.3 –101 473 178 .. 2,931 ..Malta 120.2 53.6 16.1 .. 5 37 467 –7 .. ..Marshall Islands 100.8 107.2 .. 38.2 .. .. 7 .. .. ..Mauritania 125.1 131.5 .. 9.2 10 .. 45 .. 2,709 3.6Mauritius 69.3 71.5 30.5 1.7 0 1 273 9,387 1,435 1.4Mexico 61.6 107.9 3.4 0.1 –1,805 23,588 20,823 –6,244 287,037 11.2Micronesia, Fed. Sts. 62.8 97.3 .. 41.2 –9 .. 8 .. .. ..Moldova 105.9 105.9 8.3 6.0 –172 1,600 294 5 5,452 12.8Monaco .. .. .. .. .. .. .. .. .. ..Mongolia 129.1 226.8 4.7 4.3 –15 279 4,715 9 2,564 2.1Montenegro 70.6 .. .. 1.6 –3 343 558 –15 2,093 10.2Morocco 65.1 140.6 25.7 1.3 –675 7,256 2,521 166 29,049 9.9Mozambique 77.6 106.8 7.0 16.3 –20 157 2,079 0 4,097 1.6Myanmar .. 104.5 3.3 .. –500 127 1,001 .. 7,765 ..Namibia 85.5 116.7 12.1 2.4 –1 15 969 4 .. ..Nepal 35.5 77.9 22.3 4.7 –100 4,217 94 .. 3,956 9.5Netherlands 150.7 .. .. .. 8 .. .. .. .. ..New Caledonia .. 230.2 .. .. 6 519 1,745 0 .. ..New Zealand 46.8 132.6 11.3 .. 65 875 4,285 1,594 .. ..Nicaragua 80.4 82.8 8.0 7.6 –200 914 968 0 7,121 14.8Niger 60.7 163.9 .. 10.9 –29 102 1,014 .. 1,408 ..?98 <strong>World</strong> <strong>Development</strong> <strong>Indicators</strong> <strong>2013</strong> Front User guide <strong>World</strong> view People Environment
Global links 6MerchandisetradeNet barterterms oftrade indexInboundtourismexpenditureNet officialdevelopmentassistanceNetmigrationPersonaltransfers andcompensationof employees,received% of GDP 2000 = 100 % of exports % of GNI thousands $ millionsForeigndirectinvestmentNet inflow$ millionsPortfolioequityTotalexternaldebt stockNet inflow$ millions $ millionsTotal debtservice% of exportsof goods,services,and primaryincome a2011 2011 2011 2011 2005–10 2011 2011 2011 2011 2011Nigeria 71.3 211.4 0.7 0.8 –300 20,619 8,842 2,571 13,108 0.4Northern Mariana Islands .. 86.2 .. .. .. .. 0 .. .. ..Norway 51.4 156.6 3.2 .. 171 765 7,281 1,708 .. ..Oman 98.6 230.9 3.3 .. 153 39 788 –447 .. ..Pakistan 33.2 52.4 3.6 1.6 –2,000 12,263 1,309 –37 60,182 9.2Palau 76.1 104.2 .. 20.7 .. .. 2 .. .. ..Panama 133.3 86.4 12.2 0.4 11 388 3,223 0 12,583 3.6Papua New Guinea 92.4 166.0 .. 4.9 0 11 –309 .. 12,582 15.8Paraguay 74.8 107.5 2.3 0.4 –40 893 412 0 6,011 3.6Peru 47.6 159.0 5.8 0.4 –725 2,697 8,233 147 44,872 6.5Philippines 49.9 64.7 6.0 –0.1 –1,233 22,973 1,869 1,038 76,043 17.6Poland 76.8 99.7 5.0 .. 56 7,641 15,296 3,052 .. ..Portugal 58.6 86.8 17.3 .. 150 3,778 13,074 –10,557 .. ..Puerto Rico .. .. .. .. –145 .. .. .. .. ..Qatar 83.4 213.3 .. .. 857 574 –87 –903 .. ..Romania 77.2 98.3 2.9 .. –100 3,889 2,557 –37 129,822 27.5Russian Federation 45.5 234.2 3.0 .. 1,136 4,951 52,878 –9,707 542,977 10.5Rwanda 33.1 225.7 .. 20.2 15 103 106 .. 1,103 ..Samoa 62.7 77.5 67.9 16.6 –16 139 15 .. 368 5.8San Marino .. .. .. .. .. .. .. .. .. ..São Tomé and Príncipe 57.6 120.3 54.2 30.2 –7 7 35 0 231 5.4Saudi Arabia 82.6 215.8 2.5 .. 1,056 244 16,308 .. .. ..Senegal 59.1 105.4 .. 7.5 –133 1,478 286 .. 4,320 ..Serbia 69.7 .. 7.2 1.3 0 3,271 2,700 69 31,569 31.5Seychelles 115.1 75.0 34.6 2.1 .. 26 139 0 1,780 3.2Sierra Leone 68.6 61.7 8.1 14.7 60 59 715 .. 1,049 3.8Singapore 323.4 81.2 .. .. 722 .. 64,003 –3,754 .. ..Sint Maarten .. .. .. .. .. 11 –48 .. .. ..Slovak Republic 163.0 87.4 3.0 .. 37 1,753 3,658 39 .. ..Slovenia 141.6 86.1 8.0 .. 22 433 818 222 .. ..Solomon Islands 104.3 87.9 .. 49.6 0 2 146 .. 256 2.0Somalia .. 100.3 .. .. –300 .. 102 .. 3,050 ..South Africa 53.5 154.1 9.1 0.3 700 1,158 5,889 –3,769 113,512 5.3South Sudan .. .. .. .. .. .. .. .. .. ..Spain 44.7 99.0 14.9 .. 2,250 9,907 31,419 2,978 .. ..Sri Lanka 51.0 72.1 10.4 1.0 –250 5,153 956 –623 23,984 9.3St. Kitts and Nevis 42.1 66.8 40.8 2.5 .. 48 114 .. .. ..St. Lucia 69.9 94.8 56.7 3.0 –1 29 81 .. 448 7.8St. Martin .. .. .. .. .. .. .. .. .. ..St. Vincent and Grenadines 53.8 107.2 48.3 2.8 –5 29 110 .. 283 15.2Sudan 28.3 229.4 .. 2.0 135 1,420 1,936 .. 21,169 ..Suriname 96.3 141.8 2.6 .. –5 4 145 0 .. ..Swaziland 97.8 105.3 .. 3.2 –6 55 95 .. 605 1.9Sweden 67.1 87.2 6.2 .. 266 776 3,054 2,146 .. ..Switzerland 67.1 79.8 5.0 .. 183 3,307 10,077 7,543 .. ..Syrian Arab Republic .. 143.7 .. .. –56 2,079 1,060 .. 4,968 ..Tajikistan 68.1 102.4 3.4 5.5 –296 3,060 11 0 3,323 ..Economy States and markets Global links Back<strong>World</strong> <strong>Development</strong> <strong>Indicators</strong> <strong>2013</strong> 99
6 Global linksMerchandisetradeNet barterterms oftrade indexInboundtourismexpenditureNet officialdevelopmentassistanceNetmigrationPersonaltransfers andcompensationof employees,received% of GDP 2000 = 100 % of exports % of GNI thousands $ millionsForeigndirectinvestmentNet inflow$ millionsPortfolioequityTotalexternaldebt stockNet inflow$ millions $ millionsTotal debtservice% of exportsof goods,services,and primaryincome a2011 2011 2011 2011 2005–10 2011 2011 2011 2011 2011Tanzania 66.3 151.4 19.9 10.4 –300 76 1,095 3 10,044 2.0Thailand 132.3 93.9 .. –0.1 492 4,554 7,780 875 80,039 3.8Timor-Leste 30.4 .. .. .. –50 131 47 .. .. ..Togo 77.3 30.4 .. 15.5 –5 337 54 .. 643 ..Tonga 44.7 81.2 .. 21.1 –8 72 10 .. 191 8.8Trinidad and Tobago 103.2 152.6 .. .. –20 91 574 .. .. ..Tunisia 91.2 95.0 11.2 1.5 –20 2,005 433 –44 22,335 10.7Turkey 48.5 88.6 15.4 0.1 –50 1,087 16,049 –986 307,007 30.2Turkmenistan 72.7 221.2 .. 0.2 –55 .. 3,186 .. 445 ..Turks and Caicos Islands .. 73.4 .. .. .. .. 97 .. .. ..Tuvalu 70.7 .. .. 76.9 .. .. 2 .. .. ..Uganda 45.0 119.7 24.2 9.6 –135 949 797 106 3,858 1.7Ukraine 91.4 124.0 6.1 0.5 –40 7,822 7,207 519 134,481 30.8United Arab Emirates 136.0 178.3 .. .. 3,077 .. 7,679 .. .. ..United Kingdom 45.4 101.4 5.9 .. 1,020 1,796 36,244 –16,894 .. ..United States 25.0 94.6 8.8 .. 4,955 5,810 257,528 27,350 .. ..Uruguay 40.1 100.9 18.7 0.0 –50 102 2,177 .. 14,350 11.1Uzbekistan 51.2 178.0 .. 0.5 –518 .. 1,403 .. 8,382 ..Vanuatu 47.4 91.9 71.2 12.4 0 22 58 0 202 1.6Venezuela, RB 44.3 258.7 0.9 0.0 40 138 5,226 .. 67,908 6.4Vietnam 164.8 99.9 5.3 3.0 –431 8,600 7,430 1,064 57,841 3.2Virgin Islands (U.S.) .. .. .. .. –4 .. .. .. .. ..West Bank and Gaza .. .. .. .. –90 1,545 .. .. .. ..Yemen, Rep. 59.0 157.5 9.2 1.5 –135 1,404 –713 0 6,418 2.8Zambia 83.3 192.8 1.6 6.1 –85 46 1,982 11 4,360 2.1Zimbabwe 81.8 110.5 .. 7.4 –900 .. 387 .. 6,275 ..<strong>World</strong> 51.8 .. 5.4 b 0.2 c .. 479,246 1,654,419 183,598 .. ..Low income 58.1 .. 12.0 b 8.8 c –6,808 27,628 18,331 124 133,292 4.6Middle income 51.4 .. 4.7 b 0.2 c –16,352 330,766 629,613 8,474 4,742,871 8.9Lower middle income 53.2 .. 6.5 b 0.8 c –12,699 202,300 108,774 –349 1,170,790 9.5Upper middle income 50.9 .. 4.3 b 0.1 c –3,653 128,466 520,838 8,822 3,572,081 8.8Low & middle income 51.5 .. 4.8 b 0.6 c –23,160 358,394 647,943 8,598 4,876,163 8.8East Asia & Pacific 57.2 .. 3.4 b 0.1 c –5,221 85,943 274,550 7,980 1,242,633 4.7Europe & Central Asia 57.0 .. 5.7 b 0.2 c –595 42,960 119,394 –10,115 1,484,186 17.8Latin America & Carib. 38.2 .. 4.7 b 0.2 c –5,088 59,532 161,618 7,351 1,233,484 13.4Middle East & N. Africa 67.3 .. 11.1 b .. –1,628 41,339 16,309 –145 166,124 5.1South Asia 40.7 .. 6.5 b 0.7 c –8,622 97,532 35,728 –4,807 454,138 6.7Sub- Saharan Africa 62.7 .. 6.5 b 3.9 c –2,006 31,088 40,345 8,334 295,598 3.4High income 51.9 .. 5.7 b 0.0 c 22,906 120,853 1,006,476 175,000 .. ..Euro area 70.8 .. 6.1 b 0.0 c 6,336 75,712 320,055 128,811 .. ..a. The numerator refers to 2011, whereas the denominator is a three-year average of 2009–11 data. b. Calculated using the <strong>World</strong> Bank’s weighted aggregation methodology (seeStatistical methods) and thus may differ from data reported by the <strong>World</strong> Tourism Organization. c. Based on the <strong>World</strong> Bank classification of economies and thus may differ from datareported by the Organisation for Economic Co‐operation and <strong>Development</strong>.100 <strong>World</strong> <strong>Development</strong> <strong>Indicators</strong> <strong>2013</strong> Front ? User guide <strong>World</strong> view People Environment
Global links 6About the dataStarting with <strong>World</strong> <strong>Development</strong> <strong>Indicators</strong> <strong>2013</strong>, the <strong>World</strong> Bank ischanging its presentation of balance of payments data to conformto the International Monetary Fund’s (IMF) Balance of PaymentsManual, 6th edition (BPM6). The historical data series based onBPM5 ends with data for 2005. Balance of payments data from2005 forward have been presented in accord with the BPM6 methodology,which can be accessed at www.imf.org/external/np/sta/bop/bop.htm.Trade in goodsData on merchandise trade are from customs reports of goodsmoving into or out of an economy or from reports of financialtransactions related to merchandise trade recorded in the balanceof payments. Because of differences in timing and definitions,trade flow estimates from customs reports and balance of paymentsmay differ. Several international agencies process tradedata, each correcting unreported or misreported data, leading toother differences. The most detailed source of data on internationaltrade in goods is the United Nations Statistics Division’sCommodity Trade Statistics (Comtrade) database. The IMF andthe <strong>World</strong> Trade Organization also collect customs-based dataon trade in goods.The “terms of trade” index measures the relative prices of a country’sexports and imports. The most common way to calculate termsof trade is the net barter (or commodity) terms of trade index, orthe ratio of the export price index to the import price index. When acountry’s net barter terms of trade index increases, its exports havebecome more expensive or its imports cheaper.TourismTourism is defined as the activity of people traveling to and stayingin places outside their usual environment for no more than one yearfor leisure, business, and other purposes not related to an activityremunerated from within the place visited. Data on inbound andoutbound tourists refer to the number of arrivals and departures,not to the number of unique individuals. Thus a person who makesseveral trips to a country during a given period is counted eachtime as a new arrival. Data on inbound tourism show the arrivals ofnonresident tourists (overnight visitors) at national borders. Whendata on international tourists are unavailable or incomplete, thetable shows the arrivals of international visitors, which include tourists,same-day visitors, cruise passengers, and crew members. Theaggregates are calculated using the <strong>World</strong> Bank’s weighted aggregationmethodology (see Statistical methods) and differ from the <strong>World</strong>Tourism Organization’s aggregates.For tourism expenditure, the <strong>World</strong> Tourism Organization uses balanceof payments data from the IMF supplemented by data fromindividual countries. These data, shown in the table, include traveland passenger transport items as defined by the Balance of Payments.When the IMF does not report data on passenger transportitems, expenditure data for travel items are shown.Official development assistanceData on official development assistance received refer to aid toeligible countries from members of the Organisation of EconomicCo-operation and <strong>Development</strong>’s (OECD) <strong>Development</strong> AssistanceCommittee (DAC), multilateral organizations, and non-DAC donors.Data do not reflect aid given by recipient countries to other developingcountries or distinguish among types of aid (program, project,or food aid; emergency assistance; or postconflict peacekeepingassistance), which may have different effects on the economy.Ratios of aid to gross national income (GNI), gross capital formation,imports, and government spending measure a country’sdependency on aid. Care must be taken in drawing policy conclusions.For foreign policy reasons some countries have traditionallyreceived large amounts of aid. Thus aid dependency ratios mayreveal as much about a donor’s interests as about a recipient’sneeds. Increases in aid dependency ratios can reflect events affectingboth the numerator (aid) and the denominator (GNI).Data are based on information from donors and may not be consistentwith information recorded by recipients in the balance ofpayments, which often excludes all or some technical assistance—particularly payments to expatriates made directly by the donor.Similarly, grant commodity aid may not always be recorded in tradedata or in the balance of payments. DAC statistics exclude aid formilitary and antiterrorism purposes. The aggregates refer to <strong>World</strong>Bank classifications of economies and therefore may differ fromthose reported by the OECD.Migration, personal transfers, and compensation ofemployeesThe movement of people, most often through migration, is a significantpart of global integration. Migrants contribute to the economiesof both their host country and their country of origin. Yet reliable statisticson migration are difficult to collect and are often incomplete,making international comparisons a challenge.Since data on emigrant stock is difficult for countries to collect,the United Nations Population Division provides data on net migration,taking into account the past migration history of a country orarea, the migration policy of a country, and the influx of refugeesin recent periods to derive estimates of net migration. The data tocalculate these estimates come from various sources, includingborder statistics, administrative records, surveys, and censuses.When there are insufficient data, net migration is derived throughthe difference between the growth rate of a country’s populationover a certain period and the rate of natural increase of that population(itself being the difference between the birth rate and thedeath rate).Migrants often send funds back to their home countries, which arerecorded as personal transfers in the balance of payments. Personaltransfers thus include all current transfers between resident andnonresident individuals, independent of the source of income of thesender (irrespective of whether the sender receives income fromEconomy States and markets Global links Back<strong>World</strong> <strong>Development</strong> <strong>Indicators</strong> <strong>2013</strong> 101
6 Global linkslabor, entrepreneurial or property income, social benefits, or anyother types of transfers or disposes of assets) and the relationshipbetween the households (irrespective of whether they are relatedor unrelated individuals).Compensation of employees refers to the income of border,seasonal, and other short-term workers who are employed in aneconomy where they are not resident and of residents employed bynonresident entities. Compensation of employees has three maincomponents: wages and salaries in cash, wages and salaries inkind, and employers’ social contributions.Equity flowsEquity flows comprise foreign direct investment (FDI) and portfolioequity. The internationally accepted definition of FDI (from BPM6)includes the following components: equity investment, includinginvestment associated with equity that gives rise to control or influence;investment in indirectly influenced or controlled enterprises;investment in fellow enterprises; debt (except selected debt); andreverse investment. The Framework for Direct Investment Relationshipsprovides criteria for determining whether cross-border ownershipresults in a direct investment relationship, based on controland influence.Direct investments may take the form of greenfield investment,where the investor starts a new venture in a foreign country by constructingnew operational facilities; joint venture, where the investorenters into a partnership agreement with a company abroad toestablish a new enterprise; or merger and acquisition, where theinvestor acquires an existing enterprise abroad. The IMF suggeststhat investments should account for at least 10 percent of votingstock to be counted as FDI. In practice many countries set a higherthreshold. Many countries fail to report reinvested earnings, and thedefinition of long-term loans differs among countries.Portfolio equity investment is defined as cross-border transactionsand positions involving equity securities, other than thoseincluded in direct investment or reserve assets. Equity securities areequity instruments that are negotiable and designed to be traded,usually on organized exchanges or “over the counter.” The negotiabilityof securities facilitates trading, allowing securities to be heldby different parties during their lives. Negotiability allows investorsto diversify their portfolios and to withdraw their investment readily.Included in portfolio investment are investment fund shares orunits (that is, those issued by investment funds) that are evidencedby securities and that are not reserve assets or direct investment.Although they are negotiable instruments, exchange-traded financialderivatives are not included in portfolio investment because theyare in their own category.External debtExternal indebtedness affects a country’s creditworthiness andinvestor perceptions. Data on external debt are gathered through the<strong>World</strong> Bank’s Debtor Reporting System (DRS). Indebtedness is calculatedusing loan-by-loan reports submitted by countries on longtermpublic and publicly guaranteed borrowing and using informationon short-term debt collected by the countries, from creditors throughthe reporting systems of the Bank for International Settlements, orbased on national data from the <strong>World</strong> Bank’s Quarterly ExternalDebt Statistics. These data are supplemented by information frommajor multilateral banks and official lending agencies in major creditorcountries. Currently, 128 developing countries report to the DRS.Debt data are reported in the currency of repayment and compiledand published in U.S. dollars. End-of-period exchange rates are usedfor the compilation of stock figures (amount of debt outstanding),and projected debt service and annual average exchange rates areused for the flows. Exchange rates are taken from the IMF’s InternationalFinancial Statistics. Debt repayable in multiple currencies,goods, or services and debt with a provision for maintenance of thevalue of the currency of repayment are shown at book value.While data related to public and publicly guaranteed debt arereported to the DRS on a loan-by-loan basis, data on long-termprivate nonguaranteed debt are reported annually in aggregate bythe country or estimated by <strong>World</strong> Bank staff for countries. Privatenonguaranteed debt is estimated based on national data from the<strong>World</strong> Bank’s Quarterly External Debt Statistics.Total debt service as a share of exports of goods, services, andprimary income provides a measure of a country’s ability to serviceits debt out of export earnings.102 <strong>World</strong> <strong>Development</strong> <strong>Indicators</strong> <strong>2013</strong> Front ? User guide <strong>World</strong> view People Environment
Global links 6Definitions• Merchandise trade includes all trade in goods and excludes tradein services. • Net barter terms of trade index is the percentage ratioof the export unit value indexes to the import unit value indexes, measuredrelative to the base year 2000. • Inbound tourism expenditureis expenditures by international inbound visitors, including paymentsto national carriers for international transport and any other prepaymentmade for goods or services received in the destination country.They may include receipts from same-day visitors, except when theseare important enough to justify separate classification. Data includetravel and passenger transport items as defined by Balance of Payments.When passenger transport items are not reported, expendituredata for travel items are shown. Exports refer to all transactionsbetween residents of a country and the rest of the world involvinga change of ownership from residents to nonresidents of generalmerchandise, goods sent for processing and repairs, nonmonetarygold, and services. • Net official development assistance is flows(net of repayment of principal) that meet the DAC definition of officialdevelopment assistance and are made to countries and territorieson the DAC list of aid recipients, divided by <strong>World</strong> Bank estimatesof GNI. • Net migration is the net total of migrants (immigrantsless emigrants, including both citizens and noncitizens) during theperiod. Data are five-year estimates. • Personal transfers and compensationof employees, received, are the sum of personal transfers(current transfers in cash or in kind made or received by residenthouseholds to or from nonresident households) and compensationof employees (remuneration for the labor input to the productionprocess contributed by an individual in an employer-employee relationshipwith the enterprise). • Foreign direct investment is crossborderinvestment associated with a resident in one economy havingcontrol or a significant degree of influence on the management of anenterprise that is resident in another economy. • Portfolio equity isnet inflows from equity securities other than those recorded as directinvestment or reserve assets, including shares, stocks, depositoryreceipts, and direct purchases of shares in local stock marketsby foreign investors • Total external debt stock is debt owed tononresident creditors and repayable in foreign currency, goods, orservices by public and private entities in the country. It is the sumof long-term external debt, short-term debt, and use of IMF credit.• Total debt service is the sum of principal repayments and interestactually paid in foreign currency, goods, or services on long-termdebt; interest paid on short-term debt; and repayments (repurchasesand charges) to the IMF. Exports of goods and services and primaryincome are the total value of exports of goods and services, receiptsof compensation of nonresident workers, and primary investmentincome from abroad.Data sourcesData on merchandise trade are from the <strong>World</strong> Trade Organization.Data on trade indexes are from the United Nations Conferenceon Trade and <strong>Development</strong>’s (UNCTAD) annual Handbook of Statistics.Data on tourism expenditure are from the <strong>World</strong> TourismOrganization’s Yearbook of Tourism Statistics and <strong>World</strong> TourismOrganization (2012a) and updated from its electronic files. Dataon net official development assistance are compiled by the OECD(http://stats.oecd.org). Data on net migration are from UnitedNations Population Division (2011). Data on personal transfersand compensation of employees are from the IMF’s Balance ofPayments Statistics Yearbook supplemented by <strong>World</strong> Bank staffestimates. Data on FDI are <strong>World</strong> Bank staff estimates basedon IMF balance of payments statistics and UNCTAD data (http://unctadstat.unctad.org/ReportFolders/reportFolders.aspx). Dataon portfolio equity are from the IMF’s Balance of Payments StatisticsYearbook. Data on external debt are mainly from reportsto the <strong>World</strong> Bank through its DRS from member countries thathave received International Bank for Reconstruction and <strong>Development</strong>loans or International <strong>Development</strong> Assistance credits, withadditional information from the files of the <strong>World</strong> Bank, the IMF,the African <strong>Development</strong> Bank and African <strong>Development</strong> Fund,the Asian <strong>Development</strong> Bank and Asian <strong>Development</strong> Fund, andthe Inter-American <strong>Development</strong> Bank. Summary tables of theexternal debt of developing countries are published annually inthe <strong>World</strong> Bank’s International Debt Statistics and InternationalDebt Statistics database.ReferencesIMF (International Monetary Fund). Various issues. International FinancialStatistics. Washington, DC.———. Various years. Balance of Payments Statistics Yearbook. Parts1 and 2. Washington, DC.UNCTAD (United Nations Conference on Trade and <strong>Development</strong>). Variousyears. Handbook of Statistics. New York and Geneva.United Nations Population Division. 2011. <strong>World</strong> Population Prospects:The 2010 Revision. New York: United Nations, Department of Economicand Social Affairs.<strong>World</strong> Bank. Various years. International Debt Statistics. Washington,DC.<strong>World</strong> Tourism Organization. 2012a. Compendium of Tourism Statistics2012. Madrid.———. 2012b Tourism Highlights: 2012 Edition. Madrid.———. Various years. Yearbook of Tourism Statistics. Vols. 1 and 2.Madrid.Economy States and markets Global links Back<strong>World</strong> <strong>Development</strong> <strong>Indicators</strong> <strong>2013</strong> 103
6 Global linksOnline tables and indicatorsTo access the <strong>World</strong> <strong>Development</strong> <strong>Indicators</strong> online tables, usethe URL http://wdi.worldbank.org/table/ and the table number (forexample, http://wdi.worldbank.org/table/6.1). To view a specificindicator online, use the URL http://data.worldbank.org/indicator/and the indicator code (for example, http://data.worldbank.org/indicator/TX.QTY.MRCH.XD.WD).6.1 Growth of merchandise tradeExport volumeImport volumeExport valueImport valueNet barter terms of trade indexTX.QTY.MRCH.XD.WDTM.QTY.MRCH.XD.WDTX.VAL.MRCH.XD.WDTM.VAL.MRCH.XD.WDTT.PRI.MRCH.XD.WDLead time to exportLead time to importDocuments to exportDocuments to importLiner shipping connectivity indexQuality of port infrastructureLP.EXP.DURS.MDLP.IMP.DURS.MDIC.EXP.DOCSIC.IMP.DOCSIS.SHP.GCNW.XQIQ.WEF.PORT.XQ6.2 Direction and growth of merchandise tradeThis table provides estimates of the flow oftrade in goods between groups of economies.6.3 High-income economy trade with low- andmiddle‐income economiesThis table illustrates the importance ofdeveloping economies in the global tradingsystem.6.4 Direction of trade of developing economiesExports to developing economies within regionExports to developing economies outside regionExports to high-income economiesImports from developing economies withinregionImports from developing economies outsideregionImports from high-income economies6.5 Primary commodity pricesThis table provides historical commodityprice data.6.6 Tariff barriersAll products, Binding coverageSimple mean bound rateSimple mean tariffWeighted mean tariffShare of tariff lines with international peaksShare of tariff lines with specific ratesPrimary products, Simple mean tariffPrimary products, Weighted mean tariff.. a.. aTX.VAL.MRCH.WR.ZSTX.VAL.MRCH.OR.ZSTX.VAL.MRCH.HI.ZSTM.VAL.MRCH.WR.ZSTM.VAL.MRCH.OR.ZSTM.VAL.MRCH.HI.ZS.. aTM.TAX.MRCH.BC.ZSTM.TAX.MRCH.BR.ZSTM.TAX.MRCH.SM.AR.ZSTM.TAX.MRCH.WM.AR.ZSTM.TAX.MRCH.IP.ZSTM.TAX.MRCH.SR.ZSTM.TAX.TCOM.SM.AR.ZSTM.TAX.TCOM.WM.AR.ZSManufactured products, Simple mean tariff TM.TAX.MANF.SM.AR.ZSManufactured products, Weighted meantariffTM.TAX.MANF.WM.AR.ZS6.8 External debtTotal external debt, $Total external debt, % of GNILong-term debt, Public and publiclyguaranteedLong-term debt, Private nonguaranteedShort-term debt, $Short-term debt, % of total debtShort-term debt, % of total reservesTotal debt servicePresent value of debt, % of GNIPresent value of debt, % of exports ofgoods, services and primary income6.9 Global private financial flowsForeign direct investment net inflows, $Foreign direct investment net inflows, %of GDPPortfolio equityBondsCommercial banks and other lendings6.10 Net official financial flowsNet financial flows from bilateral sourcesNet financial flows from multilateralsources<strong>World</strong> Bank, IDA<strong>World</strong> Bank, IBRDIMF, ConcessionalIMF, Non concessionalRegional development banks, ConcessionalRegional development banks,NonconcessionalRegional development banks, OtherinstitutionsDT.DOD.DECT.CDDT.DOD.DECT.GN.ZSDT.DOD.DPPG.CDDT.DOD.DPNG.CDDT.DOD.DSTC.CDDT.DOD.DSTC.ZSDT.DOD.DSTC.IR.ZSDT.TDS.DECT.EX.ZSDT.DOD.PVLX.GN.ZSDT.DOD.PVLX.EX.ZSBX.KLT.DINV.CD.WDBX.KLT.DINV.WD.GD.ZSBX.PEF.TOTL.CD.WDDT.NFL.BOND.CDDT.NFL.PCBO.CDDT.NFL.BLAT.CDDT.NFL.MLAT.CDDT.NFL.MIDA.CDDT.NFL.MIBR.CDDT.NFL.IMFC.CDDT.NFL.IMFN.CDDT.NFL.RDBC.CDDT.NFL.RDBN.CDDT.NFL.MOTH.CD6.7 Trade facilitationLogistics performance indexBurden of customs proceduresLP.LPI.OVRL.XQIQ.WEF.CUST.XQ6.11 Aid dependencyNet official development assistance (ODA)Net ODA per capitaDT.ODA.ODAT.CDDT.ODA.ODAT.PC.ZS104 <strong>World</strong> <strong>Development</strong> <strong>Indicators</strong> <strong>2013</strong> Front ? User guide <strong>World</strong> view People Environment
Global links 6Grants, excluding technical cooperation BX.GRT.EXTA.CD.WD6.13 Movement of peopleTechnical cooperation grantsBX.GRT.TECH.CD.WDNet migrationSM.POP.NETMNet ODA, % of GNIDT.ODA.ODAT.GN.ZSInternational migrant stockSM.POP.TOTLEmigration rate of tertiary educated toNet ODA, % of gross capital formation DT.ODA.ODAT.GI.ZSOECD countriesSM.EMI.TERT.ZSNet ODA, % of imports of goods andRefugees by country of originSM.POP.REFG.ORservices and incomeDT.ODA.ODAT.MP.ZSNet ODA, % of central governmentRefugees by country of asylumSM.POP.REFGexpenditureDT.ODA.ODAT.XP.ZS Personal transfers and compensation ofemployees, ReceivedBX.TRF.PWKR.CD.DT6.12 Distribution of net aid by <strong>Development</strong> AssistanceCommittee membersPersonal transfers and compensation ofemployees, PaidBM.TRF.PWKR.CD.DTNet bilateral aid flows from DAC donorsDC.DAC.TOTL.CDUnited StatesDC.DAC.USAL.CD6.14 Travel and tourismEU institutionsDC.DAC.CECL.CDInternational inbound touristsST.INT.ARVLGermanyDC.DAC.DEUL.CDInternational outbound touristsST.INT.DPRTFranceDC.DAC.FRAL.CDInbound tourism expenditure, $ST.INT.RCPT.CDUnited KingdomDC.DAC.GBRL.CDInbound tourism expenditure, % of exports ST.INT.RCPT.XP.ZSJapanDC.DAC.JPNL.CDOutbound tourism expenditure, $ST.INT.XPND.CDNetherlandsDC.DAC.NLDL.CDOutbound tourism expenditure, % ofimportsST.INT.XPND.MP.ZSAustraliaDC.DAC.AUSL.CDCanadaDC.DAC.CANL.CDNorwayDC.DAC.NORL.CDa. Available online only as part of the table, not as an individual indicator.b. Derived from data elsewhere in the <strong>World</strong> <strong>Development</strong> <strong>Indicators</strong> database.Economy States and markets Global links Back<strong>World</strong> <strong>Development</strong> <strong>Indicators</strong> <strong>2013</strong> 105
106 <strong>World</strong> <strong>Development</strong> <strong>Indicators</strong> <strong>2013</strong> Front ? User guide <strong>World</strong> view People Environment
Primary data documentationAs a major user of socioeconomic data, the <strong>World</strong>Bank recognizes the importance of data documentationto inform users of differences in themethods and conventions used by primary datacollectors—usually national statistical agencies,central banks, and customs services—and byinternational organizations, which compile thestatistics that appear in the <strong>World</strong> <strong>Development</strong><strong>Indicators</strong> database. These differences maygive rise to significant discrepancies over time,both within countries and across them. Delays inreporting data and the use of old surveys as thebase for current estimates may further compromisethe quality of data reported here.This section provides information on sources,methods, and reporting standards of the principaldemographic, economic, and environmentalindicators in <strong>World</strong> <strong>Development</strong> <strong>Indicators</strong>. Additionaldocumentation is available from the <strong>World</strong>Bank’s Bulletin Board on Statistical Capacity athttp://data.worldbank.org.The demand for good-quality statisticaldata is ever increasing. Statistics provide theevidence needed to improve decisionmaking,document results, and heighten public accountability.The need for improved statistics to monitorthe Millennium <strong>Development</strong> Goals and theparallel effort to support a culture of resultsbasedmanagement has stimulated a decadelongeffort to improve statistics. The results havebeen impressive, but more needs to done.The “Statistics for Transparency, Accountability,and Results: A Busan Action Plan forStatistics” was endorsed by the Busan Partnershipfor Effective <strong>Development</strong> Cooperation atthe Fourth High-level Forum for Aid Effectivenessheld November 29–December 1, 2011, inBusan, Republic of Korea. This plan builds onthe progress made under the first global plan toimprove national and international statistics, the2004 Marrakech Action Plan for Statistics, butgoes beyond it in many ways. The main objectivesof the plan are to integrate statistics intodecisionmaking, promote open access to statisticswithin government and for all other uses, andincrease resources for statistical systems, bothfor investment in new capacity and for maintainingcurrent operations.Economy States and markets Global links Back<strong>World</strong> <strong>Development</strong> <strong>Indicators</strong> <strong>2013</strong> 107
Primary data documentationCurrencyNationalaccountsBalance of paymentsand tradeGovernment IMF datafinance disseminationstandardBaseyearReferenceyearSystem ofNationalAccountsSNApricevaluationAlternativeconversionfactorPPPsurveyyearBalance ofPaymentsManualin useExternaldebtSystemof tradeAccountingconceptAfghanistan Afghan afghani 2002/03 1993 B A G C GAlbania Albanian leka1996 1993 B Rolling 6 A G C GAlgeria Algerian dinar 1980 1968 B 6 A S B GAmerican Samoa U.S. dollar 1968 SAndorra Euro 1990 1968 SAngola Angolan kwanza 2002 1993 P 1991–96 2005 6 A S GAntigua and Barbuda East Caribbean dollar 2006 1968 B 6 G GArgentina Argentine peso 1993 1993 B 1971–84 2005 6 A S C SArmenia Armenian drama1996 1993 B 1990–95 2005 6 A S C SAruba Aruban florin 1995 1993 6 SAustralia Australian dollara2009 2008 B 2008 6 G C SAustria Euro 2005 1993 B Rolling 6 S C SAzerbaijan New Azeri manata2003 1993 B 1992–95 2005 6 A G B GBahamas, The Bahamian dollar 2006 1993 B 6 G B GBahrain Bahraini dinar 1985 1968 P 2005 6 G B GBangladesh Bangladeshi taka 1995/96 1993 B 2005 6 A G C GBarbados Barbados dollar 1974 1968 B 6 G B GBelarus Belarusian rubela2000 1993 B 1990–95 2005 6 A G C SBelgium Euro 2005 1993 B Rolling 6 S C SBelize Belize dollar 2000 1993 B 6 A G B GBenin CFA franc 1985 1968 P 1992 2005 6 A S B GBermuda Bermuda dollar 2006 1993 B 6 GBhutan Bhutanese ngultrum 2000 1993 B 2005 6 A G C GBolivia Bolivian Boliviano 1990 1968 B 1960–85 2005 6 A G C GBosnia and Herzegovina Bosnia and Herzegovinaa1996 1993 B Rolling 6 A S Cconvertible markBotswana Botswana pula 1993/94 1993 B 2005 6 A G B GBrazil Brazilian real 2000 1993 B 2005 6 A G C SBrunei Darussalam Brunei dollar 2000 1993 P 2005 S GBulgaria Bulgarian leva2002 1993 B 1978–89, Rolling 6 A S C S1991–92Burkina Faso CFA franc 1999 1993 B 1992–93 2005 6 A G B GBurundi Burundi franc 2008 1993 B 2005 6 A S C GCambodia Cambodian riel 2000 1993 B 2005 6 A S C GCameroon CFA franc 2000 1993 B 2005 6 A S B GCanada Canadian dollar 2005 1993 B 2008 6 G C SCape Verde Cape Verde escudo 1980 1968 P 2005 6 A G C GCayman Islands Cayman Islands dollar 1993 GCentral African Republic CFA franc 2000 1968 B 2005 6 P S B GChad CFA franc 1995 1993 B 2005 6 E S GChannel Islands Pound sterling 2003 2007 1968 BChile Chilean peso 2003 1993 B 2008 6 A S C SChina Chinese yuan 2000 1993 P 1978–93 2005 6 P S B GHong Kong SAR, China Hong Kong dollar 2009 1993 B 2005 6 G C SMacao SAR, China Macao pataca 2009 1993 B 2005 6 G C GColombia Colombian peso 2005 1993 B 1992–94 2005 6 A G B SComoros Comorian franc 1990 1968 P 2005 A SCongo, Dem. Rep. Congolese franc 2000 1968 B 1999–2001 2005 6 A S C GCongo, Rep. CFA franc 1990 1968 P 1993 2005 6 P S C GCosta Rica Costa Rican colon 1991 1993 B 6 A S C SCôte d’Ivoire CFA franc 1996 1968 P 2005 6 A S C GCroatia Croatian kunaa2005 1993 B Rolling 6 G C SCuba Cuban peso 2005 1993 B SCuraçaoNetherlands Antilles1993guilderCyprus Euroa2000 1993 B Rolling 6 G C SCzech Republic Czech koruna 2005 1993 B Rolling 6 S C S108 <strong>World</strong> <strong>Development</strong> <strong>Indicators</strong> <strong>2013</strong>Front ? User guide <strong>World</strong> view People Environment
LatestpopulationcensusLatest demographic,education, or healthhousehold surveySource of mostrecent incomeand expenditure dataVital Latestregistration agriculturalcomplete censusLatestindustrialdataLatesttradedataLatestwaterwithdrawaldataAfghanistan 1979 MICS, 2010/11 IHS, 2008 <strong>2013</strong>/14 2011 2000Albania 2011 DHS, 2009 LSMS, 2008 Yes 2009 2011 2006Algeria 2008 MICS, 2012 IHS, 1995 2011 2001American Samoa 2010 Yes 2007Andorra 2011 b Yes 2006Angola 1970 MIS, 2011; IBEP, 2008/09 IHS, 2000 1964/65 1991 2005Antigua and Barbuda 2011 Yes 2007 2011 2005Argentina 2010 MICS, 2011 IHS, 2011 Yes <strong>2013</strong> 2002 2011 2000Armenia 2011 DHS, 2010 IHS, 2010 Yes <strong>2013</strong>/14 2011 2007Aruba 2010 Yes 2011Australia 2011 ES/BS, 1994 Yes 2011 2006 2011 2000Austria 2011 b IS, 2000 Yes 2010 2009 2011 2002Azerbaijan 2009 DHS, 2006 ES/BS, 2008 Yes 2009 2011 2005Bahamas, The 2010 2011Bahrain 2010 Yes 2011 2003Bangladesh 2011 DHS, 2011 IHS, 2010 2008 2007 2008Barbados 2010 MICS, 2012 Yes 2011 2005Belarus 2009 MICS, 2012 ES/BS, 2009 Yes 2009 2011 2000Belgium 2011 IHS, 2000 Yes 2010 2009 2011 2007Belize 2010 MICS, 2011 ES/BS, 2011 2011 2000Benin 2002 DHS, 2011/12 CWIQ, 2007 2011/12 2010 2001Bermuda 2010 Yes 2011Bhutan 2005 MICS, 2010 IHS, 2010 2009 2011 2008Bolivia 2012 DHS, 2008 IHS, 2009 <strong>2013</strong> 2001 2011 2000Bosnia and Herzegovina 1991 MICS, 2011/12 LSMS, 2007 Yes 2011 2009Botswana 2011 DHS, 1988 ES/BS, 2008 2009 2011 2000Brazil 2010 LSMS, 1996/97 LFS, 2009 2006 2007 2011 2006Brunei Darussalam 2011 Yes 2006 1994Bulgaria 2011 LSMS, 2007 ES/BS, 2007 Yes 2010 2009 2011 2009Burkina Faso 2006 DHS, 2011 CWIQ, 2009 2010 2011 2001Burundi 2008 DHS, 2010 CWIQ, 2006 2010 2000Cambodia 2008 DHS, 2010 IHS, 2008 <strong>2013</strong> 2000 2011 2006Cameroon 2005 DHS, 2011 PS, 2007 1984 2002 2011 2000Canada 2011 LFS, 2000 Yes 2011 2008 2011 1986Cape Verde 2010 DHS, 2005 ES/BS, 2007 Yes 2011 2001Cayman Islands 2010 YesCentral African Republic 2003 MICS, 2010 PS, 2008 2011 2005Chad 2009 MICS, 2010 PS, 2002/03 2011 1995 2005Channel Islands 2009,2011 cChile 2012 IHS, 2009 Yes 2007 2008 2011 2007China 2010 NSS, 2007 IHS, 2008 2007 2007 2011 2005Hong Kong SAR, China 2011 d Yes 2009 2011Macao SAR, China 2011 Yes 2009 2007Colombia 2006 DHS, 2010 IHS, 2011 <strong>2013</strong> 2005 2011 2000Comoros 2003 DHS, 2012 IHS, 2004 2007 1999Congo, Dem. Rep. 1984 MICS, 2010 1-2-3, 2004/05 1990 1987 2005Congo, Rep. 2007 DHS, 2011/12 CWIQ/PS, 2011 1985/86 2009 2010 2002Costa Rica 2011 MICS, 2011 LFS, 2011 Yes 1973 2009 2011 1997Côte d’Ivoire 1998 DHS, 2012 IHS, 2008 2001 2011 2005Croatia 2011 ES/BS, 2008 Yes 2010 2011 2010Cuba 2012 MICS, 2010/11 Yes 2006 2007CuraçaoCyprus 2011 Yes 2010 2009 2011 2009Czech Republic 2011 RHS, 1993 IS, 1996 Yes 2010 2007 2011 2007Economy States and markets Global links Back<strong>World</strong> <strong>Development</strong> <strong>Indicators</strong> <strong>2013</strong> 109
Primary data documentationCurrencyNationalaccountsBalance of paymentsand tradeGovernment IMF datafinance disseminationstandardBaseyearReferenceyearSystem ofNationalAccountsSNApricevaluationAlternativeconversionfactorPPPsurveyyearBalance ofPaymentsManualin useExternaldebtSystemof tradeAccountingconceptDenmark Danish krone 2005 1993 B Rolling 6 S C SDjibouti Djibouti franc 1990 1968 B 2005 6 A G GDominica East Caribbean dollar 2006 1993 B 6 A S GDominican Republic Dominican peso 1991 1993 B 6 A G C GEcuador U.S. dollar 2000 1993 B 2005 6 A G B SEgypt, Arab Rep. Egyptian pound 1991/92 1993 B 2005 6 A G C SEl Salvador U.S. dollar 1990 1968 B 6 A S C SEquatorial Guinea CFA franc 2000 1968 B 1965–84 2005 GEritrea Eritrean nakfa 2000 1968 B 6 EEstonia Euro 2005 1993 B 1987–95 Rolling 6 S C SEthiopia Ethiopian birr 1999/2000 1993 B 2005 6 A G B GFaeroe Islands Danish krone 1993 B 6 GFiji Fijian dollar 2005 1993 B 2005 6 A G B GFinland Euro 2005 1993 B Rolling 6 G C SFrance Euroa2005 1993 B Rolling 6 S C SFrench Polynesia CFP franc 1990/91 1993 SGabon CFA franc 1991 1993 P 1993 2005 6 A S GGambia, The Gambian dalasi 2004 1993 P 2005 6 A G C GGeorgia Georgian laria1996 1993 B 1990–95 2005 6 A G C SGermany Euro 2005 1993 B Rolling 6 S C SGhana New Ghanaian cedi 2006 1993 B 1973–87 2005 6 A G B GGreece Euroa2005 1993 B Rolling 6 S C SGreenland Danish krone 1990 1993 GGrenada East Caribbean dollar 2006 1968 B 6 A S B GGuam U.S. dollar 1993 GGuatemala Guatemalan quetzal 2001 1993 B 6 A S B GGuinea Guinean franc 2003 1993 B 2005 6 P S B GGuinea-Bissau CFA franc 2005 1993 B 2005 6 E G GGuyana Guyana dollar 2006 1993 B 6 A S GHaiti Haitian gourde 1986/87 1968 B 1991 6 A G GHonduras Honduran lempira 2000 1993 B 1988–89 6 A S C GHungary Hungarian forinta2005 1993 B Rolling 6 S C SIceland Iceland krona 2005 1993 B Rolling 6 G C SIndia Indian rupee 2004/05 1993 B 2005 6 A G C SIndonesia Indonesian rupiah 2000 1993 P 2005 6 A S B SIran, Islamic Rep. Iranian rial 1997/98 1993 B 1980–2002 2005 6 A S C GIraq Iraqi dinar 1997 1968 B 1997, 2004 2005 6 GIreland Euro 2005 1993 B Rolling 6 G C SIsle of Man Pound sterling 2003 1968Israel Israeli new shekel 2005 1993 P 2008 6 S C SItaly Euro 2005 1993 B Rolling 6 S C SJamaica Jamaican dollar 2007 1993 B 6 A G C GJapan Japanese yen 2005 1993 B 2008 6 G C SJordan Jordanian dinar 1994 1968 B 2005 6 A G B SKazakhstan Kazakh tengea2000 1993 B 1987–95 2005 6 A G C SKenya Kenyan shilling 2001 1993 B 2005 6 A G B GKiribati Australian dollar 2006 1993 B 6 G GKorea, Dem. Rep. Democratic People’s1968 6Republic of Korean wonKorea, Rep. Korean won 2005 1993 B 2008 6 G C SKosovo Euro 2008 1993 A GKuwait Kuwaiti dinar 1995 1968 P 2005 6 S B GKyrgyz Republic Kyrgyz soma1995 1993 B 1990–95 2005 6 A S B SLao PDR Lao kip 2002 1993 B 2005 6 P S BLatvia Latvian lats 2000 1993 B 1987–95 Rolling 6 A S C SLebanon Lebanese pound 1997 1993 B 2005 6 A G B GLesotho Lesotho loti 1995 1993 B 2005 6 A G C G110 <strong>World</strong> <strong>Development</strong> <strong>Indicators</strong> <strong>2013</strong>Front ? User guide <strong>World</strong> view People Environment
LatestpopulationcensusLatest demographic,education, or healthhousehold surveySource of mostrecent incomeand expenditure dataVital Latestregistration agriculturalcomplete censusLatestindustrialdataLatesttradedataLatestwaterwithdrawaldataDenmark 2011 ITR, 1997 Yes 2010 2008 2011 2009Djibouti 2009 MICS, 2006 PS, 2002 2009 2000Dominica 2011 Yes 2010 2004Dominican Republic 2010 DHS, 2007 IHS, 2011 2012/13 2011 2005Ecuador 2010 RHS, 2004 LFS, 2011 <strong>2013</strong>/15 2008 2011 2005Egypt, Arab Rep. 2006 DHS, 2008 ES/BS, 2008 Yes 2010 2006 2011 2000El Salvador 2007 RHS, 2008 IHS, 2010 Yes 2008 2011 2007Equatorial Guinea 2002 2000Eritrea 1984 DHS, 2002 2009 2003 2004Estonia 2012 ES/BS, 2004 Yes 2010 2009 2011 2007Ethiopia 2007 DHS, 2011 ES/BS, 2010/11 2009 2011 2002Faeroe Islands 2011 Yes 2009Fiji 2007 ES/BS, 2009 Yes 2009 2008 2010 2000Finland 2010 IS, 2000 Yes 2010 2009 2011 2005France 2006 e ES/BS, 1994/95 Yes 2010 2009 2011 2007French Polynesia 2007 Yes 2011Gabon 2003 DHS, 2012 CWIQ/IHS, 2005 2009 2005Gambia, The 2003 MICS, 2010 IHS, 2010 2001/02 2004 2011 2000Georgia 2002 MICS, 2005 IHS, 2009 Yes 2009 2010 2005Germany 2011 e IHS, 2000 Yes 2010 2009 2011 2007Ghana 2010 MICS, 2011 LSMS, 2005/06 <strong>2013</strong>/14 2003 2011 2000Greece 2011 IHS, 2000 Yes 2009 2007 2011 2007Greenland 2010 Yes 2011Grenada 2011 RHS, 1985 Yes 2012 2009 2005Guam 2010 YesGuatemala 2012 RHS, 2008/09 LSMS, 2011 Yes <strong>2013</strong> 2011 2006Guinea 1996 DHS, 2005 CWIQ, 2012 2008 2001Guinea-Bissau 2009 MICS, 2010 CWIQ, 2010 2005 2000Guyana 2012 DHS, 2009 IHS, 1998 2011 2000Haiti 2003 DHS, 2012 IHS, 2001 2008 1997 2000Honduras 2001 DHS, 2011/12 IHS, 2010 <strong>2013</strong> 2009 2006Hungary 2011 ES/BS, 2007 Yes 2010 2009 2011 2007Iceland 2011 Yes 2010 2005 2011 2005India 2011 DHS, 2006 IHS, 2010 2011 2008 2011 2010Indonesia 2010 DHS, 2012 IHS, 2012 <strong>2013</strong> 2008 2011 2000Iran, Islamic Rep. 2011 DHS, 2000 ES/BS, 2005 2003 2008 2011 2004Iraq 1997 MICS, 2011 IHS, 2007 2012 2009 2000Ireland 2011 IHS, 2000 Yes 2010 2009 2011 1979Isle of Man 2011 YesIsrael 2009 ES/BS, 2001 Yes 2008 2011 2004Italy 2012 ES/BS, 2000 Yes 2010 2009 2011 2000Jamaica 2011 MICS, 2011 LSMS, 2010 2007 2010 1993Japan 2010 IS, 1993 Yes 2010 2007 2011 2001Jordan 2004 DHS, 2012 ES/BS, 2010 2007 2009 2011 2005Kazakhstan 2009 MICS, 2010/11 ES/BS, 2011 Yes 2011 2010Kenya 2009 MIS, 2010;IHS, 2005/06 2007 2010 2003HIV/MCH SPA, 2010Kiribati 2010 2011Korea, Dem. Rep. 2008 MICS, 2009 2005Korea, Rep. 2010 ES/BS, 1998 Yes 2000 2008 2011 2002Kosovo 2011 IHS, 2009Kuwait 2010 FHS, 1996 Yes 2009 2009 2002Kyrgyz Republic 2009 DHS, 2012 ES/BS, 2010 Yes 2002 2009 2011 2006Lao PDR 2005 MICS, 2011/12 ES/BS, 2008 2010/11 1974 2005Latvia 2011 IHS, 2008 Yes 2010 2009 2011 2002Lebanon 1970 MICS, 2000 Yes 2011 2007 2011 2005Lesotho 2006 DHS, 2009 ES/BS, 2002/03 2010 2009 2000Economy States and markets Global links Back<strong>World</strong> <strong>Development</strong> <strong>Indicators</strong> <strong>2013</strong> 111
Primary data documentationCurrencyNationalaccountsBalance of paymentsand tradeGovernment IMF datafinance disseminationstandardBaseyearReferenceyearSystem ofNationalAccountsSNApricevaluationAlternativeconversionfactorPPPsurveyyearBalance ofPaymentsManualin useExternaldebtSystemof tradeAccountingconceptLiberia Liberian dollar 2000 1968 P 2005 6 A S B GLibya Libyan dinar 1999 1993 B 1986 6 G GLiechtenstein Swiss franc 1990 1993 B SLithuania Lithuanian litas 2000 1993 B 1990–95 Rolling 6 A G C SLuxembourg Euroa2005 1993 B Rolling 6 S C SMacedonia, FYR Macedonian denar 1995 1993 B Rolling 6 A S SMadagascar Malagasy ariary 1984 1968 B 2005 6 A S C GMalawi Malawi kwacha 2007 1993 B 2005 6 A G GMalaysia Malaysian ringgit 2000 1993 P 2005 6 E G B SMaldives Maldivian rufiyaa 2003 1993 B 2005 6 A G C GMali CFA franc 1987 1968 B 2005 6 A S B GMalta Euro 2005 1993 B Rolling 6 G C SMarshall Islands U.S. dollar 2004 1968 B GMauritania Mauritanian ouguiya 2004 1993 B 2005 6 A S GMauritius Mauritian rupee 2006 1993 B 2005 6 A G C SMexico Mexican peso 2003 1993 B 2008 6 A G C SMicronesia, Fed. Sts. U.S. dollar 2004 1993 BMoldova Moldovan leua1996 1993 B 1990–95 2005 6 A G C SMonaco Euro 1990 1993 SMongolia Mongolian tugrik 2005 1993 B 2005 6 A G C GMontenegro Euro 2000 1993 B Rolling 6 A S GMorocco Moroccan dirham 1998 1993 B 2005 6 A S C SMozambique New Mozambican metical 2003 1993 B 1992–95 2005 6 A S GMyanmar Myanmar kyat 2005/06 1968 P 6 E G CNamibia Namibian dollar 2004/05 1993 B 2005 6 G B GNepal Nepalese rupee 2000/01 1993 B 2005 6 A G C GNetherlands Euroa2005 1993 B Rolling 6 S C SNew Caledonia CFP franc 1990 1993 SNew Zealand New Zealand dollar 2005/06 1993 B 2008 6 G CNicaragua Nicaraguan gold cordoba 2006 1993 B 1965–95 6 A G B GNiger CFA franc 1987 1993 P 1993 2005 6 A S B GNigeria Nigerian naira 2002 1993 B 1971–98 2005 6 A G B GNorthern Mariana Islands U.S. dollar 1968Norway Norwegian kronea2005 1993 B Rolling 6 G C SOman Rial Omani 1988 1993 P 2005 6 G B GPakistan Pakistani rupee 1999/1993 B 2005 6 A G B G2000Palau U.S. dollar 1995 1993 B SPanama Panamanian balboa 1996 1993 B 6 A S C GPapua New Guinea Papua New Guinea kina 1998 1993 B 1989 6 A G B GParaguay Paraguayan guarani 1994 1993 P 2005 6 A S B GPeru Peruvian new sol 1994 1993 B 1985–90 2005 6 A S C SPhilippines Philippine peso 2000 1993 P 2005 6 A G B SPoland Polish zlotya2005 1993 B Rolling 6 S C SPortugal Euro 2005 1993 B Rolling 6 S C SPuerto Rico U.S. dollar 1954 1968 P GQatar Qatari riyal 2001 1993 P 2005 S B GRomania New Romanian leua2005 1993 B 1987–89, Rolling 6 A S C S1992Russian Federation Russian ruble 2000 1993 B 1987–95 2008 6 P G C SRwanda Rwandan franc 2006 1993 P 1994 2005 6 A G C GSamoa Samoan tala 2002 1993 B 6 A S GSan Marino Euro 1995 2000 1993 B C GSão Tomé and Príncipe São Tomé and Príncipe 2001 1993 P 2005 6 A S GdobraSaudi Arabia Saudi Arabian riyal 1999 1993 P 2005 6 S GSenegal CFA franc 1999 1987 1993 B 2005 6 A G B GSerbia New Serbian dinara2002 1993 B Rolling 6 A S C G112 <strong>World</strong> <strong>Development</strong> <strong>Indicators</strong> <strong>2013</strong>Front ? User guide <strong>World</strong> view People Environment
LatestpopulationcensusLatest demographic,education, or healthhousehold surveySource of mostrecent incomeand expenditure dataVital Latestregistration agriculturalcomplete censusLatestindustrialdataLatesttradedataLatestwaterwithdrawaldataLiberia 2008 MIS, 2011 CWIQ, 2007 1984 2000Libya 2006 2010 2000Liechtenstein 2010 YesLithuania 2011 ES/BS, 2008 Yes 2010 2009 2011 2007Luxembourg 2011 Yes 2010 2009 2011 1999Macedonia, FYR 2011 MICS, 2011 ES/BS, 2009 Yes 2007 2009 2011 2007Madagascar 1993 MIS, 2011 PS, 2010 2006 2011 2000Malawi 2008 MIS, 2012; LSMS, 2010/11 IHS, 2010/11 2007 2009 2011 2005Malaysia 2010 ES/BS, 2009 Yes 2012 2008 2011 2005Maldives 2006 DHS, 2009 IHS, 2010 Yes 2011 2008Mali 2009 DHS, 2012 IHS, 2009/10 2010 2000Malta 2011 Yes 2010 2008 2011 2002Marshall Islands 2011Mauritania 2000 MICS, 2011 IHS, 2008 2011 2005Mauritius 2011 RHS, 1991 Yes 2007 2011 2003Mexico 2010 ENPF, 1995 LFS, 2010 2007 2007 2011 2009Micronesia, Fed. Sts. 2010 IHS, 2000Moldova 2004 MICS, 2012 ES/BS, 2010 Yes 2011 2009 2011 2007Monaco 2008 Yes 2009Mongolia 2010 MICS, 2010 LSMS, 2011 Yes 2012 2008 2007 2009Montenegro 2011 MICS, 2005/06 ES/BS, 2011 Yes 2010 2011 2010Morocco 2004 MICS/PAPFAM, 2006 ES/BS, 2007 2012 2009 2010 2000Mozambique 2007 DHS, 2011 ES/BS, 2008/09 2010 2011 2001Myanmar 1983 MICS, 2009/10 2011/12 2003 2010 2000Namibia 2011 HIV/MCH, 2009 ES/BS, 2009 2011 2002Nepal 2011 DHS, 2011 LSMS, 2011 2012 2008 2011 2006Netherlands 2011 IHS, 1999 Yes 2010 2008 2011 2008New Caledonia 2009 Yes 2011New Zealand 2006 IS, 1997 Yes 2012 2008 2011 2002Nicaragua 2005 RHS, 2006/07 LSMS, 2009 2011 2011 2001Niger 2012 DHS, 2012 CWIQ/PS, 2008 2008 2002 2011 2005Nigeria 2006 MICS, 2011 IHS, 2010 2007 2011 2005Northern Mariana Islands 2010Norway 2011 IS, 2000 Yes 2010 2008 2011 2006Oman 2010 MICS, 2012 2007 2011 2003Pakistan 1998 DHS, 2012 IHS, 2008 2010 2006 2011 2008Palau 2010 YesPanama 2010 LSMS, 2008 LFS, 2010 2011 2001 2011 2000Papua New Guinea 2011 LSMS, 1996 IHS, 1996 2004 2005Paraguay 2012 RHS, 2008 IHS, 2011 2008 2002 2011 2000Peru 2007 Continuous DHS, 2012 IHS, 2011 2012 2007 2011 2000Philippines 2010 DHS, 2008 ES/BS, 2009 Yes 2012 2006 2011 2009Poland 2011 ES/BS, 2010 Yes 2010 2009 2011 2009Portugal 2011 IS, 1997 Yes 2009 2009 2011 2002Puerto Rico 2010 RHS, 1995/96 Yes 2007 2006 2005Qatar 2010 MICS, 2012 Yes 2006 2010 2005Romania 2011 RHS, 1999 LFS, 2010 Yes 2010 2009 2011 2009Russian Federation 2010 LSMS, 1992 IHS, 2010 Yes 2006 2009 2011 2001Rwanda 2012 Special DHS, 2011 IHS, 2011 2008 2011 2000Samoa 2011 DHS, 2009 2009 2011San Marino 2010 YesSão Tomé and Príncipe 2012 DHS, 2008/09 PS, 2009/10 2011/12 2010 1993Saudi Arabia 2010 Demographic survey, 2007 2010 2006 2011 2006Senegal 2002 Continuous DHS, 2012 PS, 2010/11 2011/12 2009 2011 2002Serbia 2011 MICS, 2010 IHS, 2010 Yes 2012 2009 2011 2009Economy States and markets Global links Back<strong>World</strong> <strong>Development</strong> <strong>Indicators</strong> <strong>2013</strong> 113
Primary data documentationCurrencyNationalaccountsBalance of paymentsand tradeGovernment IMF datafinance disseminationstandardBaseyearReferenceyearSystem ofNationalAccountsSNApricevaluationAlternativeconversionfactorPPPsurveyyearBalance ofPaymentsManualin useExternaldebtSystemof tradeAccountingconceptSeychelles Seychelles rupee 2006 1993 P 6 A G C GSierra Leone Sierra Leonean leone 2006 1993 B 2005 6 A S B GSingapore Singapore dollar 2005 1993 B 2005 6 G C SSint MaartenNetherlands Antilles1993guilderSlovak Republic Euro 2005 1993 B Rolling 6 S C SSlovenia Euroa2005 1993 B Rolling 6 S C SSolomon Islands Solomon Islands dollar 2004 1993 B 6 A S GSomalia Somali shilling 1985 1968 B 1977–90 ESouth Africa South African rand 2005 1993 B 2005 6 P G C SSouth Sudan South Sudanese pound 1993Spain Euro 2005 1993 B Rolling 6 S C SSri Lanka Sri Lankan rupee 2002 1993 P 2005 6 A G B GSt. Kitts and Nevis East Caribbean dollar 2006 1993 B 6 S C GSt. Lucia East Caribbean dollar 2006 1968 B 6 A S GSt. Martin Euro 1993St. Vincent and Grenadines East Caribbean dollar 2006 1993 B 6 A S B GSudan Sudanese pound 1981/82 f 1996 1968 B 2005 6 A G B GSuriname Suriname dollar 1990 1993 B 6 G GSwaziland Swaziland lilangeni 2000 1993 B 2005 6 E G B GSweden Swedish kronaa2005 1993 B Rolling 6 G C SSwitzerland Swiss franc 2005 1993 B Rolling 6 S C SSyrian Arab Republic Syrian pound 2000 1968 B 1970–2010 2005 6 E S C GTajikistan Tajik somonia2000 1993 B 1990–95 2005 6 A G C GTanzania Tanzanian shillinga2001 1993 B 2005 6 A G GThailand Thai baht 1988 1993 P 2005 6 A S C STimor-Leste U.S. dollar 2000 2008 P G GTogo CFA franc 2000 1968 P 2005 6 A S B GTonga Tongan pa’anga 2010/11 1993 B 6 A G GTrinidad and Tobago Trinidad and Tobago 2000 1993 B 6 S C GdollarTunisia Tunisian dinar 1990 1993 B 2005 6 A G C STurkey New Turkish lira 1998 1993 B Rolling 6 A S B STurkmenistan New Turkmen manata2007 1993 B 1987–95,6 E G1997–2007Turks and Caicos Islands U.S. dollar 1993 GTuvalu Australian dollar 2005 1968 P GUganda Ugandan shilling 2001/02 1968 B 2005 6 A G B GUkraine Ukrainian hryvniaa2003 1993 B 1987–95 2005 6 A G C SUnited Arab Emirates U.A.E. dirham 2007 1993 P 6 G B GUnited Kingdom Pound sterling 2005 1993 B Rolling 6 G C SUnited States U.S. dollara2005 1993 B 2008 6 G C SUruguay Uruguayan peso 2005 1993 B 2005 6 A G C SUzbekistan Uzbek suma1997 1993 B 1990–95 6 A GVanuatu Vanuatu vatu 2006 1993 P 6 E G C GVenezuela, R.B. Venezuelan bolivar fuerte 1997 1993 B 2005 6 A G C GVietnam Vietnamese dong 1994 1993 P 1991 2005 6 A G GVirgin Islands (U.S.) U.S. dollar 1982 1968 GWest Bank and Gaza Israeli new shekel 1997 1968 B 6 S B SYemen, Rep. Yemeni rial 1990 1993 P 1990–96 2005 6 A S B GZambia Zambian kwacha 1994 1968 B 1990–92 2005 6 P S B GZimbabwe U.S. dollar 2009 1993 B 1991, 1998 2005 6 A G C G114 <strong>World</strong> <strong>Development</strong> <strong>Indicators</strong> <strong>2013</strong>Front ? User guide <strong>World</strong> view People Environment
LatestpopulationcensusLatest demographic,education, or healthhousehold surveySource of mostrecent incomeand expenditure dataVital Latestregistration agriculturalcomplete censusLatestindustrialdataLatesttradedataLatestwaterwithdrawaldataSeychelles 2010 IHS, 2007 Yes 2011 2008 2005Sierra Leone 2004 MICS, 2010 IHS, 2011 2002 2005Singapore 2010 General household, 2005 Yes 2009 2011 1975Sint Maarten 2001 Population Census, 2011Slovak Republic 2011 IS, 2009 Yes 2001 2009 2011 2007Slovenia 2011 b ES/BS, 2004 Yes 2010 2009 2011 2009Solomon Islands 2009 IHS, 2005/06 2012/13 2011Somalia 1987 MICS, 2006 1983 2003South Africa 2011 DHS, 2003 ES/BS, 2010 2012 2009 2011 2000South Sudan 2008 ES/BS, 2009Spain 2011 IHS, 2000 Yes 2010 2009 2011 2008Sri Lanka 2012 DHS, 2006/07 ES/BS, 2010 Yes <strong>2013</strong> 2008 2011 2005St. Kitts and Nevis 2011 Yes 2011St. Lucia 2010 MICS, 2012 IHS, 1995 Yes 2008 2005St. MartinSt. Vincent and Grenadines 2011 Yes 2011 1995Sudan 2008 SHHS, 2010 ES/BS, 2009 2001 2009 2005 gSuriname 2012 MICS, 2010 ES/BS, 1999 Yes 2008 2004 2011 2000Swaziland 2007 MICS, 2010 ES/BS, 2009/10 2007 2000Sweden 2011 IS, 2000 Yes 2010 2009 2011 2007Switzerland 2010 ES/BS, 2000 Yes 2008 2007 2011 2000Syrian Arab Republic 2004 MICS, 2006 ES/BS, 2004 1981 2009 2010 2005Tajikistan 2010 LSMS, 2009 LSMS, 2009 <strong>2013</strong> 2000 2006Tanzania 2012 AIS, 2011/12;ES/BS, 2011 2007/08 2007 2011 2002LSMS, 2010/11Thailand 2010 MICS, 2012 IHS, 2010 <strong>2013</strong> 2006 2011 2007Timor-Leste 2010 DHS, 2009/10 LSMS, 2007 2012 2005 2004Togo 2010 MICS, 2010 CWIQ, 2011 2011/12 2011 2002Tonga 2006 2011Trinidad and Tobago 2011 MICS, 2011 IHS, 1992 Yes 2006 2010 2000Tunisia 2004 MICS, 2011 IHS, 2010 2004 2006 2011 2001Turkey 2011 DHS, 2003 LFS, 2009 2008 2011 2003Turkmenistan 2012 MICS, 2011 LSMS, 1998 Yes 2000 2004Turks and Caicos Islands 2012 Yes 2011Tuvalu 2012 2008Uganda 2002 DHS, 2011 PS, 2009/10 2008 2000 2011 2002Ukraine 2001 MICS, 2012 ES/BS, 2009 Yes 2012/13 2004 2011 2005United Arab Emirates 2010 2012 2008 2005United Kingdom 2001 IS, 1999 Yes 2010 2009 2011 2007United States 2010 LFS, 2000 Yes 2007 2008 2011 2005Uruguay 2011 MICS, 2012 IHS, 2011 Yes 2011 2008 2009 2000Uzbekistan 1989 MICS, 2006 ES/BS, 2003 Yes 2005Vanuatu 2009 MICS, 2007 2007 2011Venezuela, R.B. 2011 MICS, 2000 IHS, 2011 Yes 2007 2011 2000Vietnam 2009 MICS, 2010/11 IHS, 2010 Yes 2011 2000 2010 2005Virgin Islands (U.S.) 2010 Yes 2007West Bank and Gaza 2007 MICS, 2010 IHS, 2009 1971 2009 2011 2005Yemen, Rep. 2004 MICS, 2006 ES/BS, 2005 2006 2011 2005Zambia 2010 DHS, 2007 IHS, 2010 2011 2002Zimbabwe 2012 DHS, 2010/11 IHS, 2003/04 2011 2002Note: For explanation of the abbreviations used in the table, see notes following the table.a. Original chained constant price data are rescaled. b. Population data compiled from administrative registers. c. Latest population census: Guernsey, 2009; Jersey, 2011. d. The populationcensuses for 1986 and 1996 were based on a one-in-seven sample of the population, while that for 2006 was based on a one-in-ten sample of the population. e. Rolling census based oncontinuous sample survey. f. Reporting period switch from fiscal year to calendar year from 1996. Pre-1996 data converted to calendar year. g. Includes South Sudan.Economy States and markets Global links Back<strong>World</strong> <strong>Development</strong> <strong>Indicators</strong> <strong>2013</strong> 115
Primary data documentation notes• Base year is the base or pricing period used for constantprice calculations in the country’s nationalaccounts. Price indexes derived from national accountsaggregates, such as the implicit deflator for grossdomestic product (GDP), express the price level relativeto base year prices. • Reference year is the yearin which the local currency constant price series of acountry is valued. The reference year is usually thesame as the base year used to report the constantprice series. However, when the constant price dataare chain linked, the base year is changed annually, sothe data are rescaled to a specific reference year toprovide a consistent time series. When the country hasnot rescaled following a change in base year, <strong>World</strong>Bank staff rescale the data to maintain a longer historicalseries. To allow for cross-country comparison anddata aggregation, constant price data reported in<strong>World</strong> <strong>Development</strong> <strong>Indicators</strong> are rescaled to a commonreference year (2000) and currency (U.S. dollars).• System of National Accounts identifies whether acountry uses the 1968, 1993, or 2008 System ofNational Accounts (SNA). • SNA price valuation showswhether value added in the national accounts isreported at basic prices (B) or producer prices (P). Producerprices include taxes paid by producers and thustend to overstate the actual value added in production.However, value added can be higher at basic pricesthan at producer prices in countries with high agriculturalsubsidies. • Alternative conversion factor identifiesthe countries and years for which a <strong>World</strong> Bank–estimated conversion factor has been used in place ofthe official exchange rate (line rf in the InternationalMonetary Fund’s [IMF] International Financial Statistics).See Statistical methods for further discussion ofalternative conversion factors. • Purchasing powerparity (PPP) survey year is the latest available surveyyear for the International Comparison Program’s estimatesof PPPs. • Balance of Payments Manual in userefers to the classification system used to compile andreport data on balance of payments. 6 refers to the 6thedition of the IMF’s Balance of Payments Manual(2009). • External debt shows debt reporting statusfor 2011 data. A indicates that data are as reported,P that data are based on reported or collected informationbut include an element of staff estimation, and Ethat data are <strong>World</strong> Bank staff estimates. • System oftrade refers to the United Nations general trade system(G) or special trade system (S). Under the general tradesystem goods entering directly for domestic consumptionand goods entered into customs storage arerecorded as imports at arrival. Under the special tradesystem goods are recorded as imports when declaredfor domestic consumption whether at time of entry oron withdrawal from customs storage. Exports underthe general system comprise outward-moving goods:(a) national goods wholly or partly produced in the country;(b) foreign goods, neither transformed nor declaredfor domestic consumption in the country, that moveoutward from customs storage; and (c) nationalizedgoods that have been declared for domestic consumptionand move outward without being transformed.Under the special system of trade, exports are categoriesa and c. In some compilations categories b and care classified as re-exports. Direct transit trade—goods entering or leaving for transport only—isexcluded from both import and export statistics. • Governmentfinance accounting concept is the accountingbasis for reporting central government financialdata. For most countries government finance data havebeen consolidated (C) into one set of accounts capturingall central government fiscal activities. Budgetarycentral government accounts (B) exclude some centralgovernment units. • IMF data dissemination standardshows the countries that subscribe to the IMF’s SpecialData Dissemination Standard (SDDS) or GeneralData Dissemination System (GDDS). S refers to countriesthat subscribe to the SDDS and have posted dataon the Dissemination Standards Bulletin Board athttp://dsbb.imf.org. G refers to countries that subscribeto the GDDS. The SDDS was established formember countries that have or might seek access tointernational capital markets to guide them in providingtheir economic and financial data to the public. TheGDDS helps countries disseminate comprehensive,timely, accessible, and reliable economic, financial,and sociodemographic statistics. IMF member countrieselect to participate in either the SDDS or theGDDS. Both standards enhance the availability oftimely and comprehensive data and therefore contributeto the pursuit of sound macroeconomic policies.The SDDS is also expected to improve the functioningof financial markets. • Latest population censusshows the most recent year in which a census wasconducted and in which at least preliminary resultshave been released. The preliminary results from thevery recent censuses could be reflected in timely revisionsif basic data are available, such as populationby age and sex, as well as the detailed definition ofcounting, coverage, and completeness. Countries thathold register-based censuses produce similar censustables every 5 or 10 years. Germany’s 2001 census isa register-based test census using a sample of 1.2percent of the population. A rare case, France has beenconducting a rolling census every year since 2004; the1999 general population census was the last to coverthe entire population simultaneously. • Latestdemographic, education, or health household surveyindicates the household surveys used to compile thedemographic, education, and health data in section 2.AIS is HIV/AIDS Indicator Survey, DHS is Demographicand Health Survey, ENPF is National Family PlanningSurvey, FHS is Family Health Survey, HIV/MCH isHIV/Maternal and Child Health, IBEP is Integrated Surveyon Population Welfare, LSMS is Living StandardsMeasurement Study Survey, MICS is Multiple IndicatorCluster Survey, MIS is Malaria Indicator Survey, NSSis National Sample Survey on Population Change,PAPFAM is Pan Arab Project for Family Health, RHS isReproductive Health Survey, SHHS is Sudan HouseholdHealth Survey, and SPA is Service ProvisionAssessments. Detailed information for AIS, DHS, MIS,and SPA are available at www.measuredhs.com; forMICS at www.childinfo.org; and for RHS at www.cdc.gov/reproductivehealth. • Source of most recentincome and expenditure data shows household surveysthat collect income and expenditure data. Namesand detailed information on household surveys can befound on the website of the International HouseholdSurvey Network (www.surveynetwork.org). Core WelfareIndicator Questionnaire Surveys (CWIQ), developedby the <strong>World</strong> Bank, measure changes in key socialindicators for different population groups—specificallyindicators of access, utilization, and satisfaction withcore social and economic services. Expendituresurvey/ budget surveys (ES/BS) collect detailed informationon household consumption as well as on generaldemographic, social, and economic characteristics.Integrated household surveys (IHS) collectdetailed information on a wide variety of topics, includinghealth, education, economic activities, housing,and utilities. Income surveys (IS) collect informationon the income and wealth of households as well asvarious social and economic characteristics. Incometax registers (ITR) provide information on a population’sincome and allowance, such as gross income, taxableincome, and taxes by socioeconomic group. Laborforce surveys (LFS) collect information on employment,unemployment, hours of work, income, and wages.Living Standards Measurement Study Surveys (LSMS),developed by the <strong>World</strong> Bank, provide a comprehensivepicture of household welfare and the factors that affectit; they typically incorporate data collection at the individual,household, and community levels. Priority surveys(PS) are a light monitoring survey, designed by the<strong>World</strong> Bank, that collect data from a large number ofhouseholds cost-effectively and quickly. 1-2-3 (1-2-3)surveys are implemented in three phases and collectsocio demographic and employment data, data on theinformal sector, and information on living conditions?116 <strong>World</strong> <strong>Development</strong> <strong>Indicators</strong> <strong>2013</strong> Front User guide <strong>World</strong> view People Environment
Primary data documentation notesand household consumption. • Vital registration completeidentifies countries that report at least 90 percentcomplete registries of vital (birth and death) statisticsto the United Nations Statistics Division and arereported in its Population and Vital Statistics Reports.Countries with complete vital statistics registries mayhave more accurate and more timely demographicindicators than other countries. • Latest agriculturalcensus shows the most recent year in which an agriculturalcensus was conducted and reported to theFood and Agriculture Organization of the UnitedNations. • Latest industrial data show the most recentyear for which manufacturing value added data at thethree-digit level of the International Standard IndustrialClassification (revision 2 or 3) are available in theUnited Nations Industrial <strong>Development</strong> Organizationdatabase. • Latest trade data show the most recentyear for which structure of merchandise trade datafrom the United Nations Statistics Division’s CommodityTrade (Comtrade) database are available. • Latestwater withdrawal data show the most recent year forwhich data on freshwater withdrawals have been compiledfrom a variety of sources.Exceptional reporting periodsIn most economies the fiscal year is concurrent withthe calendar year. Exceptions are shown in the tableat right. The ending date reported here is for the fiscalyear of the central government. Fiscal years forother levels of government and reporting years forstatistical surveys may differ.The reporting period for national accounts data isdesignated as either calendar year basis (CY) or fiscalyear basis (FY). Most economies report their nationalaccounts and balance of payments data using calendaryears, but some use fiscal years. In <strong>World</strong> <strong>Development</strong><strong>Indicators</strong> fiscal year data are assigned tothe calendar year that contains the larger share ofthe fiscal year. If a country’s fiscal year ends beforeJune 30, data are shown in the first year of the fiscalperiod; if the fiscal year ends on or after June 30, dataare shown in the second year of the period. Balanceof payments data are reported in <strong>World</strong> <strong>Development</strong><strong>Indicators</strong> by calendar year.Revisions to national accounts dataNational accounts data are revised by national statisticaloffices when methodologies change or datasources improve. National accounts data in <strong>World</strong><strong>Development</strong> <strong>Indicators</strong> are also revised when datasources change. The following notes, while not comprehensive,provide information on revisions from previousdata. • Afghanistan. National accounts data aresourced from the IMF and differ from the Central StatisticsOrganization numbers due to exclusion of theopium economy. • Angola. Based on IMF data, nationalaccounts data have been revised for 2000 onward;the new base year is 2002. • Australia. Value addedseries data are taken from the United Nations NationalAccounts Main Aggregates, and gross national incomeis computed using Australian Bureau of Statisticsdata. • Bhutan. Data were updated recently using thegovernment of Bhutan macroeconomic framework.• China. National accounts historical data for expenditureseries in constant prices have been revised basedon National Statistics Bureau data not previously available.• Democratic Republic of Congo. Based on IMFdata, national accounts data have been revised for2000 onward; the new base year is 2000. • Republicof Congo. Based on IMF data, national accounts dataEconomies with exceptional reporting periodsEconomyFiscalyear endReporting periodfor nationalaccounts dataAfghanistan Mar. 20 FYAustralia Jun. 30 FYBangladesh Jun. 30 FYBotswana Jun. 30 FYCanada Mar. 31 CYEgypt, Arab Rep. Jun. 30 FYEthiopia Jul. 7 FYGambia, The Jun. 30 CYHaiti Sep. 30 FYIndia Mar. 31 FYIndonesia Mar. 31 CYIran, Islamic Rep. Mar. 20 FYJapan Mar. 31 CYKenya Jun. 30 CYKuwait Jun. 30 CYLesotho Mar. 31 CYMalawi Mar. 31 CYMyanmar Mar. 31 FYNamibia Mar. 31 CYNepal Jul. 14 FYNew Zealand Mar. 31 FYPakistan Jun. 30 FYPuerto Rico Jun. 30 FYSierra Leone Jun. 30 CYSingapore Mar. 31 CYSouth Africa Mar. 31 CYSwaziland Mar. 31 CYSweden Jun. 30 CYThailand Sep. 30 CYUganda Jun. 30 FYUnited States Sep. 30 CYZimbabwe Jun. 30 CYhave been revised for 1990 onward; the new base yearis 1990. • Croatia. Based on official government statistics,the new base year for constant price series is2005. • Eritrea. Based on IMF data, national accountsdata have been revised for 2000 onward; the new baseyear is 2000. • The Gambia. Based on official governmentstatistics, national accounts data have beenrevised for 2004 onward; the new base year is 2004.• Guinea. Based on IMF data, national accounts datahave been revised for 2000 onward; the new baseyear is 2003. • Hong Kong SAR, China. Agriculturevalue added includes mining and quarrying. • India.The India Central Statistical Office revised historicaldata series both current and constant going back to1960 with 2004–05 as the base. • Jamaica. Basedon official government statistics, national accountsdata have been revised for 2002 onward; the newbase year is 2007. • Kiribati. Based on data from theAsian <strong>Development</strong> Bank, national accounts data havebeen revised for 2005 onward. • Liberia. Based on IMFdata, national accounts data have been revised for2000 onward; the new base year is 2000. • Malawi.Based on IMF data, national accounts data have beenrevised for 2003 onward; the new base year is 2007.• Malaysia. Based on data from the National StatisticsOffice, national accounts data in current prices havebeen revised for 2005 onward. • Nicaragua. Based onofficial government statistics, national accounts datahave been revised for 1994 onward; the new baseyear is 2006. • Palau. Based on IMF data, nationalaccounts data have been revised for 2007 onward.• Rwanda. Based on official government statistics,national accounts data have been revised for 1999onward; the new base year is 2006. • Samoa. Basedon IMF data, national accounts data have been revisedfor 2007 onward. • Seychelles. Based on official governmentstatistics, national accounts data have beenrevised for 1976 onward; the new base year is 2006.• Sierra Leone. Based on official government statistics,national accounts data have been revised for1990 onward; the new base year is 2006. • SyrianArab Republic. Based on data from the Central Bureauof Statistics, national accounts data have been revisedfor 2003 onward. • Togo. Based on IMF data, nationalaccounts data have been revised for 2000; the newbase year is 2000. • Tonga. Based on data from theNational Bureau of Statistics, national accounts datahave been revised; the new base year is 2010/11.• Tuvalu. Based on IMF data, national accounts datafor 2000 onward have been revised. • United ArabEmirates. Based on data from the National Bureau ofStatistics, national accounts data have been revisedfor 2001 onward; the new base year is 2007.Economy States and markets Global links Back<strong>World</strong> <strong>Development</strong> <strong>Indicators</strong> <strong>2013</strong> 117
Statistical methodsThis section describes some of the statistical proceduresused in preparing <strong>World</strong> <strong>Development</strong> <strong>Indicators</strong>.It covers the methods employed for calculatingregional and income group aggregates and for calculatinggrowth rates, and it describes the <strong>World</strong> BankAtlas method for deriving the conversion factor usedto estimate gross national income (GNI) and GNI percapita in U.S. dollars. Other statistical proceduresand calculations are described in the About the datasections following each table.Aggregation rulesAggregates based on the <strong>World</strong> Bank’s regional andincome classifications of economies appear at theend of the tables, including most of those availableonline. The 214 economies included in these classificationsare shown on the flaps on the front and backcovers of the book. Aggregates also contain data forTaiwan, China. Most tables also include the aggregatefor the euro area, which includes the member statesof the Economic and Monetary Union (EMU) of theEuropean Union that have adopted the euro as theircurrency: Austria, Belgium, Cyprus, Estonia, Finland,France, Germany, Greece, Ireland, Italy, Luxembourg,Malta, Netherlands, Portugal, Slovak Republic, Slovenia,and Spain. Other classifications, such as theEuropean Union, are documented in About the datafor the online tables in which they appear.Because of missing data, aggregates for groupsof economies should be treated as approximationsof unknown totals or average values. The aggregationrules are intended to yield estimates for a consistentset of economies from one period to the next and forall indicators. Small differences between sums of subgroupaggregates and overall totals and averages mayoccur because of the approximations used. In addition,compilation errors and data reporting practicesmay cause discrepancies in theoretically identicalaggregates such as world exports and world imports.Five methods of aggregation are used in <strong>World</strong><strong>Development</strong> <strong>Indicators</strong>:• For group and world totals denoted in the tables bya t, missing data are imputed based on the relationshipof the sum of available data to the total inthe year of the previous estimate. The imputationprocess works forward and backward from 2000.Missing values in 2000 are imputed using one ofseveral proxy variables for which complete dataare available in that year. The imputed value iscalculated so that it (or its proxy) bears the samerelationship to the total of available data. Imputedvalues are usually not calculated if missing dataaccount for more than a third of the total in thebenchmark year. The variables used as proxies areGNI in U.S. dollars; total population; exports andimports of goods and services in U.S. dollars; andvalue added in agriculture, industry, manufacturing,and services in U.S. dollars.• Aggregates marked by an sare sums of availabledata. Missing values are not imputed. Sums arenot computed if more than a third of the observationsin the series or a proxy for the series aremissing in a given year.• Aggregates of ratios are denoted by a wwhen calculatedas weighted averages of the ratios (usingthe value of the denominator or, in some cases,another indicator as a weight) and denoted by au when calculated as unweighted averages. Theaggregate ratios are based on available data. Missingvalues are assumed to have the same averagevalue as the available data. No aggregate is calculatedif missing data account for more than a thirdof the value of weights in the benchmark year. Ina few cases the aggregate ratio may be computedas the ratio of group totals after imputing valuesfor missing data according to the above rules forcomputing totals.• Aggregate growth rates are denoted by a wwhencalculated as a weighted average of growth rates.In a few cases growth rates may be computed fromtime series of group totals. Growth rates are notcalculated if more than half the observations in aperiod are missing. For further discussion of methodsof computing growth rates see below.• Aggregates denoted by an mare medians of thevalues shown in the table. No value is shown ifmore than half the observations for countries witha population of more than 1 million are missing.118 <strong>World</strong> <strong>Development</strong> <strong>Indicators</strong> <strong>2013</strong> Front ? User guide <strong>World</strong> view People Environment
Exceptions to the rules may occur. Depending onthe judgment of <strong>World</strong> Bank analysts, the aggregatesmay be based on as little as 50 percent of the availabledata. In other cases, where missing or excludedvalues are judged to be small or irrelevant, aggregatesare based only on the data shown in the tables.Growth ratesGrowth rates are calculated as annual averages andrepresented as percentages. Except where noted,growth rates of values are computed from constantprice series. Three principal methods are used to calculategrowth rates: least squares, exponential endpoint,and geometric endpoint. Rates of change fromone period to the next are calculated as proportionalchanges from the earlier period.Least squares growth rate. Least squares growthrates are used wherever there is a sufficiently longtime series to permit a reliable calculation. No growthrate is calculated if more than half the observations ina period are missing. The least squares growth rate, r,is estimated by fitting a linear regression trend line tothe logarithmic annual values of the variable in the relevantperiod. The regression equation takes the formln X t= a + btwhich is the logarithmic transformation of the compoundgrowth equation,X t= X o(1 + r ) t .In this equation X is the variable, t is time, and a = ln X oand b = ln (1 + r) are parameters to be estimated. Ifb* is the least squares estimate of b, then the averageannual growth rate, r, is obtained as [exp(b*) – 1]and is multiplied by 100 for expression as a percentage.The calculated growth rate is an average rate thatis representative of the available observations overthe entire period. It does not necessarily match theactual growth rate between any two periods.Exponential growth rate. The growth rate betweentwo points in time for certain demographic indicators,notably labor force and population, is calculated fromthe equationr = ln(p n/p 0)/nwhere p nand p 0are the last and first observationsin the period, n is the number of years in the period,and ln is the natural logarithm operator. This growthrate is based on a model of continuous, exponentialgrowth between two points in time. It does not take intoaccount the intermediate values of the series. Nor doesit correspond to the annual rate of change measuredat a one-year interval, which is given by (p n– p n–1)/p n–1.Geometric growth rate. The geometric growthrate is applicable to compound growth over discreteperiods, such as the payment and reinvestment ofinterest or dividends. Although continuous growth, asmodeled by the exponential growth rate, may be morerealistic, most economic phenomena are measuredonly at intervals, in which case the compound growthmodel is appropriate. The average growth rate over nperiods is calculated asr = exp[ln(p n/p 0)/n] – 1.<strong>World</strong> Bank Atlas methodIn calculating GNI and GNI per capita in U.S. dollarsfor certain operational purposes, the <strong>World</strong> Bank usesthe Atlas conversion factor. The purpose of the Atlasconversion factor is to reduce the impact of exchangerate fluctuations in the cross-country comparison ofnational incomes.The Atlas conversion factor for any year is the averageof a country’s exchange rate (or alternative conversionfactor) for that year and its exchange rates forthe two preceding years, adjusted for the differencebetween the rate of inflation in the country and thatin Japan, the United Kingdom, the United States, andthe euro area. A country’s inflation rate is measuredby the change in its GDP deflator.The inflation rate for Japan, the United Kingdom,the United States, and the euro area, representingEconomy States and markets Global links Back<strong>World</strong> <strong>Development</strong> <strong>Indicators</strong> <strong>2013</strong> 119
Statistical methodsinternational inflation, is measured by the change inthe “SDR deflator.” (Special drawing rights, or SDRs,are the International Monetary Fund’s unit of account.)The SDR deflator is calculated as a weighted averageof these countries’ GDP deflators in SDR terms, theweights being the amount of each country’s currencyin one SDR unit. Weights vary over time because boththe composition of the SDR and the relative exchangerates for each currency change. The SDR deflator iscalculated in SDR terms first and then converted toU.S. dollars using the SDR to dollar Atlas conversionfactor. The Atlas conversion factor is then applied toa country’s GNI. The resulting GNI in U.S. dollars isdivided by the midyear population to derive GNI percapita.When official exchange rates are deemed tobe unreliable or unrepresentative of the effectiveexchange rate during a period, an alternative estimateof the exchange rate is used in the Atlas formula(see below).The following formulas describe the calculation ofthe Atlas conversion factor for year t:and the calculation of GNI per capita in U.S. dollarsfor year t:Y t$= (Y t/N t)/e t*where e t*is the Atlas conversion factor (national currencyto the U.S. dollar) for year t, e tis the averageannual exchange rate (national currency to the U.S.dollar) for year t, p tis the GDP deflator for year t, p tS$is the SDR deflator in U.S. dollar terms for year t, Y t$is the Atlas GNI per capita in U.S. dollars in year t, Y tis current GNI (local currency) for year t, and N tis themidyear population for year t.Alternative conversion factorsThe <strong>World</strong> Bank systematically assesses the appropriatenessof official exchange rates as conversionfactors. An alternative conversion factor is used whenthe official exchange rate is judged to diverge by anexceptionally large margin from the rate effectivelyapplied to domestic transactions of foreign currenciesand traded products. This applies to only a smallnumber of countries, as shown in Primary data documentation.Alternative conversion factors are used inthe Atlas methodology and elsewhere in <strong>World</strong> <strong>Development</strong><strong>Indicators</strong> as single-year conversion factors.120 <strong>World</strong> <strong>Development</strong> <strong>Indicators</strong> <strong>2013</strong> Front ? User guide <strong>World</strong> view People Environment
Credits1. <strong>World</strong> viewSection 1 was prepared by a team led by Eric Swanson.Eric Swanson wrote the introduction with inputfrom Neil Fantom, Juan Feng, Masako Hiraga, WendyHuang, Hiroko Maeda, Johan Mistiaen, VanessaMoreira, Esther Naikal, William Prince, Evis Rucaj,Rubena Sakaj, and Emi Suzuki. Bala Bhaskar NaiduKalimili coordinated tables 1.1 and 1.6. MasakoHiraga, Hiroko Maeda, Johan Mistiaen, VanessaMoreira, and Emi Suzuki prepared tables 1.2 and1.5. Mahyar Eshragh-Tabary, Masako Hiraga, BuyantErdene Khaltarkhuu, Hiroko Maeda, Vanessa Moreira,and Emi Suzuki prepared table 1.3. Wendy Huangprepared table 1.4 with input from Azita Amjadi. SigneZeikate of the <strong>World</strong> Bank’s Economic Policy and DebtDepartment provided the estimates of debt relief forthe Heavily Indebted Poor Countries Debt Initiativeand Multilateral Debt Relief Initiative.2. PeopleSection 2 was prepared by Juan Feng, Masako Hiraga,Hiroko Maeda, Johan Mistiaen, Vanessa Moreira, EmiSuzuki, and Eric Swanson in partnership with the<strong>World</strong> Bank’s Human <strong>Development</strong> Network and the<strong>Development</strong> Research Group in the <strong>Development</strong>Economics Vice Presidency. Emi Suzuki prepared thedemographic estimates and projections. The povertyestimates at national poverty lines were compiledby the Global Poverty Working Group, a team of povertyexperts from the Poverty Reduction and EqualityNetwork, the <strong>Development</strong> Research Group, and the<strong>Development</strong> Data Group. Shaohua Chen and PremSangraula of the <strong>World</strong> Bank’s <strong>Development</strong> ResearchGroup prepared the poverty estimates at internationalpoverty lines. Lorenzo Guarcello and Furio Rosati ofthe Understanding Children’s Work project preparedthe data on children at work. Other contributionswere provided by Samuel Mills (health); MaddalenaHonorati, Montserrat Pallares-Miralles, and ClaudiaRodríguez (vulnerability and security); Theodoor Sparreboomand Alan Wittrup of the International LabourOrganization (labor force); Amélie Gagnon, Said OuldVoffal, and Weixin Lu of the United Nations Educational,Scientific and Cultural Organization Institute forStatistics (education and literacy); the <strong>World</strong> HealthOrganization Chandika Indikadahena (health expenditure),Monika Bloessner and Mercedes de Onis (malnutritionand overweight), Teena Kunjumen (healthworkers), Jessica Ho (hospital beds), Rifat Hossain(water and sanitation), Luz Maria de Regil (anemia),Hazim Timimi (tuberculosis), and Lori Marie Newman(syphilis); Leonor Guariguata of the International DiabetesFederation (diabetes); Mary Mahy of the JointUnited Nations Programme on HIV/AIDS (HIV/AIDS);and Colleen Murray of the United Nations Children’sFund (health). Eric Swanson provided comments andsuggestions on the introduction and at all stages ofproduction.3. EnvironmentSection 3 was prepared by Mahyar Eshragh-Tabaryin partnership with the Agriculture and EnvironmentalServices Department of the Sustainable <strong>Development</strong>Network Vice Presidency of the <strong>World</strong> Bank.Mahyar Eshragh-Tabary wrote the introduction withsuggestions from Eric Swanson. Other contributorsinclude Esther G. Naikal and Karen Treanton of theInternational Energy Agency, Gerhard Metchies andArmin Wagner of German International Cooperation,Craig Hilton-Taylor and Caroline Pollock of the InternationalUnion for Conservation of Nature, and CristianGonzalez of the International Road Federation. The<strong>World</strong> Bank’s Agriculture and Environmental ServicesDepartment devoted generous staff resources.4. EconomySection 4 was prepared by Bala Bhaskar Naidu Kalimiliin close collaboration with the Sustainable <strong>Development</strong>and Economic Data Team of the <strong>World</strong> Bank’s<strong>Development</strong> Data Group and with suggestions fromLiu Cui and William Prince. Bala Bhaskar Naidu Kalimiliwrote the introduction with suggestions from EricSwanson. The highlights section was prepared by BalaBhaskar Naidu Kalimili, Maurice Nsabimana, and OlgaVictorovna Vybornaia. The national accounts data forlow- and middle-income economies were gathered bythe <strong>World</strong> Bank’s regional staff through the annualUnified Survey. Federico M. Escaler, Mahyar Eshragh-Economy States and markets Global links Back<strong>World</strong> <strong>Development</strong> <strong>Indicators</strong> <strong>2013</strong> 121
CreditsTabary, Bala Bhaskar Naidu Kalimili, Buyant ErdeneKhaltarkhuu, Maurice Nsabimana, and Olga VictorovnaVybornaia updated, estimated, and validated thedatabases for national accounts. Esther G. Naikalprepared adjusted savings and adjusted income data.Azita Amjadi contributed trade data from the <strong>World</strong>Integrated Trade Solution. The team is grateful toEurostat, the International Monetary Fund, the Organisationfor Economic Co-operation and <strong>Development</strong>,the United Nations Industrial <strong>Development</strong> Organization,and the <strong>World</strong> Trade Organization for access totheir databases.5. States and marketsSection 5 was prepared by Federico Escaler andBuyant Erdene Khaltarkhuu in partnership with the<strong>World</strong> Bank’s Financial and Private Sector <strong>Development</strong>Network, Poverty Reduction and EconomicManagement Network, and Sustainable <strong>Development</strong>Network; the International Finance Corporation; andexternal partners. Buyant Erdene Khaltarkhuu wrotethe introduction with input from Eric Swanson. Othercontributors include Alexander Nicholas Jett (privatizationand infrastructure projects); Leora Klapper(business registration); Federica Saliola and JoshuaWimpey (Enterprise Surveys); Carolin Geginat andFrederic Meunier (Doing Business); Alka Banerjee,Trisha Malinky, and Michael Orzano (Standard &Poor’s global stock market indexes); Gary Milanteand Kenneth Anya (fragile situations); Satish Mannan(public policies and institutions); James Hackettof the International Institute for Strategic Studies(military personnel); Sam Perlo-Freeman of the StockholmInternational Peace Research Institute (militaryexpenditures and arms transfers); Christian Gonzalezof the International Road Federation, Zubair Anwarand Narjess Teyssier of the International Civil AviationOrganization, and Marc Juhel and Hélène Stephan(transport); Vincent Valentine of the United NationsConference on Trade and <strong>Development</strong> (ports); AzitaAmjadi (high-tech exports); Vanessa Grey, EsperanzaMagpantay, and Susan Teltscher of the InternationalTelecommunication Union; Torbjörn Fredriksson andDiana Korka of the United Nations Conference onTrade and <strong>Development</strong> (information and communicationtechnology goods trade); Martin Schaaper ofthe United Nations Educational, Scientific and CulturalOrganization Institute for Statistics (researchand development, researchers, and technicians); andRyan Lamb of the <strong>World</strong> Intellectual Property Organization(patents and trademarks).6. Global linksSection 6 was prepared by Wendy Huang with inputfrom Evis Rucaj and Rubena Sukaj and in partnershipwith the Financial Data Team of the <strong>World</strong> Bank’s<strong>Development</strong> Data Group, <strong>Development</strong> ResearchGroup (trade), <strong>Development</strong> Prospects Group (commodityprices and remittances), International TradeDepartment (trade facilitation), and external partners.Wendy Huang and Evis Rucaj wrote the introduction,with substantial input from Eric Swanson.Azita Amjadi (trade and tariffs) and Rubena Sukaj(external debt and financial data) provided substantialinput on the data and tables. Other contributorsinclude Frédéric Docquier (emigration rates); FlavineCreppy and Yumiko Mochizuki of the United NationsConference on Trade and <strong>Development</strong> and MondherMimouni of the International Trade Centre (trade); CristinaSavescu (commodity prices); Jeff Reynolds andJoseph Siegel of DHL (freight costs); Yasmin Ahmadand Elena Bernaldo of the Organisation for EconomicCo-operation and <strong>Development</strong> (aid); Ibrahim Leventand Maryna Taran (external debt); Gemechu AyanaAga and Ani Rudra Silwal (remittances); and TeresaCiller of the <strong>World</strong> Tourism Organization (tourism).Ramgopal Erabelly, Shelley Fu, and William Princeprovided technical assistance.Other parts of the bookJeff Lecksell of the <strong>World</strong> Bank’s Map Design Unitcoordinated preparation of the maps on the inside covers.Alison Kwong and William Prince prepared Userguide and the lists of online tables and indicators foreach section. Eric Swanson wrote Statistical methods,with input from William Prince. Federico Escaler andLeila Rafei prepared Primary data documentation. Partnerswas prepared by Alison Kwong.122 <strong>World</strong> <strong>Development</strong> <strong>Indicators</strong> <strong>2013</strong>Front ? User guide <strong>World</strong> view People Environment
Database managementWilliam Prince coordinated management of the <strong>World</strong><strong>Development</strong> <strong>Indicators</strong> database, with assistancefrom Liu Cui and Shelley Fu in the Data Administrationand Quality Team. Operation of the database managementsystem was made possible by RamgopalErabelly in the Data and Information Systems Teamunder the leadership of Reza Farivari.Design, production, and editingAzita Amjadi and Alison Kwong coordinated all stagesof production with Communications <strong>Development</strong>Incorporated, which provided overall design direction,editing, and layout, led by Meta de Coquereaumont,Jack Harlow, Bruce Ross-Larson, and ChristopherTrott. Elaine Wilson created the cover and graphicsand typeset the book. Peter Grundy, of Peter GrundyArt & Design, and Diane Broadley, of Broadley Design,designed the report.Administrative assistance, office technology,and systems development supportElysee Kiti provided administrative assistance.Jean-Pierre Djomalieu, Gytis Kanchas, and NacerMegherbi provided information technology support.Ugendran Machakkalai, Shanmugam Natarajan,Atsushi Shimo, and Malarvizhi Veerappan providedsoftware support on the <strong>Development</strong> Data Platformapplication.Publishing and disseminationThe Office of the Publisher, under the direction ofCarlos Rossel, provided assistance throughout theproduction process. Denise Bergeron, StephenMcGroarty, Nora Ridolfi, and Janice Tuten coordinatedprinting, marketing, and distribution. Merrell Tuck-Primdahl of the <strong>Development</strong> Economics Vice President’sOffice managed the communications strategy.<strong>World</strong> <strong>Development</strong> <strong>Indicators</strong> mobile applicationsSoftware preparation and testing were managed byShelley Fu with assistance from Prashant Chaudhari,Ying Chi, Liu Cui, Ghislaine Delaine, Neil Fantom,Ramgopal Erabelly, Federico Escaler, Buyant ErdeneKhaltarkhuu, Sup Lee, Maurice Nsabimana, ParastooOloumi, Beatriz Prieto Oramas, William Prince, VirginiaRomand, Jomo Tariku, Malarvizhi Veerappan, and VeraWen. Systems development was undertaken in theData and Information Systems Team led by Reza Farivari.William Prince provided data quality assurance.Online accessCoordination of the presentation of the WDI online,through the <strong>Open</strong> Data website, the <strong>World</strong> Databankapplication, the new table browser application, andthe Application Programming Interface, was providedby Neil Fantom and Soong Sup Lee. <strong>Development</strong> andmaintenance of the website were managed by a teamled by Azita Amjadi and including Alison Kwong, GeorgeGongadze, Timothy Herzog, Jeffrey McCoy, and JomoTariku. Systems development was managed by a teamled by Reza Farivari, with project management providedby Malarvizhi Veerappan. Design, programming, andtesting were carried out by Ying Chi, Shelley Fu, SiddheshKaushik, Ugendran Machakkalai, Nacer Megherbi,Shanmugam Natarajan, Parastoo Oloumi, ManishRathore, Ashish B. Shah, Atsushi Shimo, MarynaTaran, and Jomo Tariku. Liu Cui and William Princecoordinated production and provided data qualityassurance. Multilingual translations of online applicationswere provided by a team led by Jim Rosenberg inthe <strong>World</strong> Bank’s External Affairs department.Client feedbackThe team is grateful to the many people who havetaken the time to provide feedback and suggestions,which have helped improve this year’s edition. Pleasecontact us at data@worldbank.org.Economy States and markets Global links Back<strong>World</strong> <strong>Development</strong> <strong>Indicators</strong> <strong>2013</strong> 123
ECO-AUDITEnvironmental Benefits StatementThe <strong>World</strong> Bank is committed to preservingendangered forests and naturalresources. The Office of the Publisherhas chosen to print <strong>World</strong> <strong>Development</strong><strong>Indicators</strong> <strong>2013</strong> on recycled paper with50 percent postconsumer fiber in accordancewith the recommended standards forpaper usage set by the Green Press Initiative,a nonprofit program supporting publishersin using fiber that is not sourcedfrom endangered forests. For more information,visit www.greenpressinitiative.org.Saved:• 25 trees• 11 million BritishThermal Units oftotal energy• 2,172 pounds of netgreenhouse gases• 11,779 gallons ofwaste water• 789 pounds of solidwaste
The world by regionClassified according to<strong>World</strong> Bank analyticalgroupingLow- and middle-income economiesEast Asia and PacificEurope and Central AsiaMiddle East and North AfricaSouth AsiaHigh-income economiesOECDLatin America and the CaribbeanSub-Saharan AfricaOther No dataGreenland(Den)FijiSamoaAmericanSamoa (US)TongaKiribatiFrench Polynesia (Fr)DominicanRepublicPuertoRico (US)U.S. VirginIslands (US)Aruba (Neth)Curaçao (Neth)R.B. de VenezuelaMexicoSt. Kittsand NevisSt. Vincent andthe GrenadinesUnited StatesCayman Is.(UK)Antigua and BarbudaGuadeloupe (Fr)DominicaMartinique (Fr)St. LuciaGrenadaCanadaCosta RicaTrinidadand TobagoCubaBelize JamaicaGuatemala HondurasEl Salvador NicaraguaSt. Martin (Fr)St. Maarten (Neth)PanamaEcuadorBarbadosThe BahamasHaitiColombiaPeruBermuda(UK)R.B. deVenezuelaChileTurks and Caicos Is. (UK)BoliviaGuyanaSurinameFrench Guiana (Fr)ParaguayArgentinaBrazilUruguayGermanyIcelandPolandCzech Republic UkraineSlovak RepublicAustriaSloveniaCroatiaHungaryRomaniaBosnia andHerzegovina SerbiaSanMarinoKosovo BulgariaItaly Montenegro FYRMacedoniaVaticanAlbaniaCityGreeceFaeroe NorwayIslands(Den) Sweden FinlandThe NetherlandsEstoniaIsle of Man (UK)Denmark Russian LatviaFed. LithuaniaUnitedIreland Kingdom Germany Poland BelarusChannel Islands (UK)BelgiumUkraineLuxembourgMoldovaLiechtensteinFrance ItalyRomaniaSwitzerlandAndorraBulgaria GeorgiaPortugalSpainArmeniaTurkeyMonacoGreeceCyprus SyrianGibraltar (UK)TunisiaMalta LebanonArabRep.MoroccoIsraelIraqWest Bank and Gaza JordanAlgeriaLibya Arab Rep.Westernof EgyptSaharaMauritaniaOmanCape VerdeMaliNigerChadSenegalSudan Eritrea Rep. of YemenThe GambiaBurkinaGuinea-BissauFasoDjiboutiGuineaBeninSierra Leone Côted’Ivoire Ghana Nigeria CentralEthiopiaAfrican SouthLiberiaRepublic SudanCameroonTogoSomaliaEquatorial GuineaUgandaSão Tomé and PríncipeGabon CongoKenyaRwandaDem.Rep.of BurundiSeychellesCongoTanzaniaComorosAngolaNamibiaZambiaBotswanaSouthAfricaMalawiMozambiqueZimbabweMadagascarLesothoSwazilandAzerbaijanSaudiArabiaMayotte(Fr)Islamic Rep.of IranKuwaitBahrainQatarTurkmenistanUnited ArabEmiratesKazakhstanUzbekistanRéunion (Fr)AfghanistanMauritiusKyrgyzRep.TajikistanRussian FederationPakistanIndiaMaldivesBhutanNepalSriLankaMongoliaBangladeshChinaMyanmarLaoP.D.R.ThailandVietnamCambodiaBrunei DarussalamMalaysiaSingaporeDem.People’sRep.of KoreaRep.ofKoreaPhilippinesIndonesiaJapanN. Mariana Islands (US)Timor-LesteAustraliaGuam (US)PalauFederated States of MicronesiaPapua New GuineaNewZealandNauruSolomonIslandsVanuatuNewCaledonia(Fr)Marshall IslandsKiribatiTuvaluFijiAntarcticaIBRD 39818 MARCH <strong>2013</strong>