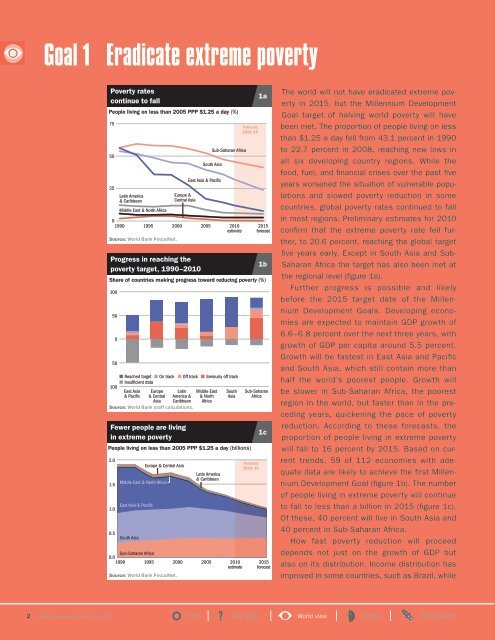
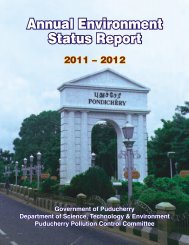
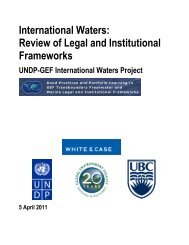
Goal 1 Eradicate extreme povertyPoverty ratescontinue to fallPeople living on less than 2005 PPP $1.25 a day (%)755025Latin America& Caribbean01990Share of countries making progress toward reducing poverty (%)10050Fewer people are livingin extreme povertyPeople living on less than 2005 PPP $1.25 a day (billions)2.01.51.00.5050100Middle East & North AfricaEast AsiaSouth Asia1995Sub-Saharan Africa0.01990 1995Europe& CentralAsiaEurope & Central AsiaMiddle East & North Africa2000Source: <strong>World</strong> Bank PovcalNet.Source: <strong>World</strong> Bank PovcalNet.Europe &Central AsiaProgress in reaching thepoverty target, 1990–2010Reached target On track Off track Seriously off trackLatinAmerica &CaribbeanSource: <strong>World</strong> Bank staff calculations.20002005Middle East& NorthAfricaLatin America& Caribbean2005Sub-Saharan AfricaSouth Asia2010estimateSouthAsia2010estimateForecast2010–15Sub-SaharanAfricaForecast2010–151a2015forecast1b1c2015forecastThe world will not have eradicated extreme povertyin 2015, but the Millennium <strong>Development</strong>Goal target of halving world poverty will havebeen met. The proportion of people living on lessthan $1.25 a day fell from 43.1 percent in 1990to 22.7 percent in 2008, reaching new lows inall six developing country regions. While thefood, fuel, and financial crises over the past fiveyears worsened the situation of vulnerable populationsand slowed poverty reduction in somecountries, global poverty rates continued to fallin most regions. Preliminary estimates for 2010confirm that the extreme poverty rate fell further,to 20.6 percent, reaching the global targetfive years early. Except in South Asia and Sub-Saharan Africa the target has also been met atthe regional level (figure 1a).Further progress is possible and likelybefore the 2015 target date of the Millennium<strong>Development</strong> Goals. Developing economiesare expected to maintain GDP growth of6.6–6.8 percent over the next three years, withgrowth of GDP per capita around 5.5 percent.Growth will be fastest in East Asia and Pacificand South Asia, which still contain more thanhalf the world’s poorest people. Growth willbe slower in Sub- Saharan Africa, the poorestregion in the world, but faster than in the precedingyears, quickening the pace of povertyreduction. According to these forecasts, theproportion of people living in extreme povertywill fall to 16 percent by 2015. Based on currenttrends, 59 of 112 economies with adequatedata are likely to achieve the first Millennium<strong>Development</strong> Goal (figure 1b). The numberof people living in extreme poverty will continueto fall to less than a billion in 2015 (figure 1c).Of these, 40 percent will live in South Asia and40 percent in Sub- Saharan Africa.How fast poverty reduction will proceeddepends not just on the growth of GDP butalso on its distribution. Income distribution hasimproved in some countries, such as Brazil, while2 <strong>World</strong> <strong>Development</strong> <strong>Indicators</strong> <strong>2013</strong> Front ? User guide <strong>World</strong> view People Environment
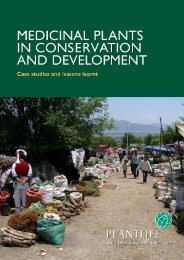
worsening in others, such as China. To speedprogress toward eliminating extreme poverty,development strategies should attempt toincrease not just the mean rate of growth butalso the share of income going to the poorestpart of the population. Sub- Saharan Africa,where average income is low and average incomeof those below the poverty line is even lower, willface great difficulties in bringing the poorest peopleto an adequate standard of living (figure 1d).Latin America and the Caribbean, where averageincome is higher, must overcome extremely inequitableincome distributions.Two Millennium <strong>Development</strong> Goal indicatorsaddress hunger and malnutrition. Child malnutrition,measured by comparing a child’s weightwith that of other children of similar age, reflectsa shortfall in food energy, poor feeding practicesby mothers, and lack of essential nutrientsin the diet. Malnutrition in children oftenbegins at birth, when poorly nourished mothersgive birth to underweight babies. Malnourishedchildren develop more slowly, enter school later,and perform less well. Malnutrition rates havedropped substantially since 1990, from 28 percentof children under age 5 in developing countriesto 17 percent in 2011. Every developingregion except Sub- Saharan Africa is on trackto cut child malnutrition rates in half by 2015(figure 1e). However, collecting data on malnutritionthrough surveys with direct measurement ofchildren’s weight and height is costly, and manycountries lack the information to calculate timetrends.Undernourishment, a shortage of food energyto sustain normal daily activities, is affected bychanges in the average amount of food availableand its distribution. After steady declines in mostregions from 1991 to 2005, further improvementsin undernourishment have stalled, leaving13 percent of the world’s population, almost900 million people, without adequate daily foodintake (figure 1f).Poorerthan poorAverage daily income of people living on less than 2005 PPP$1.25 a day, 2008 (2005 PPP $)1.251.000.750.500.250.00604020Latin America & Caribbean01990 1995And fewer people lackingsufficient food energyUndernourishment prevalence (% of population)40302010Latin America& Caribbean01991East Asia& PacificMalnutrition prevalence, weight for age (% of children under age 5)South AsiaSub-Saharan AfricaEast Asia & PacificEurope& CentralAsiaSource: <strong>World</strong> Bank PovcalNet.Fewer malnourishedchildrenMiddle East & North AfricaMiddle East & North Africa1996LatinAmerica &Caribbean20002001Middle East& NorthAfricaSource: <strong>World</strong> <strong>Development</strong> <strong>Indicators</strong> database.2005SouthAsiaEurope & Central AsiaSouth AsiaEast Asia & Pacific2006Sub-Saharan Africa1fEurope & Central AsiaSource: Food and Agriculture Organization and <strong>World</strong> <strong>Development</strong><strong>Indicators</strong> database.1dSub-SaharanAfrica1e20112011Economy States and markets Global links Back<strong>World</strong> <strong>Development</strong> <strong>Indicators</strong> <strong>2013</strong> 3
- Page 3: The world by incomeLow ($1,025 or l
- Page 6 and 7: © 2013 International Bank for Reco
- Page 8 and 9: AcknowledgmentsThis book was prepar
- Page 10 and 11: PartnersDefining, gathering, and di
- Page 12 and 13: PartnersNational ScienceFoundationU
- Page 14 and 15: PartnersPrivate and nongovernmental
- Page 16 and 17: User guide to tablesWorld Developme
- Page 18 and 19: User guide to WDI online tablesStat
- Page 20 and 21: User guide to DataFinderDataFinder
- Page 22 and 23: WORLDVIEW?xviii World Development I
- Page 26 and 27: Goal 2 Achieve universal primary ed
- Page 28 and 29: Goal 3 Promote gender equality and
- Page 30 and 31: Goal 4 Reduce child mortalityUnder-
- Page 32 and 33: Goal 5 Improve maternal healthMater
- Page 34 and 35: Goal 6 Combat HIV/AIDS, malaria, an
- Page 36 and 37: Goal 7 Ensure environmental sustain
- Page 38 and 39: Goal 8 Develop a global partnership
- Page 40 and 41: Millennium Development GoalsGoals a
- Page 42 and 43: 1 World viewPopulationSurfaceareaPo
- Page 44 and 45: 1 World viewPopulationSurfaceareaPo
- Page 46 and 47: 1 World viewPopulationSurfaceareaPo
- Page 48 and 49: 1 World viewPPP rates are calculate
- Page 50 and 51: Poverty ratesInternational povertyl
- Page 52 and 53: Poverty ratesInternational povertyl
- Page 54 and 55: Poverty ratesAbout the dataThe Worl
- Page 56 and 57: PEOPLE34 World Development Indicato
- Page 58 and 59: HighlightsEast Asia & Pacific: Narr
- Page 60 and 61: 2 PeoplePrevalenceof childmalnutrit
- Page 62 and 63: 2 PeoplePrevalenceof childmalnutrit
- Page 64 and 65: 2 PeoplePrevalenceof childmalnutrit
- Page 66 and 67: 2 Peopleregistration systems or, in
- Page 68 and 69: 2 PeopleDefinitions• Prevalence o
- Page 70 and 71: 2 PeopleShare of consumption or inc
- Page 72 and 73: ENVIRONMENT50 World Development Ind
- Page 74 and 75:
HighlightsEast Asia & Pacific: More
- Page 76 and 77:
3 EnvironmentDeforestation aaverage
- Page 78 and 79:
3 EnvironmentDeforestation aaverage
- Page 80 and 81:
3 EnvironmentDeforestation aaverage
- Page 82 and 83:
3 Environmentpollution, alone or wi
- Page 84 and 85:
3 EnvironmentOnline tables and indi
- Page 86 and 87:
ECONOMY64 World Development Indicat
- Page 88 and 89:
HighlightsEast Asia & Pacific: Serv
- Page 90 and 91:
4 EconomyGross domestic productGros
- Page 92 and 93:
4 EconomyGross domestic productGros
- Page 94 and 95:
4 EconomyGross domestic productGros
- Page 96 and 97:
4 Economysame extent as the foreign
- Page 98 and 99:
4 EconomyOnline tables and indicato
- Page 100 and 101:
STATES ANDMARKETS78 World Developme
- Page 102 and 103:
HighlightsEast Asia & Pacific: Pate
- Page 104 and 105:
5 States and marketsBusinessentryde
- Page 106 and 107:
5 States and marketsBusinessentryde
- Page 108 and 109:
5 States and marketsBusinessentryde
- Page 110 and 111:
5 States and marketsunavailable, fr
- Page 112 and 113:
5 States and marketsTo access the W
- Page 114 and 115:
GLOBALLINKS92 World Development Ind
- Page 116 and 117:
HighlightsEast Asia & Pacific: Equi
- Page 118 and 119:
6 Global linksMerchandisetradeNet b
- Page 120 and 121:
6 Global linksMerchandisetradeNet b
- Page 122 and 123:
6 Global linksMerchandisetradeNet b
- Page 124 and 125:
6 Global linkslabor, entrepreneuria
- Page 126 and 127:
6 Global linksOnline tables and ind
- Page 128 and 129:
106 World Development Indicators 20
- Page 130 and 131:
Primary data documentationCurrencyN
- Page 132 and 133:
Primary data documentationCurrencyN
- Page 134 and 135:
Primary data documentationCurrencyN
- Page 136 and 137:
Primary data documentationCurrencyN
- Page 138 and 139:
Primary data documentation notes•
- Page 140 and 141:
Statistical methodsThis section des
- Page 142 and 143:
Statistical methodsinternational in
- Page 144 and 145:
CreditsTabary, Bala Bhaskar Naidu K
- Page 148:
ECO-AUDITEnvironmental Benefits Sta