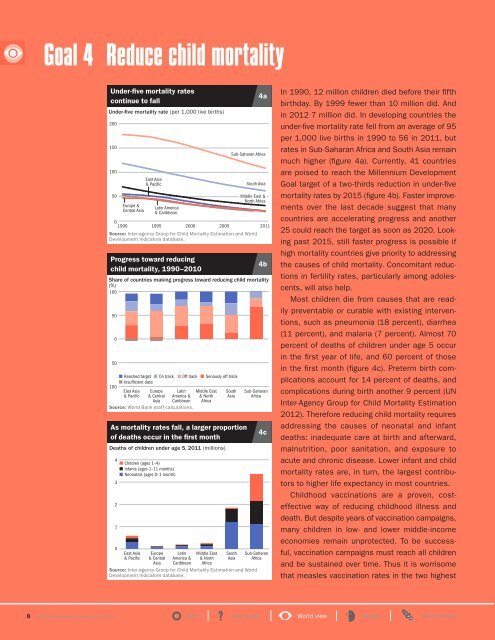
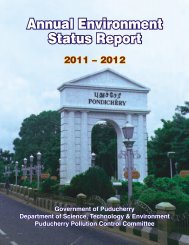
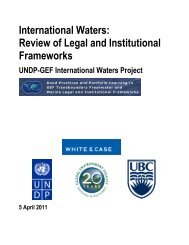
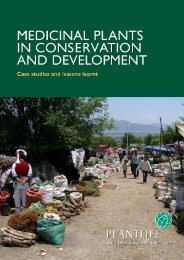
Goal 4 Reduce child mortalityUnder-five mortality ratescontinue to fallUnder-five mortality rate (per 1,000 live births)20015010050Progress toward reducingchild mortality, 1990–2010Share of countries making progress toward reducing child mortality(%)10050050100Reached target On track Off track Seriously off trackInsufficient dataEast Asia& PacificEurope& CentralAsiaLatinAmerica &CaribbeanSource: <strong>World</strong> Bank staff calculations.43210Europe &Central AsiaEast Asia& PacificEast Asia& PacificLatin America& Caribbean01990 1995 2000 20052011Source: Inter-agency Group for Child Mortality Estimation and <strong>World</strong><strong>Development</strong> <strong>Indicators</strong> database.Europe& CentralAsiaLatinAmerica &CaribbeanMiddle East& NorthAfricaDeaths of children under age 5, 2011 (millions)Children (ages 1–4)Infants (ages 1–11 months)Neonatals (ages 0–1 month)Middle East& NorthAfricaSouthAsiaAs mortality rates fall, a larger proportionof deaths occur in the first monthSub-Saharan AfricaSouthAsiaSouth AsiaMiddle East &North Africa4bSub-SaharanAfrica4cSub-SaharanAfricaSource: Inter-agency Group for Child Mortality Estimation and <strong>World</strong><strong>Development</strong> <strong>Indicators</strong> database.4aIn 1990, 12 million children died before their fifthbirthday. By 1999 fewer than 10 million did. Andin 2012 7 million did. In developing countries theunder-five mortality rate fell from an average of 95per 1,000 live births in 1990 to 56 in 2011, butrates in Sub- Saharan Africa and South Asia remainmuch higher (figure 4a). Currently, 41 countriesare poised to reach the Millennium <strong>Development</strong>Goal target of a two-thirds reduction in under-fivemortality rates by 2015 (figure 4b). Faster improvementsover the last decade suggest that manycountries are accelerating progress and another25 could reach the target as soon as 2020. Lookingpast 2015, still faster progress is possible ifhigh mortality countries give priority to addressingthe causes of child mortality. Concomitant reductionsin fertility rates, particularly among adolescents,will also help.Most children die from causes that are readilypreventable or curable with existing interventions,such as pneumonia (18 percent), diarrhea(11 percent), and malaria (7 percent). Almost 70percent of deaths of children under age 5 occurin the first year of life, and 60 percent of thosein the first month (figure 4c). Preterm birth complicationsaccount for 14 percent of deaths, andcomplications during birth another 9 percent (UNInter-Agency Group for Child Mortality Estimation2012). Therefore reducing child mortality requiresaddressing the causes of neonatal and infantdeaths: inadequate care at birth and afterward,malnutrition, poor sanitation, and exposure toacute and chronic disease. Lower infant and childmortality rates are, in turn, the largest contributorsto higher life expectancy in most countries.Childhood vaccinations are a proven, costeffectiveway of reducing childhood illness anddeath. But despite years of vaccination campaigns,many children in low- and lower middle-incomeeconomies remain unprotected. To be successful,vaccination campaigns must reach all childrenand be sustained over time. Thus it is worrisomethat measles vaccination rates in the two highest8 <strong>World</strong> <strong>Development</strong> <strong>Indicators</strong> <strong>2013</strong> Front ? User guide <strong>World</strong> view People Environment
mortality regions, South Asia and Sub- SaharanAfrica, have stagnated in the last three years, atless than 80 percent coverage (figure 4d).Twenty countries in the developing worldaccounted for 4.5 million deaths among childrenunder age 5 in 2011, or 65 percent of all suchdeaths worldwide (figure 4e). These countries aremostly large, often with high birth rates, but manyhave substantially reduced mortality rates overthe past two decades. Of the 20, 11 have reachedor are likely to achieve a two-thirds reduction intheir under-five mortality rate by 2015: Bangladesh,Brazil, China, the Arab Republic of Egypt,Ethiopia, Indonesia, Madagascar, Malawi, Mexico,Niger, and Turkey. Had the mortality rates of 1990prevailed in 2011, these 11 countries would haveexperienced 2 million more deaths. The remainingnine, where progress has been slower, have neverthelessaverted 3 million deaths. If India wereon track to reach the target, another 440,000deaths would have been averted.The data used to monitor child mortality are producedby the Inter-agency Group for Child MortalityEstimation (IGME), which evaluates data fromexisting sources and then fits a statistical modelto data points that are judged to be reliable. Themodel produces a trend line for under-five mortalityrates in each country. Infant mortality and neonatalmortality rates are derived from under-five mortalityestimates. The data come from householdsurveys and, where available, vital registration systems.But surveys are slow and costly. While theyremain important tools for investigating certaincomplex, micro-level problems, vital registrationsystems are usually better sources of timely statistics.Recent IGME estimates of under-five mortalityinclude new data from vital registration systemsfor about 70 countries. But many countries lackcomplete reporting of vital events, and even thosethat do often misreport cause of death. Vital registrationsupplemented by surveys and censusesoffers the best approach for improving knowledgeof morbidity and mortality in all age groups.Measles immunizationrates are stagnatingChildren ages 12–23 months immunized against measles (%)10075502501990East Asia& PacificLatin America& CaribbeanFive million deathsaverted in 20 countriesDeaths of children under age 5, 2011 (millions)At 2011 mortality rate Averted based on 1990 mortality rateIndiaNigeriaChinaPakistanEthiopiaBangladeshIndonesiaTanzaniaAfghanistanUgandaNigerMozambiqueAngolaBrazilEgypt, Arab Rep.MalawiPhilippinesMadagascarMexicoTurkeyEurope & Central Asia1995South Asia20004e0 1 2 3 4Source: <strong>World</strong> Bank staff calculations.Middle East & North Africa2005Sub-Saharan AfricaSource: <strong>World</strong> Health Organization, United Nations Children’s Fund, and<strong>World</strong> <strong>Development</strong> <strong>Indicators</strong> database.4d2011Economy States and markets Global links Back<strong>World</strong> <strong>Development</strong> <strong>Indicators</strong> <strong>2013</strong> 9
- Page 3: The world by incomeLow ($1,025 or l
- Page 6 and 7: © 2013 International Bank for Reco
- Page 8 and 9: AcknowledgmentsThis book was prepar
- Page 10 and 11: PartnersDefining, gathering, and di
- Page 12 and 13: PartnersNational ScienceFoundationU
- Page 14 and 15: PartnersPrivate and nongovernmental
- Page 16 and 17: User guide to tablesWorld Developme
- Page 18 and 19: User guide to WDI online tablesStat
- Page 20 and 21: User guide to DataFinderDataFinder
- Page 22 and 23: WORLDVIEW?xviii World Development I
- Page 24 and 25: Goal 1 Eradicate extreme povertyPov
- Page 26 and 27: Goal 2 Achieve universal primary ed
- Page 28 and 29: Goal 3 Promote gender equality and
- Page 32 and 33: Goal 5 Improve maternal healthMater
- Page 34 and 35: Goal 6 Combat HIV/AIDS, malaria, an
- Page 36 and 37: Goal 7 Ensure environmental sustain
- Page 38 and 39: Goal 8 Develop a global partnership
- Page 40 and 41: Millennium Development GoalsGoals a
- Page 42 and 43: 1 World viewPopulationSurfaceareaPo
- Page 44 and 45: 1 World viewPopulationSurfaceareaPo
- Page 46 and 47: 1 World viewPopulationSurfaceareaPo
- Page 48 and 49: 1 World viewPPP rates are calculate
- Page 50 and 51: Poverty ratesInternational povertyl
- Page 52 and 53: Poverty ratesInternational povertyl
- Page 54 and 55: Poverty ratesAbout the dataThe Worl
- Page 56 and 57: PEOPLE34 World Development Indicato
- Page 58 and 59: HighlightsEast Asia & Pacific: Narr
- Page 60 and 61: 2 PeoplePrevalenceof childmalnutrit
- Page 62 and 63: 2 PeoplePrevalenceof childmalnutrit
- Page 64 and 65: 2 PeoplePrevalenceof childmalnutrit
- Page 66 and 67: 2 Peopleregistration systems or, in
- Page 68 and 69: 2 PeopleDefinitions• Prevalence o
- Page 70 and 71: 2 PeopleShare of consumption or inc
- Page 72 and 73: ENVIRONMENT50 World Development Ind
- Page 74 and 75: HighlightsEast Asia & Pacific: More
- Page 76 and 77: 3 EnvironmentDeforestation aaverage
- Page 78 and 79: 3 EnvironmentDeforestation aaverage
- Page 80 and 81:
3 EnvironmentDeforestation aaverage
- Page 82 and 83:
3 Environmentpollution, alone or wi
- Page 84 and 85:
3 EnvironmentOnline tables and indi
- Page 86 and 87:
ECONOMY64 World Development Indicat
- Page 88 and 89:
HighlightsEast Asia & Pacific: Serv
- Page 90 and 91:
4 EconomyGross domestic productGros
- Page 92 and 93:
4 EconomyGross domestic productGros
- Page 94 and 95:
4 EconomyGross domestic productGros
- Page 96 and 97:
4 Economysame extent as the foreign
- Page 98 and 99:
4 EconomyOnline tables and indicato
- Page 100 and 101:
STATES ANDMARKETS78 World Developme
- Page 102 and 103:
HighlightsEast Asia & Pacific: Pate
- Page 104 and 105:
5 States and marketsBusinessentryde
- Page 106 and 107:
5 States and marketsBusinessentryde
- Page 108 and 109:
5 States and marketsBusinessentryde
- Page 110 and 111:
5 States and marketsunavailable, fr
- Page 112 and 113:
5 States and marketsTo access the W
- Page 114 and 115:
GLOBALLINKS92 World Development Ind
- Page 116 and 117:
HighlightsEast Asia & Pacific: Equi
- Page 118 and 119:
6 Global linksMerchandisetradeNet b
- Page 120 and 121:
6 Global linksMerchandisetradeNet b
- Page 122 and 123:
6 Global linksMerchandisetradeNet b
- Page 124 and 125:
6 Global linkslabor, entrepreneuria
- Page 126 and 127:
6 Global linksOnline tables and ind
- Page 128 and 129:
106 World Development Indicators 20
- Page 130 and 131:
Primary data documentationCurrencyN
- Page 132 and 133:
Primary data documentationCurrencyN
- Page 134 and 135:
Primary data documentationCurrencyN
- Page 136 and 137:
Primary data documentationCurrencyN
- Page 138 and 139:
Primary data documentation notes•
- Page 140 and 141:
Statistical methodsThis section des
- Page 142 and 143:
Statistical methodsinternational in
- Page 144 and 145:
CreditsTabary, Bala Bhaskar Naidu K
- Page 148:
ECO-AUDITEnvironmental Benefits Sta