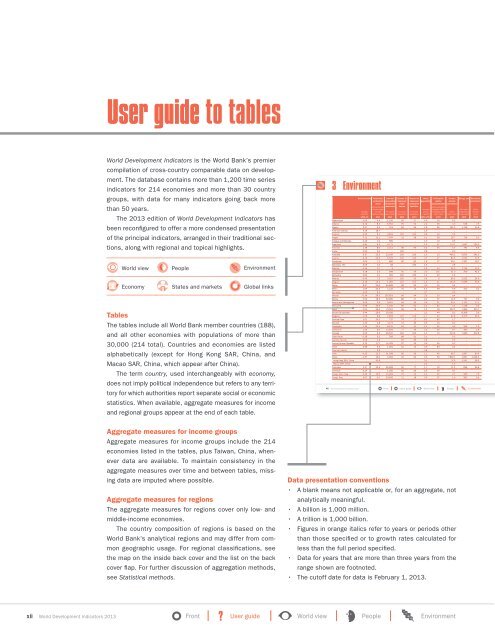
User guide to tables<strong>World</strong> <strong>Development</strong> <strong>Indicators</strong> is the <strong>World</strong> Bank’s premiercompilation of cross-country comparable data on development.The database contains more than 1,200 time seriesindicators for 214 economies and more than 30 countrygroups, with data for many indicators going back morethan 50 years.The <strong>2013</strong> edition of <strong>World</strong> <strong>Development</strong> <strong>Indicators</strong> hasbeen reconfigured to offer a more condensed presentationof the principal indicators, arranged in their traditional sections,along with regional and topical highlights.3 EnvironmentDeforestation Nationally Internal Access to Access to Urban Particulate Carbon Energy use Electricityprotected renewable improved improved population matter dioxideproductionareas freshwater water sanitationconcentration emissionsresources b source facilitiesTerrestrial andurban-populationweightedmarine areasaveragePM10Per capita billionaverage % of total Per capita % of total % of total annual micrograms per million kilograms of kilowattannual % territorial area cubic meters population population % growth cubic meter metric tons oil equivalent hours2000–10 2011 2011 2010 2010 1990–2011 2010 2009 2010 20100.00 0.4 1,335 50 37 4.0 30 6.3 .. Afghanistan ..Albania –0.10 8.4 8,364 95 94 2.4 38 3.0 648 7.6Algeria 0.57 6.2 313 83 95 2.6 69 121.3 1,138 45.6American Samoa 0.19 16.7 .. .. .. 1.9 .. .. .. ..Andorra 0.00 6.1 3,663 100 100 0.9 18 0.5 .. ..Angola 0.21 12.1 7,544 51 58 4.1 58 26.7 716 5.3Antigua and Barbuda 0.20 1.0 580 .. .. 1.0 13 0.5 .. ..Argentina 0.81 5.3 6,771 .. .. 1.0 57 174.7 1,847 125.3Armenia 1.48 8.0 2,212 98 90 0.3 45 4.5 791 6.5Aruba 0.00 0.0 .. 100 .. 0.8 .. 2.3 .. ..Australia 0.37 12.5 22,039 100 100 1.3 13 400.2 5,653 241.5Austria –0.13 22.9 6,529 100 100 0.7 27 62.3 4,034 67.9<strong>World</strong> view People EnvironmentAzerbaijan 0.00 7.1 885 80 82 1.8 27 49.1 1,307 18.7Bahamas, The 0.00 1.0 58 .. 100 1.5 .. 2.6 .. ..Bahrain –3.55 0.7 3 .. .. 4.9 44 24.2 7,754 13.2Bangladesh 0.18 1.6 698 81 56 3.0 115 51.0 209 42.3Barbados 0.00 0.1 292 100 100 1.4 35 1.6 .. ..Belarus –0.43 7.2 3,927 100 93 0.4 6 60.3 2,922 34.9Economy States and markets Global linksBelgium –0.16 13.2 1,089 100 100 1.2 21 103.6 5,586 93.8Belize 0.67 20.6 44,868 98 90 3.0 12 0.4 .. ..Benin 1.04 23.3 1,132 75 13 4.2 48 4.9 413 0.2Bermuda 0.00 5.1 .. .. .. 0.7 .. 0.5 .. ..Bhutan –0.34 28.3 105,653 96 44 3.9 20 0.4 .. ..Bolivia 0.50 18.5 30,085 88 27 2.2 57 14.5 737 6.9Bosnia and Herzegovina 0.00 0.6 9,461 99 95 0.9 21 30.1 1,703 17.1Botswana 0.99 30.9 1,182 96 62 2.2 64 4.4 1,128 0.5TablesThe tables include all <strong>World</strong> Bank member countries (188),and all other economies with populations of more than30,000 (214 total). Countries and economies are listedalphabetically (except for Hong Kong SAR, China, andMacao SAR, China, which appear after China).The term country, used interchangeably with economy,does not imply political independence but refers to any territoryfor which authorities report separate social or economicstatistics. When available, aggregate measures for incomeand regional groups appear at the end of each table.Brazil 0.50 26.0 27,551 98 79 1.2 18 367.1 1,363 515.7Brunei Darussalam 0.44 29.6 20,939 .. .. 2.2 44 9.3 8,308 3.9Bulgaria –1.53 8.9 2,858 100 100 –1.7 40 42.8 2,370 46.0Burkina Faso 1.01 14.2 737 79 17 6.2 65 1.7 .. ..Burundi 1.40 4.8 1,173 72 46 4.9 24 0.2 .. ..Cambodia 1.34 23.4 8,431 64 31 2.1 42 4.6 355 1.0Cameroon 1.05 9.0 13,629 77 49 3.3 59 6.7 363 5.9Canada 0.00 6.2 82,647 100 100 1.2 15 513.9 7,380 607.8Cape Verde –0.36 0.2 599 88 61 2.1 .. 0.3 .. ..Cayman Islands 0.00 1.5 .. 96 96 0.9 .. 0.5 .. ..Central African Republic 0.13 17.7 31,425 67 34 2.6 35 0.2 .. ..Chad 0.66 9.4 1,301 51 13 3.0 83 0.4 .. ..Channel Islands .. 0.5 .. .. .. 0.8 .. .. .. ..Chile –0.25 13.3 51,188 96 96 1.1 46 66.7 1,807 60.4China –1.57 16.0 2,093 91 64 3.0 59 7,687.1 1,807 4,208.3Hong Kong SAR, China .. 41.8 .. .. .. 0.1 .. 37.0 1,951 38.3Macao SAR, China .. .. .. .. .. 2.2 .. 1.5 .. ..Colombia 0.17 20.5 45,006 92 77 1.7 19 71.2 696 56.8Comoros 9.34 .. 1,592 95 36 2.9 30 0.1 .. ..Congo, Dem. Rep. 0.20 10.0 13,283 45 24 4.3 35 2.7 360 7.9Congo, Rep. 0.07 9.7 53,626 71 18 3.0 57 1.9 363 0.646 <strong>World</strong> <strong>Development</strong> <strong>Indicators</strong> <strong>2013</strong> Front Users guide <strong>World</strong> view People EnvironmentAggregate measures for income groupsAggregate measures for income groups include the 214economies listed in the tables, plus Taiwan, China, wheneverdata are available. To maintain consistency in theaggregate measures over time and between tables, missingdata are imputed where possible.Aggregate measures for regionsThe aggregate measures for regions cover only low- andmiddle-income economies.The country composition of regions is based on the<strong>World</strong> Bank’s analytical regions and may differ from commongeographic usage. For regional classifications, seethe map on the inside back cover and the list on the backcover flap. For further discussion of aggregation methods,see Statistical methods.Data presentation conventions• A blank means not applicable or, for an aggregate, notanalytically meaningful.• A billion is 1,000 million.• A trillion is 1,000 billion.• Figures in orange italics refer to years or periods otherthan those specified or to growth rates calculated forless than the full period specified.• Data for years that are more than three years from therange shown are footnoted.• The cutoff date for data is February 1, <strong>2013</strong>.xii <strong>World</strong> <strong>Development</strong> <strong>Indicators</strong> <strong>2013</strong> Front ? User guide <strong>World</strong> view People Environment
Environment 3Deforestation Nationally Internal Access to Access to Urban Particulate Carbon Energy use Electricityprotected renewable improved improved population matter dioxideproductionareas freshwater water sanitationconcentration emissionsTerrestrial and resources b source facilitiesurban-populationweightedPM10Per capita billionmarine areasaverageaverage % of total Per capita % of total % of total annual micrograms per million kilograms of kilowattannual % territorial area cubic meters population population % growth cubic meter metric tons oil equivalent hours2000–10 2011 2011 2010 2010 1990–2011 2010 2009 2010 2010Costa Rica –0.93 17.6 23,780 97 95 2.2 27 8.3 998 9.6Côte d’Ivoire –0.15 21.8 3,813 80 24 3.5 30 6.6 485 6.0Croatia –0.19 9.5 8,562 99 99 0.2 22 21.5 1,932 14.0Cuba –1.66 5.3 3,387 94 91 –0.1 15 31.6 975 17.4Curacao .. .. .. .. .. .. .. .. .. ..Cyprus –0.09 4.5 699 100 100 1.4 27 8.2 2,215 5.4Czech Republic –0.08 15.1 1,253 100 98 –0.3 16 108.1 4,193 85.3Denmark –1.14 4.1 1,077 100 100 0.6 15 45.7 3,470 38.8Djibouti 0.00 0.0 331 88 50 2.0 28 0.5 .. ..Dominica 0.58 3.7 .. .. .. 0.1 20 0.1 .. ..Dominican Republic 0.00 24.1 2,088 86 83 2.1 14 20.3 840 15.9Ecuador 1.81 38.0 29,456 94 92 2.2 19 30.1 836 17.7Egypt, Arab Rep. –1.73 6.1 22 99 95 2.1 78 216.1 903 146.8El Salvador 1.45 1.4 2,850 88 87 1.3 28 6.3 677 6.0Equatorial Guinea 0.69 14.0 36,100 .. .. 3.2 6 4.8 .. ..Eritrea 0.28 3.8 517 61 14 5.2 61 0.5 142 0.3Estonia 0.12 22.6 9,486 98 95 0.1 9 16.0 4,155 13.0Ethiopia 1.08 18.4 1,440 44 21 3.7 47 7.9 400 5.0Faeroe Islands 0.00 .. .. .. .. 0.8 11 0.7 .. ..Fiji –0.34 0.2 32,876 98 83 1.7 20 0.8 .. ..Finland 0.14 8.5 19,858 100 100 0.6 15 53.6 6,787 80.7France –0.39 17.1 3,057 100 100 1.2 12 363.4 4,031 564.3French Polynesia –3.97 0.1 .. 100 98 1.1 .. 0.9 .. ..Gabon 0.00 14.6 106,892 87 33 2.3 7 1.6 1,418 1.8Gambia, The –0.41 1.3 1,689 89 68 3.7 60 0.4 .. ..Georgia 0.09 3.4 12,958 98 95 1.0 49 5.8 700 10.1Germany 0.00 42.3 1,308 100 100 0.2 16 734.6 4,003 622.1Ghana 2.08 14.0 1,214 86 14 3.6 22 7.4 382 8.4Greece –0.81 9.9 5,133 100 98 0.3 27 94.9 2,440 57.4Greenland 0.00 40.1 .. 100 100 0.2 .. 0.6 .. ..Grenada 0.00 0.1 .. .. 97 1.3 19 0.2 .. ..Guam 0.00 3.6 .. 100 99 1.3 .. .. .. ..Guatemala 1.40 29.5 7,400 92 78 3.4 51 15.2 713 8.8Guinea 0.54 6.4 22,110 74 18 3.8 55 1.2 .. ..Guinea-Bissau 0.48 26.9 10,342 64 20 3.6 48 0.3 .. ..Guyana 0.00 4.8 318,766 94 84 0.5 20 1.6 .. ..Haiti 0.76 0.1 1,285 69 17 3.8 35 2.3 229 0.6Honduras 2.06 13.9 12,371 87 77 3.1 34 7.7 601 6.7Hungary –0.62 5.1 602 100 100 0.4 15 48.7 2,567 37.4Classification of economiesFor operational and analytical purposes the <strong>World</strong> Bank’smain criterion for classifying economies is gross nationalincome (GNI) per capita (calculated using the <strong>World</strong> BankAtlas method). Because GNI per capita changes over time,the country composition of income groups may changefrom one edition of <strong>World</strong> <strong>Development</strong> <strong>Indicators</strong> to thenext. Once the classification is fixed for an edition, basedon GNI per capita in the most recent year for which dataare available (2011 in this edition), all historical data presentedare based on the same country grouping.Low-income economies are those with a GNI per capitaof $1,025 or less in 2011. Middle-income economies arethose with a GNI per capita of more than $1,025 but lessthan $12,475. Lower middle-income and upper middleincomeeconomies are separated at a GNI per capita of$4,036. High-income economies are those with a GNI percapita of $12,476 or more. The 17 participating membercountries of the euro area are presented as a subgroupunder high income economies.Iceland –4.99 13.2 532,892 100 100 0.4 18 2.0 16,882 17.1India –0.46 4.8 1,165 92 34 2.5 52 1,979.4 566 959.9Indonesia 0.51 6.4 8,332 82 54 2.5 60 451.8 867 169.8Iran, Islamic Rep. 0.00 6.9 1,718 96 100 1.3 56 602.1 2,817 233.0Iraq –0.09 0.1 1,068 79 73 2.8 88 109.0 1,180 50.2Ireland –1.53 1.2 10,707 100 99 2.7 13 41.6 3,218 28.4Isle of Man 0.00 .. .. .. .. 0.5 .. .. .. ..Israel –0.07 15.1 97 100 100 1.9 21 67.2 3,005 58.6Economy States and markets Global links Back<strong>World</strong> <strong>Development</strong> <strong>Indicators</strong> <strong>2013</strong> 47StatisticsAdditional information about the data is provided in Primarydata documentation, which summarizes national andinternational efforts to improve basic data collection andgives country-level information on primary sources, censusyears, fiscal years, statistical methods and concepts used,and other background information. Statistical methods providestechnical information on some of the general calculationsand formulas used throughout the book.Symbols.. means that data are not available or that aggregates0 or0.0cannot be calculated because of missing data in theyears shown.means zero or small enough that the number wouldround to zero at the displayed number of decimal places./ in dates, as in 2010/11, means that the period oftime, usually 12 months, straddles two calendar yearsand refers to a crop year, a survey year, or a fiscal year.$ means current U.S. dollars unless otherwise noted.< means less than.Country notes• Data for China do not include data for Hong Kong SAR,China; Macao SAR, China; or Taiwan, China.• Data for Indonesia include Timor-Leste through 1999.• Data for Mayotte, to which a reference appeared in previouseditions, are included in data for France.• Data for Serbia do not include data for Kosovo orMonte negro.• Data for Sudan include South Sudan unless otherwisenoted.Economy States and markets Global links Back<strong>World</strong> <strong>Development</strong> <strong>Indicators</strong> <strong>2013</strong> xiii
- Page 3: The world by incomeLow ($1,025 or l
- Page 6 and 7: © 2013 International Bank for Reco
- Page 8 and 9: AcknowledgmentsThis book was prepar
- Page 10 and 11: PartnersDefining, gathering, and di
- Page 12 and 13: PartnersNational ScienceFoundationU
- Page 14 and 15: PartnersPrivate and nongovernmental
- Page 18 and 19: User guide to WDI online tablesStat
- Page 20 and 21: User guide to DataFinderDataFinder
- Page 22 and 23: WORLDVIEW?xviii World Development I
- Page 24 and 25: Goal 1 Eradicate extreme povertyPov
- Page 26 and 27: Goal 2 Achieve universal primary ed
- Page 28 and 29: Goal 3 Promote gender equality and
- Page 30 and 31: Goal 4 Reduce child mortalityUnder-
- Page 32 and 33: Goal 5 Improve maternal healthMater
- Page 34 and 35: Goal 6 Combat HIV/AIDS, malaria, an
- Page 36 and 37: Goal 7 Ensure environmental sustain
- Page 38 and 39: Goal 8 Develop a global partnership
- Page 40 and 41: Millennium Development GoalsGoals a
- Page 42 and 43: 1 World viewPopulationSurfaceareaPo
- Page 44 and 45: 1 World viewPopulationSurfaceareaPo
- Page 46 and 47: 1 World viewPopulationSurfaceareaPo
- Page 48 and 49: 1 World viewPPP rates are calculate
- Page 50 and 51: Poverty ratesInternational povertyl
- Page 52 and 53: Poverty ratesInternational povertyl
- Page 54 and 55: Poverty ratesAbout the dataThe Worl
- Page 56 and 57: PEOPLE34 World Development Indicato
- Page 58 and 59: HighlightsEast Asia & Pacific: Narr
- Page 60 and 61: 2 PeoplePrevalenceof childmalnutrit
- Page 62 and 63: 2 PeoplePrevalenceof childmalnutrit
- Page 64 and 65: 2 PeoplePrevalenceof childmalnutrit
- Page 66 and 67:
2 Peopleregistration systems or, in
- Page 68 and 69:
2 PeopleDefinitions• Prevalence o
- Page 70 and 71:
2 PeopleShare of consumption or inc
- Page 72 and 73:
ENVIRONMENT50 World Development Ind
- Page 74 and 75:
HighlightsEast Asia & Pacific: More
- Page 76 and 77:
3 EnvironmentDeforestation aaverage
- Page 78 and 79:
3 EnvironmentDeforestation aaverage
- Page 80 and 81:
3 EnvironmentDeforestation aaverage
- Page 82 and 83:
3 Environmentpollution, alone or wi
- Page 84 and 85:
3 EnvironmentOnline tables and indi
- Page 86 and 87:
ECONOMY64 World Development Indicat
- Page 88 and 89:
HighlightsEast Asia & Pacific: Serv
- Page 90 and 91:
4 EconomyGross domestic productGros
- Page 92 and 93:
4 EconomyGross domestic productGros
- Page 94 and 95:
4 EconomyGross domestic productGros
- Page 96 and 97:
4 Economysame extent as the foreign
- Page 98 and 99:
4 EconomyOnline tables and indicato
- Page 100 and 101:
STATES ANDMARKETS78 World Developme
- Page 102 and 103:
HighlightsEast Asia & Pacific: Pate
- Page 104 and 105:
5 States and marketsBusinessentryde
- Page 106 and 107:
5 States and marketsBusinessentryde
- Page 108 and 109:
5 States and marketsBusinessentryde
- Page 110 and 111:
5 States and marketsunavailable, fr
- Page 112 and 113:
5 States and marketsTo access the W
- Page 114 and 115:
GLOBALLINKS92 World Development Ind
- Page 116 and 117:
HighlightsEast Asia & Pacific: Equi
- Page 118 and 119:
6 Global linksMerchandisetradeNet b
- Page 120 and 121:
6 Global linksMerchandisetradeNet b
- Page 122 and 123:
6 Global linksMerchandisetradeNet b
- Page 124 and 125:
6 Global linkslabor, entrepreneuria
- Page 126 and 127:
6 Global linksOnline tables and ind
- Page 128 and 129:
106 World Development Indicators 20
- Page 130 and 131:
Primary data documentationCurrencyN
- Page 132 and 133:
Primary data documentationCurrencyN
- Page 134 and 135:
Primary data documentationCurrencyN
- Page 136 and 137:
Primary data documentationCurrencyN
- Page 138 and 139:
Primary data documentation notes•
- Page 140 and 141:
Statistical methodsThis section des
- Page 142 and 143:
Statistical methodsinternational in
- Page 144 and 145:
CreditsTabary, Bala Bhaskar Naidu K
- Page 148:
ECO-AUDITEnvironmental Benefits Sta