Cethar Vessels - Hindusthan National Glass & Industries Limited.
Cethar Vessels - Hindusthan National Glass & Industries Limited.
Cethar Vessels - Hindusthan National Glass & Industries Limited.

You also want an ePaper? Increase the reach of your titles
YUMPU automatically turns print PDFs into web optimized ePapers that Google loves.
<strong>Hindusthan</strong> <strong>National</strong> <strong>Glass</strong><br />
RATING<br />
MID@S<br />
Corporate Factsheet<br />
Promoter Background <strong>Hindusthan</strong> <strong>National</strong> <strong>Glass</strong> was established in 1946 by Chandra Kumar<br />
Somany. His sons, Sanjay Somany and Mukul Somany ,Managing Director and<br />
Vice-Chairman in the company respectively, run the business.<br />
Presence<br />
6 units - Bahadurgarh , Neemrana, Nashik, Rishikesh, Rishra and Puducherry<br />
Fundamental View<br />
Current Market Price<br />
Recommended<br />
entry price<br />
Target Price/IRR<br />
Rs.272( as on 11th<br />
November,2010 on BSE)<br />
CMP<br />
430/35% p.a<br />
Management depth<br />
Business<br />
Laxmi Narayan Mandhana,CFO, and Jagdish Prasad Kasera, Senior President<br />
are the senior level professionals .Top management has an experience of 6<br />
decades in the business<br />
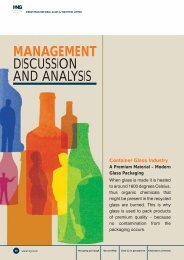
Manufactures glass containers for industries like liquor, cosmetics, beverages,<br />
processed foods, and pharmaceuticals.<br />
Market Data<br />
Market Cap (Rs.mn)<br />
23,756 at CMP<br />
Shareholding Promoters: 70%<br />
Institutions/Others: 30%<br />
Corporate Structure<br />
Revenue Model<br />
The group companies are <strong>Glass</strong> equipment (India) & HNG Float <strong>Glass</strong> (through<br />
an associate company)<br />
Revenue is based on piece rate basis<br />
Key Shareholders<br />
52-week High-Low<br />
(Rs.)<br />
Sequoia Capital-7.27%<br />
275-112<br />
Capacity<br />
2,825 TPD in FY10; Plans to ramp it up to 4,150TPD by FY13<br />
All time High-Low<br />
(Rs.)<br />
327-13<br />
Key Clientele<br />
Key Vendors<br />
Some of the clients include Coca Cola India, Pepsi India, Glaxo India, UB<br />
Group, Nestle India & Ranbaxy<br />
Tata Chemicals, Nirma, IOC, BPCL,GAIL, Magadi<br />
3M Average Volume<br />
Stock Return (%)<br />
Qty:43,235; Rs.4.18mn<br />
3M 6M 1Y YTD<br />
12 31 93 90<br />
Key Success Factors<br />
Credit Rating<br />
Corporate Bankers<br />
Auditors<br />
Strong distribution network, use of advanced technology, quality<br />
PR1+ for short term debt issued during August’09.Long Term Credit rating of<br />
AA+ from CARE<br />
HSBC, State Bank of India, HDFC<br />
Lodha & Co<br />
Correction from 52WH 0%<br />
Rise from 52WL 143%<br />
F&O -<br />
Index -<br />
Stock exchange list BSE,NSE,CSE<br />
B.Natesan - 044 43440006 , natesan@sparkcapital.in Private & Confidential 1
<strong>Hindusthan</strong> <strong>National</strong> <strong>Glass</strong><br />
RATING<br />
MID@S<br />
Opportunity to back market leader with good growth prospects …<br />
• HNGIL is a market leader in the container glass industry in India with a market share of ~60%. Immediate peers are Piramal <strong>Glass</strong> (focus on cosmetics segment) and Hindustan<br />
Sanitaryware. Thus it enjoys pricing power in the industry.<br />
• The user industry for the container glass are IMFL & Beer, Food & Beverages, Pharmaceuticals and Cosmetics. The user industry is expected to grow at ~10-12% over the<br />
coming years driven largely by IMFL & Beer . HNGIL garners 60% market share in the IMFL & 75% share in the Beer space<br />
• Total Capacity of 2825 TPD across 6 facilities with a secular geographic spread (business advantage as proximity to end use market is a business demand considering the fact<br />
that empty glass cannot be transported more than 500kms);thus giving it access to all the regions in the country<br />
• Capex of ~Rs.10bn to augment container glass production capacity by 45% by FY13;Topline to grow at a CAGR of 18% over the next 3 years.<br />
• Entry into float glass business through 600tpd facility at Gujarat.Considering its past growth strategy coupled with comfortable balance sheet, we don’t rule out any plans for<br />
Indian/Overseas acquisitions over the coming years<br />
… as also solid financial strength<br />
• Sales ,EBITDA and PAT CAGR of 38%,43% and 65% over the past 3 years<br />
• Strong net cashflow from operations (CFO) in FY10 at Rs.2.9bn ;average Net CFO at 15% of sales in the last 5 years.<br />
• Acquisition of loss making units at inexpensive prices coupled with improving operating efficiencies has culminated into a comfortable debt/equity ratio ; one of the lowest in the<br />
industry. (refer debt/equity chart on page 8).Average D/E ratio for last 5 years is 0.76:1<br />
• ROE at ~15.5% in FY10 is the highest among its national and international peers. We expect ROE to improve ~200bps to 17.5% by FY13.Last 5 years average ROE at ~19%.<br />
… with scope for improvement in EBITDA margins<br />
• At present, HNGIL uses furnace oil as a feedstock for energy. The company will switch over gradually to natural gas (contract in place for three plants & in process for the other<br />
three) as a feedstock over the next 3 -4years which will result in EBITDA expansion of 700bps over FY10-14<br />
• Sand mining and sand beneficiation facilities to improve packing ratio (owing to reduction in default pieces) going ahead as sand is a key quality component in manufacturing<br />
glass<br />
• Sand beneficiation + higher truck fleet + backward integration through own moulds +efficiency measures should further spice up the margin expansion by~200 bps. (though not<br />
factored in the model thus providing cushion)<br />
Valued attractively for a 2-3 year play!<br />
Investment Thesis<br />
• We believe that HNG is a compelling long term story to invest into considering the fact that the company is at the cusp of a sustained business growth coupled with the<br />
significant improvement in operating parameters<br />
• At the CMP of Rs.272,HNG trades inexpensive (according to us) at 9.4x P/E and 5.6x EV/EBITDA on FY13 estimates .On FY12 estimates,HNG trades at PE of 14.1x &<br />
EV/EBITDA of 7.9x whereas peer group namely Hindustan Sanitaryware and Piramal <strong>Glass</strong> trade at 9.2x and 7.9x on FY12E EPS & 5.9x and 6.4x on FY12E EV/EBITDA.<br />
• We believe HNG should trade at premium multiples compared to its peers given its leadership status, superior operating parameters and healthier balance sheet.<br />
• We would value the stock using a combination of EV/EBITDA( considering the significant capex being incurred over the next couple of years), and P/E metric.We attach an<br />
EV/EBITDA multiple of 8.5x and P/E multiple of 12.5x on FY13 numbers whereas we value the float glass business at 1x price to book.We arrive at a one and a half year target<br />
price of Rs.430 per share translating into an upside of 35% p.a. Recommend a BUY with 4 star rating.<br />
B.Natesan - 044 43440006 , natesan@sparkcapital.in Private & Confidential 2
<strong>Hindusthan</strong> <strong>National</strong> <strong>Glass</strong><br />
RATING<br />
MID@S<br />
Business Drivers – Favourable industry scenario<br />
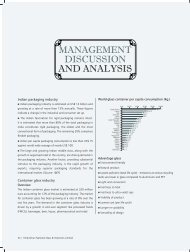
Global packaging industry at ~USD 500bn …India mere 3% of the global size<br />
India - One of the lowest consumer of container glass in the world<br />
• Global Packaging Industry at ~USD 500 bn, expected to touch USD 597bn<br />
by 2014<br />
• At Rs.775bn,Indian Packaging Industry translates to a mere ~3% of the<br />
global size<br />
• <strong>Glass</strong> Packaging industry 6-7% of the overall packaging industry<br />
South Korea<br />
France<br />
Spain<br />
USA<br />
UK<br />
Mexico<br />
Japan<br />
China<br />
Brazil<br />
India<br />
Indonesia<br />
1.4<br />
1.2<br />
5.9<br />
4.8<br />
10.2<br />
19.5<br />
27.5<br />
27.5<br />
50.3<br />
63.9<br />
• Indian ratio abysmal<br />
• Huge potential to<br />
increase going forward<br />
89<br />
0 20 40 60 80 100<br />
Source: Company Presentation<br />
Source: Company Presentation figure in kg<br />
Rising per capita income in USD<br />
… driving consumption of alcobev, food, beverages<br />
1,500<br />
IMFL<br />
1,000<br />
500<br />
0<br />
1,000 1,010 1,030<br />
831<br />
741<br />
649<br />
562<br />
468 488<br />
2001 2002 2003 2004 2005 2006 2007 2008 2009<br />
• Per capita consumption<br />
low at 1.83 litres against<br />
global average of 3.1 litres<br />
• Expected to grow at<br />
10-12% per annum<br />
Beer<br />
• Far lower per capita<br />
consumption at 1.3 litres<br />
against global average<br />
of 24 litres<br />
• Better lifestyle will drive<br />
consumption growth<br />
Food and Beverages<br />
• Higher disposable<br />
income – a key driver<br />
• F&B growing at 8-10%<br />
Per capita Income<br />
Source: Company Presentation<br />
Source: Industry REports<br />
B.Natesan - 044 43440006 , natesan@sparkcapital.in<br />
Private & Confidential<br />
3
Tpd<br />
<strong>Hindusthan</strong> <strong>National</strong> <strong>Glass</strong><br />
RATING<br />
MID@S<br />
HNG in a nutshell – Risen to market leadership over the years<br />
42% of capacity creation through acquisition of loss making units<br />
Manufacturing facilities across the country giving it pan India presence …<br />
4,000<br />
3,000<br />
2,000<br />
Capacity<br />
Expansion<br />
Acquisition<br />
of Ow en's<br />
1,100<br />
1,800<br />
L&T plant<br />
acquisition<br />
2,150<br />
Capacity<br />
expansion<br />
2,435<br />
Loss making<br />
unit at Neemrana<br />
2,585<br />
2,825<br />
Location Capacity in TPD Furnaces<br />
Rishra 805 3<br />
Bahadurgarh 655 3<br />
Neemrana 180 1<br />
1,000<br />
Rishikesh 425 2<br />
30<br />
0<br />
1952 2000-01 2001-02 2005-06 2006-07 2007-08 Present<br />
Capacity<br />
Source: Company<br />
Nashik 390 1<br />
Puducherry 370 1<br />
Source: Company<br />
Leader by a mile …<br />
Marquee Clientele<br />
HNG<br />
2825TPD<br />
• Largest container<br />
glass manufacturer<br />
• Garners a country<br />
market share of ~60%<br />
HSIL<br />
1000TPD<br />
• Leader in the South with<br />
a share of 70%<br />
• 17% market share in the<br />
country volumes<br />
Piramal <strong>Glass</strong><br />
675TPD<br />
• Small but a niche player<br />
specializing in the<br />
cosmetics segment<br />
Source: SPARK Capital<br />
Source: Company;SPARK Capital<br />
B.Natesan - 044 43440006 , natesan@sparkcapital.in Private & Confidential 4
<strong>Hindusthan</strong> <strong>National</strong> <strong>Glass</strong><br />
RATING<br />
MID@S<br />
IMFL and Beer - key drivers for the company<br />
Revenue Mix by Volumes …<br />
… by Value<br />
Pharmaceutical<br />
11%<br />
Others<br />
11%<br />
Food<br />
13%<br />
Beer<br />
15%<br />
Pharmaceutical<br />
12%<br />
Others<br />
13%<br />
Food<br />
14%<br />
Beer<br />
14%<br />
Liquor<br />
50%<br />
Liquor<br />
47%<br />
Source: Company,SPARK Capital<br />
Source: Company,SPARK Capital<br />
Average Realization - Rs.17377 per tonne in FY10<br />
Region wise mix in FY10<br />
Pharmaceutical<br />
Food<br />
18,378<br />
19,726<br />
East<br />
20%<br />
South<br />
22%<br />
Average<br />
17,377<br />
Liquor<br />
16,503<br />
West<br />
16%<br />
Beer<br />
16,066<br />
15000 16000 17000 18000 19000 20000<br />
North<br />
42%<br />
Source: Company,SPARK Capital<br />
Source: Company,SPARK Capital<br />
B.Natesan - 044 43440006 , natesan@sparkcapital.in Private & Confidential 5
Rs. mn<br />
Rs. mn<br />
<strong>Hindusthan</strong> <strong>National</strong> <strong>Glass</strong><br />
RATING<br />
MID@S<br />
Story – Capacity to expand 45% by FY13….EBITDA margin to expand by 500bps over the years<br />
Capex of ~Rs.10bn over the next 3 years …<br />
… to ramp up container glass capacity to 4150tpd by FY13<br />
Location As on FY10 Capacity Adition Timeline<br />
Rishra 805 265 FY12<br />
Bahadurgarh 725 140 FY11<br />
Rishikesh 156 25 FY11<br />
To rev-up<br />
exposure<br />
in AP –<br />
the largest<br />
liquor<br />
consumin<br />
g state in<br />
India<br />
1.4<br />
1.2<br />
1.0<br />
0.8<br />
0.6<br />
0.4<br />
0.2<br />
0.3<br />
0.2<br />
0.2<br />
0.1<br />
0.1<br />
Nashik 354 24 FY12<br />
0.0<br />
FY10 FY11 FY12 FY13 FY14<br />
0.0<br />
Naidupeta, AP 0 650 FY13<br />
Volume in mn<br />
Grow th<br />
Source: Company,SPARK Capital units in tpd – tonnes per day<br />
Source: Company,SPARK Capital<br />
Switchover to natural gas as a source of fuel …<br />
… resulting in an EBITDA expansion of 500bps<br />
Location<br />
Natural Gas<br />
Availability<br />
Savings of ~Rs.900-1200 per tonne<br />
Rishra in two years Furnace Oil per tonne 145 litre<br />
Bahadurgarh Commenced Supply Price of FO Rs.26 per litre<br />
0.3<br />
0.3<br />
0.2<br />
20.6%<br />
21.8%<br />
23.3% 23.5%<br />
25.7%<br />
Rishikesh in two years Fuel Cost per tonne Rs.3770<br />
Nashik from April 2011 Natural Gas per tonne 150-190 SCM<br />
Neemrana<br />
Puducherry<br />
Started supply in July<br />
2010<br />
Likely to start supply<br />
from 2012<br />
Price<br />
Fuel Cost per tonne<br />
Rs.15<br />
Rs.2850<br />
Naidupeta contract in place Savings per tonne Rs.920<br />
0.2<br />
0.1<br />
0.1<br />
0.0<br />
FY10 FY11 FY12 FY13 FY14<br />
EBITDA in %<br />
Source: Company,SPARK Capital<br />
Source: Company,SPARK Capital<br />
B.Natesan - 044 43440006 , natesan@sparkcapital.in Private & Confidential 6
<strong>Hindusthan</strong> <strong>National</strong> <strong>Glass</strong><br />
RATING<br />
MID@S<br />
Lowest debt Equity ratio in the industry at ~0.5:1 … leaving sufficient scope for company’s inorganic growth plans<br />
Rexam<br />
HSIL<br />
Ow ens<br />
Amcor<br />
Piramal <strong>Glass</strong><br />
1.1<br />
1.2<br />
1.4<br />
2.6<br />
2.9<br />
• Commendable for glass<br />
manufacturing company<br />
• Company has embarked on a strategy to take HNG global<br />
• Scouting for acquisitions abroad to mark international presence.<br />
Expecting to close a deal by March’2011<br />
• Plans to add 2 nd float line of 1050tpd at existing facility at Halol;100<br />
tpd cosmetics plant at Nashik plant on the drawing board stage.<br />
Saint Gobain<br />
HNG<br />
0.5<br />
0.8<br />
• Leaves room for funding<br />
future growth plans<br />
• Exports + 2 nd float line will cost ~Rs.17bn (on going capex excluded)<br />
0.0 0.5 1.0 1.5 2.0 2.5 3.0<br />
Debt/Equity<br />
• Funding through internal accruals + debt + sale of treasury<br />
shares(16.7% as on today)<br />
Source : Bloomberg, SPARK Capital<br />
Solid Financials – Scores high amongst national & international peers<br />
• Sales, EBITDA and PAT CAGR of 38%, 43% and 65% over the past 3 years; Operating margins at 20% for FY10 – expanded by 400bps over the past 4 years<br />
• Debt Equity extremely comfortable at 0.5:1 considering the highly capital intensive nature of the industry ;asset turnover ~0.7:1; Interest coverage at 4.9x in FY10;average of<br />
4.3x over the last 4 years<br />
• ROEs at 15.5% and ROCE at 13% for FY10.Though not attractive on an absolute basis, extremely attractive relative to its peers. (chart below : Source Bloomberg)<br />
Total Asset<br />
Currency Company Name Bloomberg Code Debt/Equity turnover EBITDA Margin PAT Margin ROE ROCE<br />
INR HNG HNGI IN 0.5 0.7 21% 11% 16% 13%<br />
INR Piramal PIRA IN 2.6 0.7 22% 0.4% 2% 10%<br />
INR HSIL HSIL IN 0.8 0.7 18% 5% 9% 9%<br />
USD Owens OI US 2.9 0.8 19% 2% 9% 2%<br />
GBP Rexam REX LN 1.2 0.8 14% -0.6% -1% 1%<br />
Euro Saint Gobain OLG GR 1.1 0.9 10% 0.5% 1% 1%<br />
AUD Amcor AMC AU 1.4 0.9 12% 2% 6% 5%<br />
B.Natesan - 044 43440006 , natesan@sparkcapital.in Private & Confidential 7
<strong>Hindusthan</strong> <strong>National</strong> <strong>Glass</strong><br />
RATING<br />
MID@S<br />
Entry into float glass with a 600tpd capacity at Halol, Gujarat<br />
Details of the venture<br />
Competitive Landscape<br />
• 600TPD capacity at Halol, Gujarat<br />
• Project cost of Rs.6bn with a funding mix of Rs.2.5bn equity and<br />
Rs.3.5bn debt<br />
• Floated an associate company – <strong>Hindusthan</strong> Float <strong>Glass</strong><br />
• Equity Stakes: 47% by <strong>Hindusthan</strong> <strong>National</strong> <strong>Glass</strong>, 12.4% by IFC,<br />
Washington and the rest by promoters<br />
1,600<br />
1,400<br />
1,200<br />
1,000<br />
800<br />
600<br />
400<br />
200<br />
16%<br />
31% 29.40%<br />
10.37%<br />
13%<br />
35%<br />
30%<br />
25%<br />
20%<br />
15%<br />
10%<br />
5%<br />
Why Float <strong>Glass</strong><br />
0<br />
0%<br />
0%<br />
• Float <strong>Glass</strong> finds application in construction and automotive<br />
Gujarat<br />
Guardian<br />
Asahi India<br />
<strong>Glass</strong><br />
Saint Gobain<br />
<strong>Glass</strong><br />
Gold Plus<br />
Sejal<br />
Artchitectural<br />
<strong>Glass</strong><br />
HNG Float<br />
<strong>Glass</strong><br />
• Revival in economy resulting in pick up in both the sectors<br />
Total Capacity in TPD<br />
Market Share<br />
• Both the sectors expected to witness high growth<br />
• 60 years of glass manufacturing prowess<br />
• Manufacturing process not too different<br />
• Float <strong>Glass</strong> industry growing at 12-15% over the last 9 years<br />
Management’s view on the new venture<br />
• Management is extremely gung-ho about the business<br />
prospects;growth of 20-25% CAGR expected over the coming years<br />
• HNG started production in Feb 2010<br />
• As per Industry reports, HNG has garnered a market share of 13% in the 2<br />
months of production .*<br />
Our View<br />
• We echo the management’s confidence of transferring the container glass<br />
manufacturing expertise to the float glass business<br />
• We reserve our concerns on the demand side being cyclical – doubts on<br />
managements' capability on managing cyclicality<br />
• We value the business on 1x price to book translating into<br />
Rs. 13 per share for HNG shareholders<br />
* As per the management, YTD market share is 27%.We have not captured<br />
it in the graph as we do not have other company data.<br />
B.Natesan - 044 43440006 , natesan@sparkcapital.in Private & Confidential 8
RATING<br />
MID@S<br />
Future Outlook<br />
• We have assumed a volume growth of 40% over FY10-13 ie 12% CAGR and higher realisation of 6%;Sales to grow at a CAGR of 18% to Rs. 22.8bn by FY 13.<br />
• On the RM front, though we appreciate the fact that soda ash prices are volatile, we have kept the margins constant assuming complete pass through of price increase to<br />
customers thanks to the leadership status that HNG enjoys.<br />
• We expect a 250-300bps fall in power and fuel costs by FY13 on account of shift to natural gas. Coupled with higher operating leverage, the operating margins are expected to<br />
expand by 440bps to 25%<br />
• With the company reverting to full tax rate by FY12, we expect PAT to grow at a slower pace of 18% CAGR over FY10-13 negating the improvement in operating margins<br />
• We don’t foresee major shift in the working capital cycle going ahead. We expect the company to continue throwing cash at the operating level though FCF will be negative<br />
considering the cash outflow towards capacity expansion.<br />
• Thanks to the higher CFO, we don’t see a major stress on the debt/equity ratio;forsee D/E ratio at 0.57 by FY13.<br />
• We expect Return on equity to expand by ~200bps to 17.5% in FY13 as against 15.5% in FY10 whereas expect the ROCEs to remain at ~13%.<br />
• We have not factored the higher realisations that could accrue from better product mix and sale of value added products like lighter weight bottles<br />
• We have also not factored the benefits that could accrue to EBITDA from the efficiency measures undertaken by the company<br />
Valuation – Stock appears attractive from a 3-4 year horizon; BUY with a TP of Rs.430 on a one and half year horizon<br />
• At CMP of Rs.272 (as on 11th November,2010), the stock trades at 5.6x EV/EBITDA and 9.4x PE on FY13 estimates.<br />
• Taking cognizance of the improvement in operational parameters coupled with the tax benefit waning off by FY12,we value the stock using a combination of EV/EBITDA and<br />
P/E metric.<br />
• Attaching a multiple of 8.5x EBITDA and 12.5x P/E on FY13 numbers , we arrive at a average standalone share value of Rs.417 ;On a 1x P/B basis, we ascribe a value of<br />
Rs.13 per share for the float glass business<br />
• Recommend a BUY with a target price of Rs. 430 over a one and a half year horizon implying an upside of 35% p.a.<br />
B.Natesan - 044 43440006 , natesan@sparkcapital.in Private & Confidential 9
<strong>Hindusthan</strong> <strong>National</strong> <strong>Glass</strong><br />
RATING<br />
MID@S<br />
Financial Summary<br />
P & L (Rs. Mn) FY10 FY11E FY12E FY13E<br />
Total Revenue 13,834.5 15,376.6 18,426.1 23,483.3<br />
EBITDA 2,846.1 3,104.3 4,065.9 5,640.0<br />
Other Income 346.6 100.0 100.0 100.0<br />
EBIT 2,323.3 2,327.8 3,139.1 4,452.9<br />
PBT 1,851.0 1,741.3 2,507.6 3,776.3<br />
PAT 1,542.8 1,393.0 1,680.1 2,530.1<br />
Cashflows (Rs.mn) FY10 FY11E FY12E FY13E<br />
Operating 2935.7 2312.8 2524.7 3393.5<br />
Financing 43.1 1,556.8 1,664.1 -1,381.0<br />
Investing (3,046.2) (4,000.0) (4,000.0) (2,000.0)<br />
Free-cash -110.5 -1,687.2 -1,475.3 1,393.6<br />
Balance Sheet (Rs. Mn) FY10 FY11E FY12E FY13E<br />
Networth 10,545.1 11,733.8 13,209.5 15,739.6<br />
Total debt 5,666.4 7,366.4 8,366.4 7,866.4<br />
Gross fixed assets 16,699.9 16,974.5 22,474.5 26,974.5<br />
Net fixed assets (incl.CWIP) 11,380.2 14,503.7 17,476.9 18,189.8<br />
Net working capital 4085.1 4439.4 5441.9 6759.2<br />
Investments<br />
1,446.2 1,446.2 1,446.2 1,446.2<br />
Cash & Cash equivalents<br />
57.4 (83.9) 104.9 117.5<br />
Inventories<br />
2,223.3 2,318.6 2,654.6 3,209.9<br />
Debtors<br />
2,200.9 2,519.8 2,915.9 3,608.7<br />
Ratios/Valuation FY10 FY11E FY12E FY13E<br />
Sales growth (%) 4.0% 11.1% 19.8% 27.4%<br />
EBITDA growth (%) 31.1% 9.1% 31.0% 38.7%<br />
EBITDA Margin (%) 20.6% 20.2% 22.1% 24.0%<br />
EBIT Margin (%) 15.4% 14.1% 15.9% 17.8%<br />
Tax rate (%) 16.6% 20.0% 33.0% 33.0%<br />
PAT margin (%) 10.9% 9.0% 9.1% 10.7%<br />
Dividend/share 1.56 2.00 2.00 2.00<br />
Total Debt/Equity (%) 0.5 0.6 0.6 0.5<br />
Return on Equity (%) 16% 13% 13% 17%<br />
CMP (Rs.) 272<br />
EPS (Rs.) 17.6 15.9 19.2 28.9<br />
P/E (x) 15.4 17.1 14.1 9.4<br />
EV/EBITDA (x) 10.3 10.0 7.9 5.6<br />
Treasury shares held to the extent of 16.7% of company’s<br />
equity- to be used to part finance ongoing capex<br />
Sequoia Capital ,through one of their arms, Ironwood Holdings picked up 7%<br />
stake in the company (partly from promoter and rest from Treasury shares )at<br />
Rs.208 per share in May 2010.After the stake sale, the company still holds ~16.7%<br />
of treasury shares – open to further offloading shares to part finance its capex.<br />
B.Natesan - 044 43440006 , natesan@sparkcapital.in Private & Confidential 10
RATING<br />
MID@S<br />
Description<br />
Mid Cap Ideas from Spark (Mid@s) is a “quick-take” research product from the sales desk at Spark Capital. Sector-agnostic and bottom-up in nature, output from Mid@s spells out the investment<br />
thesis in a concise format.<br />
Clearly differentiated from regular research in its approach and style of elucidation, Mid@s seeks to pitch interesting listed market possibilities, predominantly in the mid- and small-cap segments.<br />
In terms of stocks under coverage, Mid@s does not overlap with regular research output, which is more sector-driven and stays committed to routine q-o-q analysis. Unlike regular research<br />
output, Mid@s focuses more on speed and breadth of releases, without wanting to compromise on the quality of analysis.<br />
Rating Interpretation<br />
Strong Fundamentals and attractive price: BUY<br />
Metrics appeal, pick on correction: ADD<br />
Cause for worry, gradual exit advised: REDUCE<br />
Weak Fundamentals, price unattractive: SELL<br />
Analyst Certification<br />
The Research Analyst(s) who prepared the research report hereby certify that the views expressed in this research report accurately reflect the analyst(s) personal views about the subject<br />
companies and their securities. The Research Analyst(s) also certify that the Analyst(s) have not been, are not, and will not be receiving direct or indirect compensation for expressing the specific<br />
recommendation(s) or view(s) in this report.<br />
Spark Disclaimer<br />
Typically, Mid@s targets returns of 20% + on its calls and pitches stories that have a 12 month time-horizon for a play-out.<br />
This document is provided for assistance only and is not intended to be and must not alone be taken as the basis for an investment decision. Nothing in this document should be construed as<br />
investment or financial advice, and nothing in this document should be construed as an advice to buy or sell or solicitation to buy or sell the securities of companies referred to in this document.<br />
Each recipient of this document should make such investigations as it deems necessary to arrive at an independent evaluation of an investment in the securities of companies referred to in this<br />
document (including the merits and risks involved), and should consult its own advisors to determine the merits and risks of such an investment. This document is being supplied to you solely for<br />
your information and may not be reproduced, redistributed or passed on, directly or indirectly, to any other person or published, copied, in whole or in part, for any purpose.<br />
This document does not constitute or form part of any offer for sale or subscription or incitation of any offer to buy or subscribe to any securities. This material should not be construed as an offer<br />
to sell or the solicitation of an offer to buy any security in any jurisdiction where such an offer or solicitation would be illegal. Spark Capital Advisors (India) Private <strong>Limited</strong> makes no representation<br />
or warranty, express or implied, as to the accuracy, completeness or fairness of the information and opinions contained in this document. Spark Capital Advisors (India) Private <strong>Limited</strong>, its affiliates,<br />
and the employees of Spark Capital Advisors (India) Private <strong>Limited</strong> and its affiliates may, from time to time, effect or have effected an own account transaction in, or deal as principal or agent in or<br />
for the securities mentioned in this document. They may perform or seek to perform investment banking or other services for, or solicit investment banking or other business from, any company<br />
referred to in this report. This report has been prepared on the basis of information, which is already available in publicly accessible media or developed through the independent analysis of Spark<br />
Capital Advisors (India) Private <strong>Limited</strong><br />
Copyright in this document vests exclusively with Spark Capital Advisors (India) Private <strong>Limited</strong>.<br />
B.Natesan - 044 43440006 , natesan@sparkcapital.in Private & Confidential 11