

Brian Cullis
Brian Cullis
Brian Cullis

You also want an ePaper? Increase the reach of your titles
YUMPU automatically turns print PDFs into web optimized ePapers that Google loves.
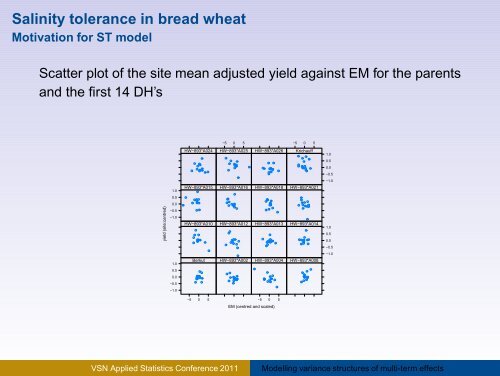
Salinity tolerance in bread wheat<br />
Motivation for ST model<br />
Scatter plot of the site mean adjusted yield against EM for the parents<br />
and the first 14 DH’s<br />
−5 0 5<br />
−5 0 5<br />
HW−893*A024<br />
HW−893*A025<br />
HW−893*A026<br />
Krichauff<br />
1.0<br />
0.5<br />
0.0<br />
−0.5<br />
1.0<br />
0.5<br />
0.0<br />
HW−893*A015 HW−893*A016 HW−893*A018 HW−893*A021<br />
−1.0<br />
yield (site:centred)<br />
−0.5<br />
−1.0<br />
HW−893*A010 HW−893*A012 HW−893*A013<br />
HW−893*A014<br />
1.0<br />
0.5<br />
0.0<br />
−0.5<br />
−1.0<br />
1.0<br />
Berkut<br />
HW−893*A002<br />
HW−893*A004<br />
HW−893*A008<br />
0.5<br />
0.0<br />
−0.5<br />
−1.0<br />
−5 0 5<br />
−5 0 5<br />
EM (centred and scaled)<br />
VSN Applied Statistics Conference 2011<br />
Modelling variance structures of multi-term effects


