San Simon Sub-Basin - Arizona Department of Environmental Quality
San Simon Sub-Basin - Arizona Department of Environmental Quality
San Simon Sub-Basin - Arizona Department of Environmental Quality

Create successful ePaper yourself
Turn your PDF publications into a flip-book with our unique Google optimized e-Paper software.
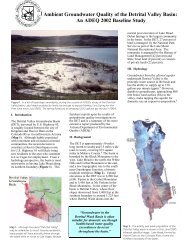
Ambient Groundwater <strong>Quality</strong> <strong>of</strong> the<br />
<strong>San</strong> <strong>Simon</strong> <strong>Sub</strong>-<strong>Basin</strong> <strong>of</strong> the Safford <strong>Basin</strong>:<br />
A 2002 Baseline Study<br />
By Douglas C. Towne<br />
Maps by Lisa Rowe<br />
<strong>Arizona</strong> <strong>Department</strong> <strong>of</strong> <strong>Environmental</strong> <strong>Quality</strong><br />
Open File Report 2004-02<br />
ADEQ Water <strong>Quality</strong> Division<br />
Hydrologic Support & Assessment Section<br />
Groundwater Monitoring Unit<br />
1110 West Washington St.<br />
Phoenix, <strong>Arizona</strong> 85007-2935<br />
Thanks:<br />
Report Preparation:<br />
Field Assistance:<br />
ADEQ Management:<br />
Photo Credits:<br />
Philip Amorosi, Nancy Carroli, Lorraine Cona, Maureen Freark, and Wang Yu<br />
Elizabeth Boettcher, Don Hall, Joe Harmon, Cheri Horsley, Jason Mahalic, and<br />
Bob Wallin. Special recognition goes to the many well owners who were kind<br />
enough to give permission to collect groundwater data on their property.<br />
Linda Taunt - Manager, Hydrologic Support and Assessment Section<br />
Wang Yu - Supervisor, Groundwater Monitoring Unit<br />
Douglas Towne<br />
Report Cover: A stark contrast exists between a brimming stock tank supplied by groundwater from Little Artesian<br />
Well and the surrounding arid landscape <strong>of</strong> the <strong>San</strong> <strong>Simon</strong> sub-basin. As is characteristic with many wells in the<br />
area, artesian pressure has decreased and a windmill now assists the water in reaching the surface. Orange Butte,<br />
a noted landmark in the <strong>San</strong> <strong>Simon</strong> Valley, rises in the background to the east.<br />
II
Other Publications <strong>of</strong> the ADEQ Ambient Groundwater Monitoring Program<br />
ADEQ Ambient Groundwater <strong>Quality</strong> Open-File Reports (OFR):<br />
Detrital Valley <strong>Basin</strong> OFR 03-03, November 2003, 65 p.<br />
<strong>San</strong> Rafael <strong>Basin</strong> OFR 03-01, February 2003, 42 p.<br />
Lower <strong>San</strong> Pedro <strong>Basin</strong> OFR 02-01, July 2002, 74 p.<br />
Willcox <strong>Basin</strong> OFR 01-09, November 2001, 55 p.<br />
Sacramento Valley <strong>Basin</strong> OFR 01-04, June 2001, 77 p.<br />
Upper <strong>San</strong>ta Cruz <strong>Basin</strong><br />
OFR 00-06, Sept. 2000, 55 p. (With the U.S. Geological Survey)<br />
Prescott Active Management Area OFR 00-01, May 2000, 77 p.<br />
Upper <strong>San</strong> Pedro <strong>Basin</strong><br />
OFR 99-12, July 1999, 50 p. (With the U.S. Geological Survey)<br />
Douglas <strong>Basin</strong> OFR 99-11, June 1999, 155 p.<br />
Virgin River <strong>Basin</strong> OFR 99-04, March 1999, 98 p.<br />
Yuma <strong>Basin</strong> OFR 98-07, September, 1997, 121 p.<br />
ADEQ Ambient Groundwater <strong>Quality</strong> Factsheets (FS):<br />
<strong>San</strong> <strong>Simon</strong> <strong>Sub</strong>-basin FS 04-06, October 2004, 4 p.<br />
Detrital Valley <strong>Basin</strong> FS 03-07, November 2003, 4 p.<br />
<strong>San</strong> Rafael <strong>Basin</strong> FS 03-03, February 2003, 4 p.<br />
Lower <strong>San</strong> Pedro <strong>Basin</strong> FS 02-09, August 2002, 4 p.<br />
Willcox <strong>Basin</strong> FS 01-13, October 2001, 4 p.<br />
Sacramento Valley <strong>Basin</strong> FS 01-10, June 2001, 4 p.<br />
Yuma <strong>Basin</strong> FS 01-03, April 2001, 4 p.<br />
Virgin River <strong>Basin</strong> FS 01-02, March 2001 4 p.<br />
Prescott Active Management Area FS 00-13, December 2000, 4 p.<br />
Douglas <strong>Basin</strong> FS 00-08, September 2000, 4 p.<br />
Upper <strong>San</strong> Pedro <strong>Basin</strong><br />
FS 97-08, August 1997, 2 p. (With the U.S. Geological Survey)<br />
ADEQ Targeted Groundwater <strong>Quality</strong> Open-File Reports (OFR) :<br />
An Assessment <strong>of</strong> Methyl Tertiary-Butyl Ether (MTBE) Groundwater Occurrence in Maricopa County.<br />
ADEQ Open File Report 02-03, February 2003, 48 p.<br />
The Impacts <strong>of</strong> Septic Systems on Water <strong>Quality</strong> <strong>of</strong> Shallow Perched Aquifers: A Case Study <strong>of</strong> Fort<br />
Valley, <strong>Arizona</strong>. ADEQ Open File Report 97-7, February 1997, 70 p.<br />
Most <strong>of</strong> these publications are available on-line.<br />
Visit the ADEQ Ambient Groundwater Monitoring Program at:<br />
http://www.azdeq.gov/environ/water/assessment/ambientst.html<br />
http://www.azdeq.gov/environ/water/assessment/targeted.html<br />
III
Table <strong>of</strong> Contents<br />
Abstract .................................................................................................................................................................... 1<br />
Introduction ............................................................................................................................................................. 2<br />
Purpose and Scope ...................................................................................................................................... 2<br />
Physical and Cultural Characteristics.......................................................................................................... 4<br />
Hydrology................................................................................................................................................................. 6<br />
Geology ...................................................................................................................................................... 6<br />
Aquifers ...................................................................................................................................................... 6<br />
Groundwater Recharge and Discharge ....................................................................................................... 7<br />
Groundwater Movement, Storage and Levels .......................................................................................... 12<br />
Groundwater Sampling Results ........................................................................................................................... 12<br />
Water <strong>Quality</strong> Standards ........................................................................................................................... 12<br />
Water <strong>Quality</strong> Standards Exceedances...................................................................................................... 13<br />
Suitability for Irrigation ............................................................................................................................ 13<br />
Analytical Results .................................................................................................................................... 13<br />
Groundwater Composition ................................................................................................................................... 24<br />
General Summary ..................................................................................................................................... 24<br />
Groundwater Chemistry ............................................................................................................................ 24<br />
Overall Constituent Co-variation .............................................................................................................. 24<br />
Aquifer Constituent Co-variation.............................................................................................................. 29<br />
Groundwater <strong>Quality</strong> Patterns............................................................................................................................. 30<br />
Spatial Variation ....................................................................................................................................... 30<br />
Co-variation with Groundwater Depth...................................................................................................... 30<br />
Co-variation with Well Depth .................................................................................................................. 30<br />
Isotope Comparison................................................................................................................................... 38<br />
Conclusions ............................................................................................................................................................ 39<br />
Suitability <strong>of</strong> Groundwater for Domestic Use .......................................................................................... 39<br />
Overall Groundwater <strong>Quality</strong>.................................................................................................................... 39<br />
Aquifer Groundwater <strong>Quality</strong> .................................................................................................................. 40<br />
Study Design and Data Evaluation............................................................................................................ 42<br />
References .............................................................................................................................................................. 43<br />
Appendices<br />
Appendix A – Basic Data on Sample Sites ............................................................................................... 45<br />
Appendix B – Groundwater <strong>Quality</strong> Data ................................................................................................. 49<br />
Appendix C – Investigation Methods........................................................................................................ 67<br />
Appendix D – Data Evaluation.................................................................................................................. 71<br />
V
Maps<br />
Status <strong>of</strong> GW <strong>Basin</strong>s in the Ambient Monitoring Program ..................................................................................... IV<br />
Map 1. <strong>San</strong> <strong>Simon</strong> GW <strong>Sub</strong>-<strong>Basin</strong> .......................................................................................................................... 3<br />
Map 2. <strong>San</strong> <strong>Simon</strong> GW <strong>Sub</strong>-<strong>Basin</strong> - Rock Types .................................................................................................... 9<br />
Map 3. <strong>San</strong> <strong>Simon</strong> GW <strong>Sub</strong>-<strong>Basin</strong> - Water <strong>Quality</strong> Exceedances ......................................................................... 15<br />
Map 4. <strong>San</strong> <strong>Simon</strong> GW <strong>Sub</strong>-<strong>Basin</strong> - Arsenic and Fluoride.................................................................................... 17<br />
Map 5. <strong>San</strong> <strong>Simon</strong> GW <strong>Sub</strong>-<strong>Basin</strong> - Nitrate and Hardness.................................................................................... 18<br />
Map 6. <strong>San</strong> <strong>Simon</strong> GW <strong>Sub</strong>-<strong>Basin</strong> – Sulfate and TDS ......................................................................................... 20<br />
Map 7. <strong>San</strong> <strong>Simon</strong> GW <strong>Sub</strong>-<strong>Basin</strong> - Groundwater Chemistry .............................................................................. 25<br />
Figures<br />
Figure 1. Dunn Spring .......................................................................................................................................... IX<br />
Figure 2. New Mexico ............................................................................................................................................. 5<br />
Figure 3. Price Spring.............................................................................................................................................. 5<br />
Figure 4. Whitetail Creek......................................................................................................................................... 5<br />
Figure 5. Irrigation well tapping upper aquifer...................................................................................................... 10<br />
Figure 6. Wood Canyon windmill ........................................................................................................................ 10<br />
Figure 7. Pump jack well tapping alluvial aquifer ................................................................................................ 10<br />
Figure 8. Wolf well storage tank ........................................................................................................................... 11<br />
Figure 9. Cross J windmill..................................................................................................................................... 11<br />
Figure 10. <strong>San</strong> <strong>Simon</strong> Cienega ............................................................................................................................. 11<br />
Figure 11. Antelope windmill................................................................................................................................ 14<br />
Figure 12. Irrigation well tapping lower aquifer.................................................................................................... 14<br />
Figure 13. Lower Rustler spring ........................................................................................................................... 14<br />
Figure 14. Piper trilinear diagram ......................................................................................................................... 26<br />
Figure 15. TDS-sodium and fluoride-calcium graphs............................................................................................ 28<br />
Figure 16. TDS-aquifer and gross alpha-geology boxplots ................................................................................... 31<br />
Figure 17. Oxygen 18 –deuterium isotope graph ..................................................................................................... 38<br />
VI
Tables<br />
Table 1. Well log <strong>of</strong> BLM Hot Well Dunes Recreation Area ................................................................................. 8<br />
Table 2. SS sites exceeding health-based water quality standards or Primary MCLs ........................................... 16<br />
Table 3. SS sites exceeding aesthetics-based water quality guidelines or Secondary MCLs................................. 19<br />
Table 4. Classification <strong>of</strong> SS groundwater sample sites for irrigation use............................................................. 21<br />
Table 5. Summary statistics for SS groundwater quality data................................................................................ 22<br />
Table 6. Correlations between groundwater quality constituent concentrations.................................................... 27<br />
Table 7. Variation in constituent concentrations among four SS water bearing units .......................................... 32<br />
Table 8. 95% confidence intervals among four SS water bearing units ................................................................ 33<br />
Table 9. Variation in constituent concentrations among seven SS water bearing units ........................................ 34<br />
Table 10. 95% confidence intervals among seven SS water bearing units ............................................................ 35<br />
Table 11. Variation in constituent concentrations among five SS geologic units ................................................. 36<br />
Table 12. 95% confidence intervals amount five SS geologic units ...................................................................... 37<br />
Table 13. ADHS/Del Mar laboratory methods used in the study........................................................................... 69<br />
Table 14. Summary results <strong>of</strong> SS duplicate samples from ADHS/ARRA laboratories ........................................ 72<br />
Table 15. Summary results <strong>of</strong> SS split samples from ADHS/Del Mar laboratories .............................................. 74<br />
Table 16. Summary results <strong>of</strong> 1997/2002 ADEQ well sampling comparison ....................................................... 75<br />
VII
ABBREVIATIONS<br />
amsl<br />
above mean sea level<br />
af<br />
acre-feet<br />
af/yr<br />
acre-feet per year<br />
ADEQ <strong>Arizona</strong> <strong>Department</strong> <strong>of</strong> <strong>Environmental</strong> <strong>Quality</strong><br />
ADHS <strong>Arizona</strong> <strong>Department</strong> <strong>of</strong> Health Services<br />
ADWR <strong>Arizona</strong> <strong>Department</strong> <strong>of</strong> Water Resources<br />
ARRA <strong>Arizona</strong> Radiation Regulatory Agency<br />
AZGS <strong>Arizona</strong> Geological Survey<br />
As<br />
arsenic<br />
bls<br />
below land surface<br />
BLM<br />
U.S. <strong>Department</strong> <strong>of</strong> the Interior Bureau <strong>of</strong> Land Management<br />
°C degrees Celsius<br />
CI 0.95<br />
95 percent Confidence Interval<br />
Cl<br />
chloride<br />
EPA<br />
U.S. <strong>Environmental</strong> Protection Agency<br />
F<br />
fluoride<br />
Fe<br />
iron<br />
gpm<br />
gallons per minute<br />
GWPL Groundwater Protection List pesticide<br />
HCl<br />
hydrochloric acid<br />
LLD<br />
Lower Limit <strong>of</strong> Detection<br />
Mn<br />
manganese<br />
MCL<br />
Maximum Contaminant Level<br />
ml<br />
milliliter<br />
msl<br />
mean sea level<br />
μg/L<br />
micrograms per liter<br />
μm<br />
micron<br />
μS/cm microsiemens per centimeter at 25° Celsius<br />
mg/L<br />
milligrams per liter<br />
MRL<br />
Minimum Reporting Level<br />
MTBE Methyl tertiary-Butyl Ether<br />
ns<br />
not significant<br />
ntu<br />
nephelometric turbidity unit<br />
pCi/L picocuries per liter<br />
QA<br />
<strong>Quality</strong> Assurance<br />
QAPP <strong>Quality</strong> Assurance Project Plan<br />
QC<br />
<strong>Quality</strong> Control<br />
SAF<br />
Safford Groundwater <strong>Basin</strong><br />
SAR<br />
Sodium Adsorption Ratio<br />
SDW Safe Drinking Water<br />
SC<br />
Specific Conductivity<br />
SS<br />
<strong>San</strong> <strong>Simon</strong> sub-basin<br />
su<br />
standard pH units<br />
SO4<br />
sulfate<br />
TDS<br />
Total Dissolved Solids<br />
TKN<br />
Total Kjeldahl Nitrogen<br />
USGS U.S. Geological Survey<br />
VOC<br />
Volatile Organic Compound<br />
VIII
“One August night in the early 1890's, a hobo was put <strong>of</strong>f a train at Stein Pass near the boundary <strong>of</strong> <strong>Arizona</strong> and New Mexico.<br />
Across the <strong>San</strong> <strong>Simon</strong> Valley to the west a bright light could be seen. The hobo took it to be a light at some ranch house not<br />
many miles away and struck out for it. In reality the light was a campfire at Dunn Spring where a party <strong>of</strong> cattlemen were<br />
working and had camped for the night. It is nearly twenty miles from Stein Pass station to Dunn Spring.<br />
The man had no water, and the night was warm, so he soon began to suffer from thirst. In time the light went out as the campfire<br />
burned low, but the fellow kept the same general direction, drifting a little to the southward. There is no torture like that <strong>of</strong> thirst.<br />
I know something <strong>of</strong> it myself and have brought in men with tongues so swollen that they could not talk, and in one case a man<br />
who was unconscious. The hobo evidently suffered the tortures <strong>of</strong> the damned in that twenty miles. Just before daylight he<br />
staggered into the mouth <strong>of</strong> Brushy Canyon on the east slope <strong>of</strong> the Chiricahua Mountains, a couple <strong>of</strong> miles from<br />
Dunn Spring.<br />
Here was running water, and his life was saved for the present.”<br />
John A. Rockfellow in Log Of An <strong>Arizona</strong> Trail Blazer 30<br />
Figure 1. Situated at the base <strong>of</strong> the Chiricahua<br />
Mountains, Dunn Spring is denoted in the arid<br />
landscape by thick riparian vegetation. Access to<br />
Dunn Spring is through a tunnel dug into the hillside.<br />
IX
Ambient Groundwater <strong>Quality</strong> <strong>of</strong> the <strong>San</strong> <strong>Simon</strong> <strong>Sub</strong>-<strong>Basin</strong>: A 2002 Baseline Study<br />
By Douglas Towne<br />
Abstract - The <strong>San</strong> <strong>Simon</strong> sub-basin (SS) <strong>of</strong> the Safford basin is located in southeastern <strong>Arizona</strong>. The basin is<br />
sparsely populated and consists <strong>of</strong> mainly <strong>of</strong> federal and State rangeland with irrigated farmland near the towns <strong>of</strong><br />
Bowie and <strong>San</strong> <strong>Simon</strong>. The SS is drained by the ephemeral <strong>San</strong> <strong>Simon</strong> River whose headwaters are the now-dry <strong>San</strong><br />
<strong>Simon</strong> Cienega. After heavy precipitation, the river flows north out <strong>of</strong> the SS and debouches into the Gila River<br />
near Solomon. For the purposes <strong>of</strong> this water quality report, based on water chemistry patterns, groundwater is<br />
divided into four generalized, water-bearing units: the alluvial aquifer, upper aquifer, lower aquifer, and mountain<br />
bedrock. The unconfined alluvial aquifer occurs south <strong>of</strong> the cienega and is differentiated from connected alluvial<br />
areas to the north in this report because <strong>of</strong> its superior groundwater quality. North <strong>of</strong> the cienega are the upper and<br />
lower aquifers. Various blue-clay units separate the groundwater perched in the upper aquifer from percolating to<br />
the lower aquifer, which occurs under either water table or artesian conditions. Where sufficiently fractured and<br />
faulted, mountain bedrock also provides limited supplies. Recent studies have indicated that groundwater occurs in<br />
a more complex system than outlined here, but some simplification is needed for regional water quality analysis.<br />
A baseline groundwater quality study <strong>of</strong> the SS was conducted by the <strong>Arizona</strong> <strong>Department</strong> <strong>of</strong> <strong>Environmental</strong> <strong>Quality</strong><br />
that consisted <strong>of</strong> 62 sites sampled in 2002 and an additional 17 sites sampled in 1997. Overall, 77 groundwater sites<br />
were sampled for inorganic constituents. Samples were also collected at selected sites for isotopes <strong>of</strong> oxygen and<br />
hydrogen (62 sites), radon (33 sites), radiochemistry (23 sites), and pesticide (4 sites) analyses.<br />
Of the 77 sites sampled, 28 met all federal and State water quality standards. At 25 sites, concentrations <strong>of</strong> at least<br />
one constituent exceeded a health-based, federal or State water-quality standard. These enforceable standards define<br />
the maximum concentrations <strong>of</strong> constituents allowed in water supplied to the public and are based on a lifetime daily<br />
consumption <strong>of</strong> two liters per person. 34 Health-based exceedances included arsenic (2 sites under current standards,<br />
17 sites under standards effective in 2006), beryllium (2 sites), fluoride (19 sites), nitrate (3 sites), gross alpha (3<br />
sites) and uranium (1 site). At 49 sites, concentrations <strong>of</strong> at least one constituent exceeded an aesthetics-based,<br />
federal water-quality guideline. These are unenforceable guidelines that define the maximum concentration <strong>of</strong> a<br />
constituent that can be present in drinking water without an unpleasant taste, color, odor, or other aesthetic effect. 34<br />
Aesthetics-based exceedances included chloride (6 sites), fluoride (35 sites), iron (5 sites), manganese (3 sites), pH<br />
(7 sites), sulfate (18 sites), and total dissolved solids or TDS (34 sites).<br />
Groundwater composition and quality vary considerably in the sub-basin. Generally, groundwater from the alluvial<br />
aquifer and bedrock can be used without treatment for domestic purposes while that obtained from the upper or<br />
alluvial aquifer exceeds health or aesthetic standards. The limited groundwater in the bedrock <strong>of</strong> the Chiricahua, Dos<br />
Cabezas, Peloncillo, and Pinaleno Mountains generally meets health-based standards except for gross alpha in the<br />
granite rock <strong>of</strong> the western Dos Cabezas and Pinalenos. Though variable, groundwater chemistry is most commonly<br />
calcium-bicarbonate which is associated with recharge areas. 28 Concentrations <strong>of</strong> sodium, potassium, chloride,<br />
sulfate, fluoride, boron, and arsenic are lower in bedrock than in the upper or lower aquifer (ANOVA test in<br />
conjunction with Tukey test, p ≤ 0.05). Groundwater in the alluvial aquifer also meets health-based standards<br />
except for fluoride at one site. The alluvial aquifer is the most uniform with most sites having a calciumbicarbonate<br />
chemistry. Concentrations <strong>of</strong> TDS, sodium, chloride, sulfate, boron, and arsenic are lower in the<br />
alluvial aquifer than in the upper or lower aquifer (ANOVA test in conjunction with Tukey test, p ≤ 0.05). There<br />
are few significant water quality differences between sites in the alluvial aquifer and bedrock.<br />
Groundwater in the lower aquifer rarely met health-based standards because <strong>of</strong> elevated fluoride and arsenic<br />
concentrations. The high fluoride concentrations are permitted by very low calcium concentrations which result<br />
from a chemically closed system. 28 This closed system also results in a sodium-bicarbonate or sulfate groundwater<br />
chemistry. Aesthetics-based standards such as TDS, sulfate, and pH were also frequently exceeded. The most<br />
depleted or isotopically lightest waters, which may represent the oldest water in the SS, are generally associated with<br />
lower aquifer sites. Groundwater in the upper aquifer <strong>of</strong>ten did not meet health-based standards because <strong>of</strong> elevated<br />
fluoride or nitrate concentrations. Aesthetics-based standards for TDS and sulfate were also frequently exceeded.<br />
The least uniform geochemically, upper aquifer sites sometimes reflect major impacts from saline irrigation<br />
recharge and/or leakage from the lower aquifer. Concentrations <strong>of</strong> calcium, magnesium, hardness, and nitrate were<br />
higher in the upper aquifer than in the lower aquifer (ANOVA test in conjunction with Tukey test, p ≤ 0.05).<br />
1
INTRODUCTION<br />
Purpose and Scope<br />
The <strong>San</strong> <strong>Simon</strong> (SS) sub-basin<br />
Interstate 10 in southeastern<br />
<strong>of</strong> the sub-basin lies in Graham<br />
in <strong>Arizona</strong>, but a small part <strong>of</strong><br />
New Mexico that was not sampled<br />
study. The north-south trending<br />
ephemeral <strong>San</strong> <strong>Simon</strong> River<br />
arbitrarily defined sub-basins<br />
Safford groundwater basin. The<br />
includes (in down gradient order)<br />
<strong>San</strong> Carlos Valley sub-basins.<br />
primary source for municipal,<br />
and stock water uses in the SS.<br />
The <strong>Arizona</strong> <strong>Department</strong> <strong>of</strong><br />
(ADEQ) Groundwater Monitoring<br />
study to characterize the current<br />
quality conditions in the SS.<br />
was completed as part <strong>of</strong> the<br />
Monitoring Program, which<br />
legislative mandate in the <strong>Arizona</strong><br />
§49-225 that authorizes:<br />
“...ongoing monitoring <strong>of</strong> waters<br />
including...aquifers to detect<br />
existing pollutants, determine<br />
applicable water quality standards,<br />
effectiveness <strong>of</strong> best management<br />
the effects <strong>of</strong> pollutants on public<br />
environment, and determine<br />
An important resource in <strong>Arizona</strong>,<br />
provides base flow for rivers,<br />
shortages, and protects against<br />
ADEQ ambient groundwater<br />
examined the regional groundwater<br />
• Provide a comprehensive<br />
will help guide the<br />
affecting the Gila River<br />
• Determine if there are<br />
groundwater does not<br />
<strong>Environmental</strong> Protection<br />
Safe Drinking Water<br />
quality standards. 34 •<br />
ADEQ<br />
groundwater<br />
numbers<br />
inorganic<br />
ions, nutrients,<br />
hydrogen<br />
sites),<br />
addition,<br />
isotope<br />
town<br />
Benefits<br />
produce<br />
sampling<br />
investigate<br />
report’s<br />
provide<br />
•<br />
•<br />
•<br />
Examine water quality differences among<br />
the various water bearing units.<br />
collected samples from 77 sites for this<br />
quality assessment <strong>of</strong> the SS. Types and<br />
<strong>of</strong> samples collected and analyzed include<br />
constituents (physical parameters, major<br />
and trace elements) (77 sites), oxygen<br />
isotopes (62 sites), radiochemistry (33<br />
radon (23 sites), and pesticides (4 sites). In<br />
a surface water oxygen and hydrogen<br />
sample was collected from Cave Creek near<br />
<strong>of</strong> Portal.<br />
<strong>of</strong> Study – The purpose <strong>of</strong> this study was to<br />
a scientific report utilizing accepted<br />
techniques and quantitative data analysis to<br />
groundwater quality in the SS. The<br />
conclusion concerning groundwater quality<br />
the following:<br />
A general characterization <strong>of</strong> regional<br />
groundwater quality. Testing all private<br />
wells for a wide variety <strong>of</strong> groundwater<br />
quality concerns would be prohibitively<br />
expensive. An affordable alternative is this<br />
type <strong>of</strong> statistically-based groundwater study<br />
characterizing regional groundwater quality<br />
conditions and identifying areas with<br />
impaired groundwater conditions.<br />
The water quality <strong>of</strong> private wells is seldom<br />
tested for a wide variety <strong>of</strong> possible<br />
pollutants. <strong>Arizona</strong> statutes only require well<br />
drilling contractors to disinfect for potential<br />
bacteria contamination in new wells which<br />
are used for human consumption. 2 Wells are<br />
typically not tested for other groundwater<br />
quality concerns. Thus, contamination<br />
affecting groundwater pumped from private<br />
wells may go undetected for years and have<br />
adverse health effects on users <strong>of</strong> this<br />
resource.<br />
A process for evaluating potential<br />
groundwater quality impacts arising from a<br />
variety <strong>of</strong> sources including mineralization,<br />
mining, agriculture, livestock, septic tanks,<br />
and poor well construction.<br />
is traversed by<br />
<strong>Arizona</strong> (Map 1). Most<br />
and Cochise counties<br />
it is in Grant County,<br />
as part <strong>of</strong> this<br />
basin is drained by<br />
and is one <strong>of</strong> three<br />
which compose the<br />
Safford basin also<br />
and<br />
the<br />
the Gila Valley and<br />
Groundwater is the<br />
domestic, irrigation,<br />
<strong>Environmental</strong> <strong>Quality</strong><br />
Unit designed a will<br />
(2002) groundwater<br />
Sampling by ADEQ<br />
Ambient Groundwater<br />
is based on the<br />
Revised Statutes<br />
<strong>of</strong> the state,<br />
the presence <strong>of</strong> new and<br />
compliance with<br />
determine the<br />
practices, evaluate<br />
health or the<br />
water quality trends.” 2<br />
groundwater<br />
a buffer against water<br />
land subsidence. The<br />
monitoring program<br />
quality <strong>of</strong> SS to:<br />
baseline study that<br />
multi-state issues<br />
watershed.<br />
areas where<br />
currently meet U.S.<br />
Agency (EPA)<br />
Act (SDWA) water<br />
• Considerations for identifying future<br />
locations <strong>of</strong> public supply wells.<br />
2
Physical and Cultural Characteristics<br />
Geography - The SS is located within the Chihuahua<br />
Desert section <strong>of</strong> the <strong>Basin</strong> and Range physiographic<br />
province which consists <strong>of</strong> northwest-trending<br />
alluvial basins separated by elongated fault-block<br />
mountains ranges. The SS consists <strong>of</strong> approximately<br />
1,930 square miles which includes a portion <strong>of</strong> the<br />
sub-basin that lies within New Mexico. 6 The subbasin<br />
is bounded to the east by the Peloncillo<br />
Mountains and, for political reasons, the New Mexico<br />
state line. To the west, its boundaries are formed by<br />
the Chiricahua, Dos Cabezas, and the extreme<br />
southern part <strong>of</strong> the Pinaleno Mountains (Figure 2).<br />
These mountains on the west side <strong>of</strong> the basin are<br />
much broader and higher than those on the east side,<br />
with Chiricahua Peak the highest point at 9,795 feet<br />
above mean sea level.<br />
To the south, the SS is arbitrarily separated from the<br />
<strong>San</strong> Bernardino groundwater basin by a low,<br />
inconspicuous surface water divide extending from<br />
the mouth <strong>of</strong> Texas Canyon at the foot <strong>of</strong> the<br />
Chiricahua Mountains eastward to the Peloncillo<br />
Mountains three miles south <strong>of</strong> Skeleton Canyon. To<br />
the north, the SS is divided from the Gila Valley subbasin<br />
by another arbitrary boundary that runs along a<br />
ridge line near the railroad siding <strong>of</strong> Tanque. 6<br />
The valley occupies a deep half-graben bounded by<br />
northwest-trending faults on the west side which are<br />
concealed beneath broad alluvial fans that merge to<br />
form bajadas. 9 The valley has the appearance <strong>of</strong> a<br />
nearly level plain with upward-curving edges. 31 The<br />
elevation <strong>of</strong> the <strong>San</strong> <strong>Simon</strong> Valley in the sub-basin<br />
varies from approximately 4,700 feet at the southern<br />
boundary to approximately 3,500 feet where the <strong>San</strong><br />
<strong>Simon</strong> River enters the Gila Valley sub-basin.<br />
The <strong>Arizona</strong>-portion <strong>of</strong> the SS is located in Cochise<br />
and Graham Counties. Land ownership divided<br />
among the U.S. Bureau <strong>of</strong> Land Management (36<br />
percent), State Trust (27 percent), U.S. Forest Service<br />
(23 percent), and private entities (20 percent),<br />
National Historic Sites (1 percent), and National<br />
Monuments (1 percent). 3<br />
Climate - The climate <strong>of</strong> the SS is typically semiarid,<br />
characterized by hot summers and mild winters.<br />
Precipitation averages varies from about 10 inches in<br />
the valley up to 28 inches in the surrounding<br />
mountains. 36 42 Most rainfall occurs during two<br />
periods: gentle storms <strong>of</strong> long-duration during the<br />
winter and intense, short-duration monsoon storms<br />
during July and August.<br />
Vegetation - Vegetation varies with precipitation and<br />
elevation. Low precipitation zones in valley areas are<br />
characterized by desert shrubs and grasses that are<br />
replaced by grasses, chaparral, and oak in<br />
intermediate zones. Higher precipitation zones<br />
feature pinyon-juniper forests with ponderosa pine<br />
only at the sub-basin’s highest elevations. Generally<br />
among the various ranges, the Chiricahua Mountains<br />
are lush and timbered while the Dos Cabezas and<br />
Peloncillo Mountains are relatively bare <strong>of</strong><br />
vegetation. 36<br />
Surface Water - Almost all stream flow in the SS is<br />
ephemeral and is generated in the mountains in<br />
response to summer and winter storms. 6 Surface flow<br />
rarely reaches the central parts <strong>of</strong> the valley because<br />
<strong>of</strong> evapotranspiration and infiltration on the upper<br />
and middle portion <strong>of</strong> alluvial fans. These areas<br />
provide most <strong>of</strong> the groundwater recharge in the subbasin.<br />
6 The only perennial surface flows occur in the<br />
Chiricahua Mountains and consist <strong>of</strong> short stream<br />
stretches in Cave Creek located above the town <strong>of</strong><br />
Portal and in Price Canyon (Figure 3). 6 In general,<br />
large watercourses head in the Chiricahua Mountains<br />
in contrast to the more arid Dos Cabezas and<br />
Peloncillo Moutains. 31<br />
The majority <strong>of</strong> the basin is drained by <strong>San</strong> <strong>Simon</strong><br />
River, an ephemeral watercourse. South <strong>of</strong> the town<br />
<strong>of</strong> Rodeo, New Mexico, the valley is drained through<br />
a broad shallow draw, fed by numerous creeks and<br />
washes (Figure 4) until emptying into the <strong>San</strong> <strong>Simon</strong><br />
Cienega north <strong>of</strong> Rodeo. 6 Formerly, groundwater<br />
surfaced along a 5 mile long 1,600 acre marsh. 15 The<br />
<strong>San</strong> <strong>Simon</strong> River headwaters are at the end <strong>of</strong> the<br />
cienega. The river, usually a narrow channel with<br />
high vertical banks, follows the axis <strong>of</strong> the valley<br />
northwest out <strong>of</strong> the sub-basin until debouching into<br />
the Gila River near the farming community <strong>of</strong><br />
Soloman. Perennial flow in the <strong>San</strong> <strong>Simon</strong> River last<br />
occurred after World War I when depressed<br />
economic conditions caused the abandonment <strong>of</strong><br />
many farms. The uncapped irrigation wells<br />
continued their artesian flows with the groundwater<br />
eventually making it to the <strong>San</strong> <strong>Simon</strong> River. 6<br />
History - Historical accounts <strong>of</strong> 18 th century travelers<br />
described the river as having perennial flow and<br />
containing numerous springs and marshes with the<br />
especially large <strong>San</strong> <strong>Simon</strong> Cienega located near the<br />
<strong>Arizona</strong>-New Mexico state border. 6 Colonel Phil<br />
Cooke in 1848 described the river as running bank<br />
full in the center <strong>of</strong> a lush valley. 36<br />
4
Figure 2. The <strong>San</strong> <strong>Simon</strong> sub-basin extends into<br />
New Mexico. The Land <strong>of</strong> Enchantment’s state<br />
flower is the soaptree yucca with the Chiricahua<br />
Mountains. The ivory-colored, bell-shaped blossoms<br />
are sometimes called, “Our Lord’s Candles.”<br />
Figure 3. Jason Mahalic, a chemist with the <strong>Arizona</strong><br />
<strong>Department</strong> <strong>of</strong> Health Services, collects a sample<br />
from Price Spring. The spring forms a short<br />
perennial stretch in Price Canyon in the southern<br />
Chiricahua Mountains. In the foreground are older<br />
steel and more recent black diversion pipe.<br />
Figure 4. Normally dry<br />
watercourses heading in the<br />
Chiricahua Mountains are<br />
capable <strong>of</strong> discharging large<br />
amounts <strong>of</strong> water to the <strong>San</strong><br />
<strong>Simon</strong> Valley. A summer<br />
thunderstorm created enough<br />
surface flow to make the <strong>San</strong><br />
<strong>Simon</strong>-Paradise Road pictured<br />
here impassable for several<br />
hours.<br />
5
Overgrazing in the late 1800s caused denudation <strong>of</strong><br />
the <strong>San</strong> <strong>Simon</strong> Valley’s forage. European settlement<br />
within the SS began in the late 1870s when ranchers<br />
migrating west out <strong>of</strong> Texas brought large herds <strong>of</strong><br />
cattle to the <strong>San</strong> <strong>Simon</strong> Valley. By 1895, over<br />
50,000 cattle grazed in the area rapidly depleting the<br />
forage. 36 Erosion was exacerbated by two periods <strong>of</strong><br />
severe drought (1903 through 1905 and 1914 through<br />
1915) followed by heavy rains. 25 Severe head cutting<br />
led to the formation <strong>of</strong> gullies that quickly moved up<br />
the valley with each major flood. 25 By 1934, the U.S.<br />
Soil Conservation Service found extreme erosion and<br />
almost a total loss <strong>of</strong> the once-rich grasslands. 36<br />
Also during the late 1800s, settlers near the town <strong>of</strong><br />
Soloman dug a small channel and funneling levees<br />
near the mouth <strong>of</strong> the <strong>San</strong> <strong>Simon</strong> River to facilitate<br />
flow into the Gila River. This resulted in<br />
channelization by the <strong>San</strong> <strong>Simon</strong> River, which cut<br />
deeply into the formerly shallow river bed, creating a<br />
channel as much as 800 feet wide and 10 to 30 feet<br />
deep for about 60 miles upstream. 32 Tremendous<br />
erosion occurring along the <strong>San</strong> <strong>Simon</strong> River. In the<br />
<strong>San</strong> Carlos Reservoir located down gradient on the<br />
Gila River, the Bureau <strong>of</strong> Land Management<br />
estimated that approximately 30 percent <strong>of</strong> its silt<br />
originated from the <strong>San</strong> <strong>Simon</strong> River, even though<br />
only three percent <strong>of</strong> the reservoir’s water came from<br />
this river. 32<br />
By the 1940s, the <strong>San</strong> <strong>Simon</strong> watershed was<br />
recognized as one <strong>of</strong> the most degraded watersheds in<br />
the United States. 25 The cutting and deepening <strong>of</strong> the<br />
stream channel and its major tributaries resulted<br />
in the lowering <strong>of</strong> the water table which caused<br />
perennial vegetation to die <strong>of</strong>f. This led to the<br />
eventual loss <strong>of</strong> soil cover. 25 Sheet erosion occurred<br />
throughout the area and the watershed was invaded<br />
by many undesirable plant species. 25 In an attempt to<br />
restore the <strong>San</strong> <strong>Simon</strong> Valley’s former lush<br />
grasslands, various agencies <strong>of</strong> the federal<br />
government have constructed an extensive system <strong>of</strong><br />
earthen dikes, wing dams, and rock-walled barriers<br />
throughout the valley. Restoration projects have<br />
improved some areas making them more attractive to<br />
wildlife. 32<br />
Early settlers developed groundwater for domestic<br />
and stock purposes using shallow wells. 6 Irrigation<br />
was not attempted until artesian groundwater flow<br />
was discovered near <strong>San</strong> <strong>Simon</strong> in a deep well drilled<br />
in 1910 for the Southern Pacific Railroad. 6 Artesian<br />
flow encouraged settlement in valley areas, initially<br />
around the town <strong>of</strong> <strong>San</strong> <strong>Simon</strong> and later near the<br />
town <strong>of</strong> Bowie, and by 1915, there were 127 flowing<br />
wells. 15 Farming in the sub-basin has gone through<br />
many boom-bust cycles. In 1989, 18,000 acres were<br />
irrigated in the <strong>San</strong> <strong>Simon</strong> Valley (Figure 5). 6<br />
HYDROLOGY<br />
Geology<br />
The <strong>San</strong> <strong>Simon</strong> Valley sub-basin is a large, structural<br />
trough formed by uplift <strong>of</strong> the mountain blocks<br />
relative to the blocks underlying the basin. 6 The<br />
resulting mountains (Map 2) are composed <strong>of</strong> granite,<br />
metamorphic, sedimentary, and volcanics. 6 Erosion<br />
from these mountains gradually filled the valley with<br />
alluvium which, in generalized terms, is classified as<br />
older and younger alluvial fill. 6 Depth to bedrock<br />
typically runs from 4,000 to 6,400 feet bls though<br />
near the town <strong>of</strong> <strong>San</strong> <strong>Simon</strong>, it increases to at least<br />
9,600 feet bls. 44<br />
The resulting alluvium has been classified as older<br />
and younger alluvial fill. 6 The older alluvial fill<br />
makes up the majority <strong>of</strong> sediments which are<br />
composed <strong>of</strong> interfingering beds and lenses <strong>of</strong> clay,<br />
silt, sand, and gravel. 15 The vast majority <strong>of</strong><br />
groundwater within the sub-basin is contained within<br />
the older alluvial fill. In contrast, the younger<br />
alluvial fill consists <strong>of</strong> unconsolidated silt, sand, and<br />
gravel deposited along current stream channels. 6<br />
These deposits are very limited in area and thickness<br />
and not important as water-bearing strata. 6<br />
Aquifers<br />
Early hydrology reports divided the basin fill, which<br />
was then thought to be no more than 1,200 feet thick,<br />
into three major, though over generalized units. 31<br />
These units, from deepest to shallowest are termed<br />
the lower aquifer, the blue-clay unit, and the upper<br />
aquifer.<br />
The lower aquifer overlies bedrock and is the source<br />
<strong>of</strong> most <strong>of</strong> the groundwater used in the SS and may<br />
be present under either artesian or water-table<br />
conditions. 6 Artesian pressure has dramatically<br />
declined since first measured in 1913 when eight<br />
wells had an average head <strong>of</strong> 31 feet above land<br />
surface (als). 31 By 1915, 127 artesian wells had been<br />
developed and the same eight wells averaged 19 feet<br />
als. 31 By 1952, nearly all the wells had to be<br />
pumped at least part <strong>of</strong> the time for irrigation<br />
purposes (Figure 8). 39 There are currently no flowing<br />
wells providing water for irrigation purposes. 6<br />
Recent hydrological research has revealed that there<br />
are numerous aquifers, usually artesian, in the basinfill<br />
rather than the singular lower aquifer originally<br />
6
thought. 44 An excellent example <strong>of</strong> the hydrologic<br />
complexity <strong>of</strong> the SS is the well log for the 1,837 foot<br />
BLM Hot Well that was sampled twice during the<br />
course <strong>of</strong> this study (Table 1). The log reveals the<br />
drillers encountered numerous aquifers and<br />
aquicludes. However, for broad water quality<br />
comparison purposes in this study, these various<br />
aquifers will be grouped together and termed the<br />
lower aquifer.<br />
Early hydrology studies also talked about the<br />
presence <strong>of</strong> a middle unit, commonly called the blueclay<br />
unit. 31 The blue-clay unit was thought to act as a<br />
confining layer between the lower and upper units. 6 It<br />
is a lacustrine deposit that was deposited when a<br />
body <strong>of</strong> water without exterior drainage, occupied<br />
most <strong>of</strong> the <strong>San</strong> <strong>Simon</strong> Valley. 39 This middle unit<br />
was thought to reach a maximum thickness <strong>of</strong> 600<br />
feet near the town <strong>of</strong> <strong>San</strong> <strong>Simon</strong> and is encountered<br />
from 60 to 200 feet below the surface, pinching out<br />
around the margins <strong>of</strong> the basin. 15<br />
More recent hydrological research has revealed that<br />
the SS is much older than previously thought, that the<br />
basin was internally drained for a much longer period<br />
than previously known, and that many thick and<br />
extensive evaporate deposits have been delineated. 44<br />
The BLM Hot Well log (Table 1) reveal that many<br />
aquicludes are present in the stratigraphy that<br />
includes several blue-clay units as well as other clay<br />
layers <strong>of</strong> other types.<br />
Early hydrology studies also talked about the upper<br />
aquifer occurring in the upper unit <strong>of</strong> the older<br />
alluvial fill. The middle or blue-clay unit separates<br />
the groundwater perched in the upper aquifer from<br />
percolating downward to the lower aquifer except<br />
around the basin margins where it rests directly on<br />
the lower unit. 39<br />
Groundwater in the upper aquifer was historically<br />
used mainly for domestic or stock uses. 6 As the<br />
artesian pressure began to decline in the lower<br />
aquifer and the turbine pump efficiencies improved,<br />
groundwater in the upper aquifer was increasingly<br />
used for irrigation purposes in the <strong>San</strong> <strong>Simon</strong> and<br />
Bowie areas. 6 In areas south <strong>of</strong> the <strong>San</strong> <strong>Simon</strong><br />
Cienega (Figure 10), the chief water-bearing<br />
formations are younger stream deposits that consist<br />
largely <strong>of</strong> coarse gravels. 31<br />
Based on the dramatic water quality differences<br />
between the southern and northern portions <strong>of</strong> the<br />
upper aquifer, it has been subdivided for the purposes<br />
<strong>of</strong> this report into a northern portion, termed the<br />
upper aquifer and a southern portion, termed the<br />
alluvial aquifer. The arbitrary divide between the<br />
two aquifers is near the <strong>San</strong> <strong>Simon</strong> Cienega.<br />
Although there isn’t a geological boundary nor is<br />
there any aquifer material difference between the two<br />
aquifers, the dramatic water chemistry differences<br />
between the two areas necessitates this division for<br />
purposes <strong>of</strong> water quality comparisons. Groundwater<br />
in one <strong>of</strong> the aquifers can be used for domestic,<br />
municipal, and irrigation purposes; in contrast,<br />
groundwater in the other aquifer has severe use<br />
limitations. Groundwater is readily available in the<br />
alluvial aquifer from the cienega south to the<br />
settlement <strong>of</strong> Apache. In contrast, sub-basin areas<br />
south <strong>of</strong> Apache have limited supplies <strong>of</strong><br />
groundwater (Figure 7). 31<br />
Groundwater Recharge and Discharge<br />
The major source <strong>of</strong> groundwater recharge to the<br />
lower aquifer is infiltration <strong>of</strong> mountain front run<strong>of</strong>f<br />
though leakage from the upper aquifer through<br />
corroded well casing may occur in some areas. 6 In<br />
contrast, the upper aquifer receives recharge from<br />
mountain front run<strong>of</strong>f as well as from seepage from<br />
irrigation applications, stream flow infiltration, and<br />
leakage from the lower aquifer from corroded well<br />
casings in some areas. 15 Initially, water from the<br />
lower aquifer flowed into the upper aquifer. 31 With<br />
the lowering <strong>of</strong> artesian pressure, the upper aquifer<br />
now discharges into the lower aquifer.<br />
Groundwater pumping is the major source <strong>of</strong><br />
discharge in the SS with an estimated 3 million acrefeet<br />
discharged since 1915. 6 The peak pumping year<br />
(143,000 acre-feet) was 1980. By 1987, only 47,000<br />
acre-feet was withdrawn (Figure 9). Natural<br />
groundwater flow is a minor source <strong>of</strong> discharge in<br />
the SS. Although 6,000 acre-feet <strong>of</strong> groundwater was<br />
discharged annually to the downgradient Gila Valley<br />
sub-basin, this amount is currently much less as<br />
groundwater pumping has flattened, and even<br />
reversed, this gradient. 6 The outflow southward<br />
across the surface water boundary into the <strong>San</strong><br />
Bernardino Valley basin has not been quantified.<br />
Unregulated artesian flow and evapotranspiration<br />
from the <strong>San</strong> <strong>Simon</strong> Cienega, once major sources <strong>of</strong><br />
discharge from the sub-basin, are now negligible<br />
factors (Figure 10). 6<br />
7
Table 1. Well log for BLM Hot Well Dunes Recreation Area<br />
Drill Depth <strong>Sub</strong>strate Comments<br />
0– 40 <strong>San</strong>d<br />
40 – 120 <strong>San</strong>d and shale<br />
120 – 135 <strong>San</strong>d, shale, and water Aquifer<br />
135 – 155 Brown and blue shale Aquitard<br />
155 – 165 Blue shale Aquitard<br />
165 – 180 <strong>San</strong>d and water Aquifer<br />
180 – 205 Brown and blue shale Aquitard<br />
205 – 215 Water and sand Aquifer<br />
215 – 230 Brown and blue shale Aquitard<br />
230 – 240 Water and sand Aquifer<br />
240 – 416 Gray shale Aquiclude<br />
416 – 640 Brown and light shale Aquiclude<br />
640 – 650 <strong>San</strong>dy shale and salt water Salt water aquifer<br />
650 – 740 Brown shale Aquiclude<br />
740 – 1015 Blue shale Aquiclude<br />
1015 – 1022 <strong>San</strong>d and salt water Salt water aquifer<br />
1022 – 1045 Brown shale Aquiclude<br />
1045 – 1078 Brown sandy shale Aquiclude<br />
1078 – 1094 Slight sandy shale Aquiclude<br />
1094 – 1096 Shells gypsum Evaporate layer<br />
1096 – 1104 Brown shale Aquiclude<br />
1104 – 1115 Light gypsum shale Evaporate<br />
1115 – 1125 <strong>San</strong>d and water Aquifer<br />
1125 – 1165 Brown shale<br />
1165 – 1185 <strong>San</strong>d and water Aquifer<br />
1185 – 1197 Brown shale<br />
1197 – 1208 <strong>San</strong>d and salt water Salt water aquifer<br />
1208 – 1212 Blue shale<br />
1212 – 1260 <strong>San</strong>d, gravel and salt water Salt water aquifer<br />
1260 – 1274 Brown and green shale<br />
1274 – 1284 <strong>San</strong>d and salt water Salt water aquifer<br />
1284 – 1323 Brown sandy shale<br />
1323 – 1328 Red clay (hot)<br />
1328 – 1350 Brown sandy shale<br />
1350 – 1352 <strong>San</strong>d and salt water Salt water aquifer<br />
1352 – 1363 Brown shale<br />
1363 – 1364 Coarse gravel and water Artesian aquifer<br />
1364 – 1369 Fine sand and water Aquifer<br />
1369 – 1405 Coarse sand and water Aquifer<br />
1405 – 1837 Conglomerate, sand, gravel, shells<br />
lime, sandstone, etc<br />
No water discovered<br />
8
Figure 5. Jason Mahalic samples an irrigation well<br />
powered by a turbine pump south <strong>of</strong> the town <strong>of</strong> <strong>San</strong><br />
<strong>Simon</strong>. This shallow well taps the upper aquifer and<br />
supplies a healthy cotton crop despite the water’s<br />
“very high salinity” and “high sodium” irrigation<br />
classification. 35<br />
Figure 6. Joe Harmon samples Wood Canyon windmill in<br />
the Pinaleno Mountains. Near an area <strong>of</strong> granite rock,<br />
water from the well exceeded health-based drinking water<br />
standards for gross alpha and uranium. 23<br />
Figure 7. A vintage pump<br />
jack produces water for<br />
livestock use that is stored<br />
in a former underground<br />
storage tank. This 900<br />
foot deep well is the most<br />
southerly (or up gradient)<br />
sample collected in the <strong>San</strong><br />
<strong>Simon</strong> sub-basin.<br />
Groundwater from this well,<br />
like most pumping from the<br />
alluvial aquifer, meets all<br />
health-based water quality<br />
standards.<br />
10
Figure 8. Groundwater from Butte Well empties into<br />
this storage tank for livestock use in the <strong>San</strong> <strong>Simon</strong><br />
Valley. The appropriately named Orange Butte looms in<br />
the background.<br />
Figure 9. Cross J Windmill is located at the northern<br />
base <strong>of</strong> the Chiricahua Mountains. Across the valley, the<br />
Peloncillo Mountains can be seen which provides an idea<br />
<strong>of</strong> the vast expanse <strong>of</strong> the <strong>San</strong> <strong>Simon</strong> sub-basin.<br />
Figure 10. Located on the<br />
border with New Mexico, the<br />
<strong>San</strong> <strong>Simon</strong> Cienega was<br />
once a marsh. Although<br />
now dry, the presence <strong>of</strong><br />
cottonwood trees indicates<br />
shallow groundwater is still<br />
present in the area.<br />
11
Groundwater Movement, Storage and Levels<br />
The direction <strong>of</strong> groundwater movement generally<br />
mirrors surface-water drainage moving from the<br />
surrounding mountain fronts toward the middle <strong>of</strong> the<br />
sub-basin and then down the valley from the south to<br />
the north and northwest. 6 This natural flow direction<br />
is now interrupted by cones <strong>of</strong> depression from<br />
irrigation pumping near Bowie and <strong>San</strong> <strong>Simon</strong>. 6<br />
South <strong>of</strong> Apache, the groundwater flow is to the<br />
south. Prior to development, there was an estimated<br />
25 million acre-feet <strong>of</strong> recoverable groundwater in<br />
the basin-fill material to a depth <strong>of</strong> 1,200 feet below<br />
land surface. 6 Available water level information<br />
indicates that generally declines have occurred in the<br />
lower aquifer throughout the basin during a 25 year<br />
period between 1962 - 1987 with the steepest<br />
declines (up to 211 feet bls) where irrigated farming<br />
is concentrated. 6 Some related land subsidence has<br />
also occurred in the Bowie and <strong>San</strong> <strong>Simon</strong> areas.<br />
Other indications <strong>of</strong> declining groundwater levels are<br />
now dry historic wetlands such as the Whitlock<br />
Cienega. There is generally not enough water level<br />
data for the upper aquifer to assess time trend<br />
changes. 6<br />
GROUNDWATER SAMPLING RESULTS<br />
To characterize the regional groundwater quality <strong>of</strong><br />
the SS, in 2002 ADEQ personnel sampled 64<br />
groundwater sites consisting <strong>of</strong> 58 wells and 6<br />
springs. Fifteen wells previously sampled by ADEQ<br />
in 1997 for a watershed study were also utilized in<br />
this report including two wells that were resampled in<br />
2002 (Figure 11). Thus, this groundwater quality<br />
study is composed <strong>of</strong> water quality results from 77<br />
sites in the <strong>San</strong> <strong>Simon</strong> sub-basin (Map 2).<br />
The 71 wells consisted <strong>of</strong> 29 windmills for livestock<br />
use, 17 irrigation wells with turbine pumps (Figure<br />
12), 23 wells with submersible pumps (14 for<br />
livestock use and 9 for domestic use), and 2 artesian<br />
wells for livestock use. Of the 6 springs, 3 were used<br />
for drinking water purposes and 3 were for stock<br />
and/or wildlife use (Figure 13). Information on<br />
locations and characteristics <strong>of</strong> these groundwater<br />
sample sites is provided in Appendix A.<br />
The following types <strong>of</strong> samples were collected:<br />
• Inorganic samples at 77 sites;<br />
• Hydrogen and oxygen isotope samples at 62<br />
sites;<br />
• Radon samples at 33 sites;<br />
• Radiochemistry samples at 23 sites; and<br />
• Pesticide samples at 4 sites.<br />
Water <strong>Quality</strong> Standards/Guidelines<br />
The ADEQ ambient groundwater monitoring<br />
program characterizes regional groundwater quality.<br />
One <strong>of</strong> the most important determinations ADEQ<br />
makes concerning the collected samples is how the<br />
analytical results compare to various drinking water<br />
quality standards. Three sets <strong>of</strong> drinking water<br />
standards which reflect the best current scientific and<br />
technical judgment available on the suitability <strong>of</strong><br />
water for drinking purposes were used to evaluate the<br />
suitability <strong>of</strong> these groundwater sites for domestic<br />
purposes:<br />
• Federal Safe Drinking Water (SDW)<br />
Primary Maximum Contaminant Levels<br />
(MCLs). These enforceable health-based<br />
standards establish the maximum<br />
concentration <strong>of</strong> a constituent allowed in<br />
water supplied by public systems. 34<br />
• State <strong>of</strong> <strong>Arizona</strong> Aquifer Water-<strong>Quality</strong><br />
Standards apply to aquifers that are<br />
classified for drinking water protected use. 34<br />
All aquifers within <strong>Arizona</strong> are currently<br />
regulated for drinking water use. These<br />
enforceable State standards are almost<br />
identical to the federal Primary MCLs.<br />
• Federal SDW Secondary MCLs. These nonenforceable<br />
aesthetics-based guidelines<br />
define the maximum concentration <strong>of</strong> a<br />
constituent that can be present without<br />
imparting unpleasant taste, color, odor, or<br />
other aesthetic effect on the water. 34<br />
Health-based drinking water quality standards such<br />
as Primary MCLs are based on a lifetime<br />
consumption <strong>of</strong> two liters <strong>of</strong> water per day and, as<br />
such, are chronic not acute standards. 34<br />
Water <strong>Quality</strong> Standard/Guideline Exceedances<br />
Of the 77 sites sampled for the study, only 28 (36<br />
percent) met all SDW Primary and Secondary MCLs.<br />
Health-based Primary MCL water quality standards<br />
and State aquifer water quality standards were<br />
exceeded at 25 <strong>of</strong> 77 sites (33 percent) (Map 3)<br />
(Table 2). Constituents exceeding Primary MCLs<br />
include arsenic (2 sites under current standards, 17<br />
sites under standards which take effect in 2006) (Map<br />
4), beryllium (2 sites) fluoride (19 sites) (Map 4),<br />
gross alpha (3 sites), nitrate (3 sites) (Map 5), and<br />
uranium (1 site). Potential health effects <strong>of</strong> these<br />
12
chronic Primary MCL exceedances are provided in<br />
Table 2.<br />
Aesthetics-based Secondary MCL water quality<br />
guidelines were exceeded at 48 <strong>of</strong> 77 sites (62<br />
percent) (Map 3)(Table 3). Constituents above<br />
Secondary MCLs include: chloride (6 sites), fluoride<br />
(35 sites), iron (5 sites), manganese (3 sites), pH (7<br />
sites), sulfate (18 sites)(Map 6), and TDS (34 sites)<br />
(Map 6). Potential effects <strong>of</strong> these Secondary MCL<br />
exceedances are provided in Table 3.<br />
Radon is a naturally occurring, intermediate<br />
breakdown product from the radioactive decay <strong>of</strong><br />
uranium-238 to lead-206. 12 There are widely<br />
conflicting opinions on the risk assessment <strong>of</strong> radon<br />
in drinking water, with proposed drinking water<br />
standards varying from 300 to 4,000 pCi/L. 12<br />
Twenty-seven (27) <strong>of</strong> the 33 sites sampled for radon<br />
exceeded the 300 pCi/L standard; one exceeded the<br />
4,000 pCi/L standard.<br />
Four sites were samples for Groundwater Protection<br />
List (GWPL) <strong>of</strong> currently-registered pesticides and<br />
Clean Water Act (CWA) 608 List <strong>of</strong> banned<br />
chlorinated pesticides. Analytical results revealed no<br />
detections <strong>of</strong> any pesticides or their products <strong>of</strong><br />
degradation at any site.<br />
Suitability for Irrigation<br />
The suitability <strong>of</strong> groundwater at each sample site<br />
was assessed as to its suitability for irrigation use<br />
based on salinity and sodium hazards. With<br />
increasing salinity, leaching, salt tolerant plants, and<br />
adequate drainage are necessary. Excessive levels <strong>of</strong><br />
sodium are known to cause physical deterioration <strong>of</strong><br />
the soil. 35 Irrigation water may be classified using<br />
specific conductivity (SC) and the Sodium<br />
Adsorption Ratio (SAR) in conjunction with one<br />
another. 35<br />
Groundwater sites in the SS display a wide range <strong>of</strong><br />
irrigation water classifications with salinity hazards<br />
generally greater than sodium hazards. The 77<br />
sample sites are divided into the following salinity<br />
hazards: low or C1 (7), medium or C2 (38), high or<br />
C3 (26), and very high or C4 (6). Likewise, the 77<br />
sample sites are divided into the following sodium or<br />
alkali hazards: low or S1 (55), medium or S2 (8),<br />
high or S3 (5), and very high or S4 (9). Irrigation<br />
water classifications using both salinity and sodium<br />
hazards are found in Table 4.<br />
Analytical Results<br />
Analytical inorganic and radiochemistry results <strong>of</strong> the<br />
77 sample sites are summarized (Table 5) using the<br />
following indices: minimum reporting levels<br />
(MRLs), number <strong>of</strong> sample sites over the MRL,<br />
upper and lower 95 percent confidence intervals<br />
(CI 95% ), and the median and mean. Confidence<br />
intervals are a statistical tool which indicates that 95<br />
percent <strong>of</strong> a constituent’s population lies within the<br />
stated confidence interval. Specific constituent<br />
information for each groundwater site is found in<br />
Appendix B.<br />
13
Figure 11. A 1957 Buick<br />
is permanently parked<br />
in front <strong>of</strong> Antelope<br />
Well, a windmill that<br />
was sampled for this<br />
study both in 1997<br />
and 2002. Based on<br />
results from this<br />
windmill and another<br />
well, sub-basin<br />
groundwater data<br />
from the two studies<br />
were judged able to be<br />
used<br />
interchangeably. 37<br />
Figure 12. A turbine pump produces water from an<br />
800-foot well near Bowie. Jason Mahalic is<br />
collecting a grab sample from the pipe discharging<br />
into the irrigation ditch. Generally groundwater<br />
sites in the Bowie area met health-based water<br />
quality standards.<br />
Figure 13. Extremely fresh groundwater is found atop the<br />
Chiricahua Mountains at Lower Rustler Spring. TDS<br />
concentrations <strong>of</strong> only 60 mg/L were found in this sample<br />
collected by Cheri Horsley.<br />
14
Table 2. SS Sites Exceeding Health-Based Water <strong>Quality</strong> Standards (Primary MCLs)<br />
Constituent<br />
Primary<br />
MCL<br />
Sites Exceeding Concentration Range<br />
Primary MCL <strong>of</strong> Exceedances<br />
Nutrients<br />
Potential Health Effects <strong>of</strong><br />
MCL Exceedances *<br />
Nitrite (NO 2 -N) 1.0 0<br />
Nitrate (NO 3 -N) 10.0 3 18 - 31 Methemoglobinemia<br />
Trace Elements<br />
Antimony (Sb) 0.006 0<br />
Arsenic (As) 0.05<br />
2<br />
0.01** 16<br />
Barium (Ba) 2.0 0<br />
0.053 - 0.060<br />
0.011 - 0.0060<br />
Dermal and nervous system<br />
toxicity<br />
Beryllium (Be) 0.004 2 0.00061 - 0.0019 Bone and lung damage<br />
Cadmium (Cd) 0.005 0<br />
Chromium (Cr) 0.1 0<br />
Copper (Cu) 1.3 0<br />
Fluoride (F) 4.0 19 4.1 - 17 Skeletal damage<br />
Lead (Pb) 0.015 0<br />
Mercury (Hg) 0.002 0<br />
Nickel (Ni) 0.1 0<br />
Selenium (Se) 0.05 0<br />
Thallium (Tl) 0.002 0<br />
Radiochemistry Constituents<br />
Gross Alpha 15 3 16-36 pCi/L Cancer<br />
Ra-226 + Ra-228 5 0<br />
Uranium 30 1 34 μg/L Cancer and kidney toxicity<br />
All units in mg/L except gross alpha and radium-226+228 (pCi/L), and uranium (μg/L).<br />
* Health-based drinking water quality standards such as Primary MCLs are based on a lifetime consumption <strong>of</strong> two liters <strong>of</strong><br />
water per day (USEPA). Therefore, these are considered chronic, not acute, standards.<br />
** Revised arsenic primary MCL scheduled to be implemented in 2006<br />
Source:<br />
34 38<br />
16
Table 3. SS Sites Exceeding Aesthetics-Based Water <strong>Quality</strong> Standards (Secondary MCLs)<br />
Constituents<br />
Secondary<br />
MCL<br />
Sites Exceeding Concentration Range<br />
Secondary MCLs <strong>of</strong> Exceedances<br />
Physical Parameters<br />
Aesthetic Effects <strong>of</strong> MCL<br />
Exceedances<br />
pH - field 6.5 to 8.5 7 8.64 - 9.03 Corrosive water<br />
General Mineral Characteristics<br />
TDS 500 34 530 - 4600 Unpleasant taste<br />
Major Ions<br />
Chloride (Cl) 250 6 280 - 415 Salty taste<br />
Sulfate (SO 4 ) 250 18 270 - 2900 Rotten-egg odor, unpleasant taste,<br />
and laxative effect<br />
Trace Elements<br />
Fluoride (F) 2.0 35 2 - 17 Mottling <strong>of</strong> teeth enamel<br />
Iron (Fe) 0.3 5 0.37 - 4.6 Rusty color, reddish stains, and<br />
metallic tastes<br />
Manganese (Mn) 0.05 3 0.058 - 0.16 Black oxide stains and<br />
bitter, metallic taste<br />
Silver (Ag) 0.1 0<br />
Zinc (Zn) 5.0 0<br />
All units mg/L except pH is in standard units (su).<br />
Source:<br />
20 34 38<br />
19
Table 4. Classification <strong>of</strong> SS Groundwater Sample Sites for Irrigation Use<br />
Sodium Hazard<br />
Very High (S4)<br />
Sodium Hazard<br />
High (S3)<br />
Sodium Hazard<br />
Medium (S2)<br />
Sodium Hazard<br />
Low (S1)<br />
Salinity Hazard<br />
Low (C1)<br />
0<br />
(C1 - S4)<br />
0<br />
(C1 - S3)<br />
0<br />
(C1 - S2)<br />
7<br />
(C1 - S1)<br />
Salinity Hazard<br />
Medium (C2)<br />
0<br />
(C2 - S4)<br />
2<br />
(C2 - S3)<br />
1<br />
(C2 - S2)<br />
35<br />
(C2 - S1)<br />
Salinity Hazard<br />
High (C3)<br />
5<br />
(C3 - S4)<br />
2<br />
(C3 - S3)<br />
6<br />
(C3 - S2)<br />
13<br />
(C3 - S1)<br />
Salinity Hazard<br />
Very High (C4)<br />
4<br />
(C4 - S4)<br />
1<br />
(C4 - S3)<br />
1<br />
(C4 - S2)<br />
0<br />
(C4 - S1)<br />
Low-Salinity Water (C1) - can be used for irrigation with most crops on most soils with little likelihood that soil<br />
salinity will develop. Some leaching is required, but this occurs under normal irrigation practices except in soils <strong>of</strong><br />
extremely low permeability.<br />
Medium-Salinity Water (C2) - can be used if a moderate amount <strong>of</strong> leaching occurs. Plants with moderate salt<br />
tolerance can be grown in most cases without special practices for salinity control.<br />
High-Salinity Water (C3) - cannot be used on soils with restricted drainage. Even with adequate drainage, special<br />
management for salinity control may be required and plants with good salt tolerance should be selected.<br />
Very High-Salinity Water (C4) - is not suitable for irrigation under ordinary conditions, but may be used<br />
occasionally under very special circumstances. The soils must be permeable, drainage must be adequate, irrigation<br />
water must be applied in excess to provide considerable leaching, and very salt-tolerant crops should be selected.<br />
Low-Sodium Water (S1) - can be used for irrigation on almost all soils with little danger <strong>of</strong> the development <strong>of</strong><br />
harmful levels <strong>of</strong> exchangeable sodium. However, sodium-sensitive crops such as stone-fruit trees and avocados<br />
may accumulate injurious concentrations <strong>of</strong> sodium.<br />
Medium-Sodium Water (S2) - will present an appreciable sodium hazard in fine-textured soils having high cationexchange-capacity,<br />
especially under low-leaching conditions, unless gypsum is present in the soil. This water may<br />
be used on coarse-textured or organic soils with good permeability.<br />
High-Sodium Water (S3) - may produce harmful levels <strong>of</strong> exchangeable sodium in most soils and will require<br />
special soil management–good drainage, high leaching, and organic matter additions. Gypsiferous soils may not<br />
develop harmful levels <strong>of</strong> exchangeable sodium, except that amendments may not be feasible with waters <strong>of</strong> very<br />
high salinity.<br />
Very High-Sodium Water (S4) - is generally unsatisfactory for irrigation purposes except at low and perhaps<br />
medium salinity, where the solution <strong>of</strong> calcium from the soil or use <strong>of</strong> gypsum or other amendments may make the<br />
use <strong>of</strong> these waters feasible. 35<br />
21
Table 5. Summary Statistics for SS Groundwater <strong>Quality</strong> Data<br />
Constituent<br />
Minimum<br />
Reporting<br />
Limit (MRL)<br />
Number <strong>of</strong><br />
Samples<br />
Over MRL<br />
Lower 95%<br />
Confidence Median<br />
Interval<br />
Physical Parameters<br />
Mean<br />
Upper 95%<br />
Confidence<br />
Interval<br />
Mean <strong>of</strong> Cave<br />
Creek Above<br />
Portal, AZ<br />
Temperature ( o C) N/A 71 24.2 24.9 25.4 26.6 13.6<br />
pH-field (su) N/A 74 7.67 7.78 7.79 7.91 7.77<br />
pH-lab (su) 0.01 74 7.57 7.70 7.70 7.83 7.71<br />
Turbidity (ntu) 0.01 73 0.47 0.25 3.36 6.24 9.91<br />
General Mineral Characteristics<br />
Total Alkalinity 2.0 74 154 155 177 299 108<br />
Phenol. Alk. 2.0 9 > 85% <strong>of</strong> data below MRL<br />
SC-field (μS/cm) N/A 74 726 622 933 1141 367<br />
SC-lab (μS/cm) N/A 74 745 630 958 1172 382<br />
Hardness-lab 10.0 70 139 110 191 243 183<br />
TDS 10.0 74 486 420 652 817 262<br />
Major Ions<br />
Calcium 5.0 74 44 32 62 79 65<br />
Magnesium 1.0 69 7.3 5.7 9.9 12.5 5.7<br />
Sodium 5.0 74 98 61 138 178 8<br />
Potassium 0.5 72 2.8 2.4 3.6 4.4 1.6<br />
Bicarbonate 2.0 74 185 181 211 237 131<br />
Carbonate 2.0 6 > 85% <strong>of</strong> data below MRL<br />
Chloride 1.0 74 41 18 63 85 2.6<br />
Sulfate 10.0 71 127 110 217 307 87<br />
Nutrients<br />
Nitrate (as N) 0.02 66 1.0 0.6 2.2 3.4 --<br />
Nitrite (as N) 0.02 3*** > 85% <strong>of</strong> data below MRL --<br />
Ammonia 0.02 8 > 85% <strong>of</strong> data below MRL --<br />
TKN 0.05 33 0.08 0.03 0.13 0.18 --<br />
Total Phosphorus 0.02 23 0.015 0.010 0.021 0.027 --<br />
All units mg/L except where noted with physical parameters<br />
Source for Cave Creek: ADEQ Surface Water Database<br />
22
Table 5. Summary Statistics for SS Groundwater <strong>Quality</strong> Data—Continued<br />
Constituent<br />
Minimum<br />
Reporting<br />
Limit (MRL)<br />
Number <strong>of</strong><br />
Samples<br />
Over MRL<br />
Lower 95%<br />
Confidence Median<br />
Interval<br />
Trace Elements<br />
Mean<br />
Upper 95%<br />
Confidence<br />
Interval<br />
Mean <strong>of</strong> Cave<br />
Creek near<br />
Portal, AZ<br />
Antimony 0.005 0 > 85% <strong>of</strong> data below MRL --<br />
Arsenic 0.01 17 0.0034 0.0025 0.0127 0.0219 --<br />
Barium 0.1 1 > 85% <strong>of</strong> data below MRL --<br />
Beryllium 0.0005 2 > 85% <strong>of</strong> data below MRL --<br />
Boron 0.1 34 0.15 0.05 0.23 0.34 --<br />
Cadmium 0.001 1 > 85% <strong>of</strong> data below MRL --<br />
Chromium 0.01 2 > 85% <strong>of</strong> data below MRL --<br />
Copper 0.01 9 > 85% <strong>of</strong> data below MRL --<br />
Fluoride 0.20 72 2.0 1.3 2.8 3.6 0.46<br />
Iron 0.1 13 0.029 0.050 0.180 0.331 --<br />
Lead 0.005 1 > 85% <strong>of</strong> data below MRL --<br />
Manganese 0.05 3 > 85% <strong>of</strong> data below MRL --<br />
Mercury 0.0005 1 > 85% <strong>of</strong> data below MRL --<br />
Nickel 0.1 0*** > 85% <strong>of</strong> data below MRL --<br />
Selenium 0.005 6 > 85% <strong>of</strong> data below MRL --<br />
Silver 0.001 0 > 85% <strong>of</strong> data below MRL --<br />
Thallium 0.005 0 > 85% <strong>of</strong> data below MRL --<br />
Zinc 0.05 29 0.056 0.025 0.142 0.229 --<br />
Radiochemical Constituents<br />
Radon* Varies 33 479 533 789 1099 --<br />
Gross Alpha* Varies 23 3.0 4.6 6.5 10.0 --<br />
Gross Beta* Varies 21 3.0 3.1 5.2 7.4 --<br />
Ra-226* Varies 0 > 85% <strong>of</strong> data below MRL --<br />
Ra-228* Varies 4 > 85% <strong>of</strong> data below MRL --<br />
Uranium** Varies 3 > 85% <strong>of</strong> data below MRL --<br />
All units mg/L except * = pCi/L and ** = μg/L<br />
*** = Only 64 sites sampled for nickel<br />
Source for Cave Creek: ADEQ Surface Water Database<br />
23
GROUNDWATER COMPOSITION<br />
Groundwater in the SS was characterized by<br />
qualitative classifications, chemistry, and crosscorrelation<br />
<strong>of</strong> constituent concentrations.<br />
General Summary<br />
Groundwater in the SS is generally slightly alkaline,<br />
fresh, and hard as indicated by pH values and TDS<br />
and hardness concentrations. TDS concentrations<br />
(Map 6) were considered fresh (below 1,000 mg/L) at<br />
63 sites while 12 sites were slightly saline (1,000 to<br />
3,000 mg/L) while 2 sites were moderately saline<br />
(3,000 to 10,000 mg/L). 18 Levels <strong>of</strong> pH were slightly<br />
acidic (below 7 SU) at 2 sites and slightly alkaline<br />
(above 7 SU) at 75 sites. 18 Hardness concentrations<br />
(Map 5) were divided into s<strong>of</strong>t (28 sites), moderately<br />
hard (18 sites), hard (13 sites), and very hard (18<br />
sites). 13<br />
Nutrient concentrations were generally low with<br />
nitrate (Map 5), TKN, and total phosphorus detected<br />
at more than 15 percent <strong>of</strong> the sites. Nitrate (as<br />
nitrogen) concentrations were divided into natural<br />
background (16 sites < 0.2 mg/L), may or may not<br />
indicate human influence (50 sites between 0.2 - 3.0<br />
mg/L), may result from human activities (8 sites<br />
between 3.0 - 10 mg/L), and probably result from<br />
human activities (3 sites > 10 mg/L). 24<br />
Most trace elements such as antimony, barium,<br />
beryllium, cadmium, chromium, copper, lead,<br />
manganese, mercury, nickel, selenium, silver, and<br />
thallium were rarely–if ever--detected. Only arsenic,<br />
boron, fluoride, iron, and zinc were detected at more<br />
than 15 percent <strong>of</strong> the sites.<br />
Groundwater Chemistry<br />
The chemical composition <strong>of</strong> sampled sites is shown<br />
in Map 7 as well as illustrated using Piper trilinear<br />
diagrams.<br />
• The cation triangle diagram (lower left in<br />
Figure 14) shows that the dominant (> 50<br />
percent) cation is calcium at 26 sites, sodium<br />
at 39 sites, magnesium at 0 sites, and mixed<br />
at 12 sites.<br />
• The anion triangle diagram (lower right in<br />
Figure 14) shows that the dominant anion (><br />
50 percent) is bicarbonate at 46 sites, sulfate<br />
at 13 sites, chloride at 0 sites, and mixed at<br />
18 sites.<br />
• The cation-anion diamond diagram (in<br />
center <strong>of</strong> Figure 14) shows that the<br />
groundwater chemistry is calciumbicarbonate<br />
at 20 sites, sodium-bicarbonate<br />
at 17 sites, sodium-mixed at 15 sites, mixedbicarbonate<br />
at 9 sites, sodium-sulfate at 7<br />
sites, calcium-sulfate at 4 sites, calciummixed<br />
and mixed-sulfate at two sites apiece,<br />
and mixed-mixed at 1 site.<br />
Overall Constituent Co-variation<br />
The co-variation <strong>of</strong> constituent concentrations was<br />
determined to scrutinize the strength <strong>of</strong> the<br />
associations. The results <strong>of</strong> each combination <strong>of</strong><br />
constituents were examined for statisticallysignificant<br />
positive or negative correlations. A<br />
positive correlation occurs when, as the level <strong>of</strong> a<br />
constituent increases or decreases, the concentration<br />
<strong>of</strong> another constituent also correspondingly increases<br />
or decreases. A negative correlation occurs when, as<br />
the concentration <strong>of</strong> a constituent increases, the<br />
concentration <strong>of</strong> another constituent decreases, and<br />
vice-versa. A positive correlation indicates a direct<br />
relationship between constituent concentrations; a<br />
negative correlation indicates an inverse relationship.<br />
Many significant correlations occurred among the 77<br />
SS sites (Pearson Correlation Coefficient test, p ≤<br />
0.05). The results are provided in Table 6. Positive<br />
correlations that should be highlighted are calciumsulfate,<br />
sodium-chloride and sodium-fluoride (Figure<br />
15). TDS concentrations are best predicted among<br />
major ions and cations by sodium concentrations<br />
(Figure 15) while among anions, sulfate is the best<br />
predictor (multiple regression analysis, p≤ 0.01).<br />
24
Figure 15. Piper Trilinear Diagram<br />
26
Table 6. Correlations Among Groundwater <strong>Quality</strong> Constituent Concentrations Using Pearson Probabilities<br />
Constituent<br />
Significant Positive<br />
Relationship, p=0.01<br />
Significant Positive<br />
Relationship, p=0.05<br />
Significant Negative<br />
Relationship, p=0.01<br />
Significant Negative<br />
Relationship, p=0.05<br />
Temperature (T) SC, TDS, Cl, Na, K, As, B, β F - -<br />
pH - field pH-lab, CO 3 α - Ca, Hard<br />
pH - lab pH-f, CO 3 α, β - D<br />
SC - field T, TDS, Cl, SO 4 , Na, K, As, B β - -<br />
TDS T, SC, Cl, SO 4 , Na, As, B K - -<br />
Turbidity TKN, P, Fe - - -<br />
Total Alkalinity HCO 3 Mg - -<br />
Bicarbonate<br />
TAlk Mg - -<br />
(HCO 3 )<br />
Carbonate (CO 3 ) pH-f, pH-lab, α - O, D -<br />
Chloride (Cl) T, SC, TDS, Na, K, B, β As - -<br />
Sulfate (SO 4 ) SC, TDS, Ca Hard - -<br />
Calcium (Ca) SO 4 , Hard Mg - pH-f<br />
Magnesium (Mg) HCO 3 , Hard TAlk - -<br />
Hardness Ca, Mg SO 4 , D pH-f<br />
Sodium (Na) T, SC, TDS, Cl, K, As, B, β F - -<br />
Potassium (K) T, SC, Cl, Na, B, β TDS, As - -<br />
Fluoride (F) B T, Cl, Na, As - -<br />
Nitrate (NO 3 ) - - - -<br />
Arsenic (As) T, SC, Na, B TDS, Cl, K, F - -<br />
Boron (B) T, SC, TDS, Cl, Na, K, F, As, β - - -<br />
Zinc (Zn) - - - -<br />
Gross Alpha (α) CO 3 pH-f, pH-lab - -<br />
Gross Beta (β) T, Cl, Na, K, B pH-lab, SC - D<br />
Oxygen (O) D Mg CO 3 -<br />
Deuterium (D) Mg, O Hard CO 3 pH-lab, β<br />
27
Figure 15. Sodium - TDS and Fluoride - Calcium Concentration Covariation<br />
Sodium (mg/L)<br />
1000<br />
900<br />
800<br />
700<br />
600<br />
500<br />
400<br />
300<br />
200<br />
100<br />
0<br />
0 1000 2000 3000 4000 5000<br />
TDS (mg/L)<br />
Among SS sample sites, TDS<br />
concentrations are best predicted among<br />
major ions and cations by sodium<br />
concentrations (multiple regression<br />
analysis, p≤ 0.01, y = 3.84x + 128, n =<br />
77, r = 0.92). Although recharge areas<br />
usually contain low concentrations <strong>of</strong><br />
sodium, it’s frequently the dominant<br />
cation in downgradient areas. 20 TDS<br />
concentrations are greatest in the<br />
northern portions <strong>of</strong> the sub-basin. The<br />
elevated TDS concentrations are related<br />
to increasing sodium concentrations from<br />
silicate weathering and halite dissolution<br />
along with ion exchange. 28<br />
Fluoride (mg/L)<br />
20<br />
15<br />
10<br />
5<br />
0<br />
0 100 200 300 400 500<br />
Calcium (mg/L)<br />
This graph illustrates the negative<br />
exponential relationship between<br />
fluoride and calcium at sites in the <strong>San</strong><br />
<strong>Simon</strong> sub-basin (Pearson correlation<br />
coefficient test, p≤ 0.01, y = -1.3x +<br />
7.4, n = 77, r = 0.46). These findings<br />
support previous assertions that there<br />
are multiple controls on fluoride<br />
concentrations. 28 Calcium appears to be<br />
an important control on the highest<br />
fluoride concentrations (>5 mg/L)<br />
though precipitation <strong>of</strong> the mineral<br />
fluorite. High concentrations <strong>of</strong> fluoride<br />
had corresponding depleted<br />
concentrations <strong>of</strong> calcium. Previous<br />
studies have cited hydroxyl ion<br />
exchange or sorption-desorption<br />
reactions at providing controls on lower<br />
(< 5 mg/L) fluoride concentrations.<br />
28
Aquifer Constituent Co-variation<br />
Alluvial Aquifer - Sample sites in the alluvial<br />
aquifer reflected the relative uniformity <strong>of</strong> this waterbearing<br />
unit with strong positive correlations among<br />
TDS, SC, hardness, major ions (calcium, magnesium,<br />
sodium, chloride, and sulfate), and nitrate (Pearson<br />
Correlation Coefficient test, p ≤ 0.05). Other patterns<br />
<strong>of</strong> interest include positive correlations among pHlab,<br />
pH-field, bicarbonate, and fluoride as well as<br />
among temperature, potassium, and bicarbonate.<br />
TDS concentrations are best predicted among cations<br />
equally by calcium, sodium and magnesium<br />
concentrations while among anions, sulfate is the best<br />
predictor (multiple regression analysis, p≤ 0.01).<br />
Bedrock - Sample sites in bedrock areas exhibited<br />
the highest degree <strong>of</strong> significant correlations and the<br />
most interesting patterns. TDS and SC were<br />
positively correlated with major ions (calcium,<br />
magnesium, sodium, bicarbonate, chloride, and<br />
sulfate) as well as with temperature, pH-lab,<br />
hardness, boron, and fluoride (Pearson Correlation<br />
Coefficient test, p ≤ 0.05). However, this pattern<br />
bifurcated depending on whether the dominant cation<br />
was calcium or sodium. Calcium was intercorrelated<br />
with hardness, magnesium, bicarbonate,<br />
and sulfate. In contrast sodium was inter-correlated<br />
with potassium, bicarbonate, chloride, nitrate,<br />
arsenic, boron, and fluoride. Perhaps the most<br />
interesting bedrock correlation was between nitrate<br />
and both oxygen-18 and deuterium; this indicates that<br />
higher nitrate concentrations are more likely to be<br />
from recently recharged water.<br />
Lower Aquifer - Sample sites in the lower aquifer<br />
had relatively few significant correlations. Positive<br />
correlations occurred among TDS, SC, temperature,<br />
sodium, and sulfate (Pearson Correlation Coefficient<br />
test, p ≤ 0.05). Fluoride concentrations from samples<br />
collected from the lower aquifer are <strong>of</strong>ten elevated<br />
over water quality standards. This constituent has<br />
important correlations with both pH-field (positive)<br />
and calcium (negative).<br />
TDS concentrations are best predicted among cations<br />
by sodium concentrations while among anions,<br />
sulfate and chloride are almost equally the best<br />
predictor (multiple regression analysis, p≤ 0.01).<br />
Upper Aquifer - Sample sites in the upper aquifer<br />
had the common significant positive correlations<br />
among TDS, SC, hardness, major ions (calcium,<br />
magnesium, sodium, potassium, chloride, and sulfate)<br />
and nitrate (Pearson Correlation Coefficient test, p ≤<br />
0.05). Of particular interest is the TDS-nitrate<br />
relationship which may indicate that the poor quality,<br />
salt-laden irrigation water that recharges the upper<br />
aquifer also frequently carries with it nitrate.<br />
TDS levels are best predicted among cations by<br />
sodium concentrations while among anions, sulfate is<br />
the best predictor (multiple regression analysis, p≤<br />
0.01).<br />
TDS concentrations are best predicted among cations<br />
by calcium concentrations while among anions,<br />
sulfate is the best predictor (multiple regression<br />
analysis, p≤ 0.01).<br />
GROUNDWATER QUALITY PATTERNS<br />
Spatial Variation<br />
29
Groundwater in the SS was characterized by<br />
assessing the spatial variation <strong>of</strong> groundwater quality<br />
among water-bearing units and rock types.<br />
Aquifer Comparison – In a very simplified model,<br />
the SS can be divided into four water-bearing units:<br />
the alluvial aquifer, the upper aquifer, the lower<br />
aquifer, and mountain bedrock. Analytical results<br />
were compared between these four water-bearing<br />
units to identify significant differences in<br />
concentrations <strong>of</strong> groundwater quality constituents.<br />
Many significant differences were found, such as<br />
with TDS, illustrated in Figure 16. The results are<br />
provided in Table 7 (ANOVA test with Tukey option,<br />
p ≤ 0.05). The 95% confidence intervals for<br />
constituent concentrations for each SS water-bearing<br />
unit found to be significantly different are in Table 8.<br />
Aquifer-Watershed Comparison – In another very<br />
simplified model, the SS can be further divided into<br />
seven hydrologic units for comparison purposes by<br />
subdividing the mountain bedrock into four ranges:<br />
Chiricahua, Dos Cabezas, Peloncillo and Pinaleno.<br />
Analytical results were compared between these<br />
seven hydrologic units to identify significant<br />
differences in concentrations <strong>of</strong> groundwater quality<br />
constituents. Many significant differences were<br />
found and are listed in Table 9 (ANOVA test with<br />
Tukey option, p ≤ 0.05). The 95% confidence<br />
intervals for constituent concentrations for each SS<br />
water-bearing unit found to be significantly different<br />
are in Table 10.<br />
Geological Comparison - The SS can be divided<br />
into five geologic classifications: alluvium, basaltic,<br />
granite, sedimentary, and volcanic (Map 2). 26<br />
Analytical results were examined for differences in<br />
concentrations <strong>of</strong> groundwater quality constituents<br />
among the five geologic classifications. Many<br />
significant patterns were revealed with this<br />
geological comparison, such as with gross alpha<br />
(Figure 16). Data are provided in Table 11 (ANOVA<br />
test with the Tukey test, p ≤ 0.05). The 95%<br />
confidence intervals for constituent concentrations<br />
for each SS water-bearing unit found to be<br />
significantly different are in Table 12.<br />
Constituent Covariation with Groundwater Depth<br />
The constituent concentrations <strong>of</strong> the sample sites<br />
were compared to the corresponding groundwater<br />
depth for each SS sample site. Depth was determined<br />
using a sounder in the field or data from ADWR well<br />
registration records. Comparisons were made using<br />
three distinct methods: a linear model, an exponential<br />
model, and a biphasic model. The linear model<br />
compares constituent concentrations to groundwater<br />
depth, the exponential model compares the logtransformed<br />
constituent concentrations to<br />
groundwater depth, and the biphasic model compares<br />
the log-transformed constituent concentrations to logtransformed<br />
groundwater depth. The overall results<br />
indicate that 9 <strong>of</strong> the 27 groundwater quality<br />
constituents examined had one or more mathematical<br />
equations significantly relating constituent<br />
concentrations to groundwater depth (regression<br />
analysis, p ≤ 0.05). Of these significant relationships,<br />
most constituents (TDS, SC, bicarbonate, sodium,<br />
sulfate, fluoride, boron, and zinc) had concentrations<br />
decreasing with increasing groundwater depth below<br />
land surface (bls). In contrast, only temperature<br />
increased with increasing groundwater depth bls.<br />
Patterns involving groundwater depth and constituent<br />
concentrations were also examined for the alluvial<br />
aquifer. Of the 27 groundwater quality constituents<br />
examined, four (temperature, bicarbonate, potassium,<br />
and oxygen-18) significantly increased with<br />
increasing groundwater depth (regression analysis, p<br />
≤ 0.05).<br />
Constituent Co-variation with Well Depth<br />
The constituent concentrations <strong>of</strong> the sample sites<br />
were compared to the corresponding well depth for<br />
each SS sample site. Depth was determined using<br />
data from ADWR well registration records. As with<br />
groundwater depth, comparisons were made using<br />
three distinct methods: a linear model, an exponential<br />
model, and a biphasic model. The overall results<br />
indicate that 13 <strong>of</strong> the 27 groundwater quality<br />
constituents examined had one or more mathematical<br />
equations significantly relating constituent<br />
concentrations to groundwater depth (regression<br />
analysis, p ≤ 0.05). Of these significant relationships,<br />
most constituents (TDS, SC, bicarbonate, calcium,<br />
magnesium, hardness, sulfate, fluoride, nitrate, and<br />
arsenic) had concentrations decreasing with<br />
increasing well depth bls. In contrast, only<br />
temperature, pH-field, and pH-lab increased with<br />
increasing well depth bls.<br />
30
Figure 16. TDS and Gross Alpha Concentrations Relative to Aquifers and Geology<br />
TDS (mg/L)<br />
5000<br />
4000<br />
3000<br />
2000<br />
1000<br />
0<br />
Alluvial<br />
Bedrock<br />
Lower<br />
Aquifer<br />
Upper<br />
This boxplot illustrates the variation in<br />
total dissolved solids (TDS) concentrations<br />
between four SS water-bearing units.<br />
TDS concentrations are highest in the<br />
upper aquifer and decrease respectively in<br />
the lower aquifer, bedrock, and alluvial<br />
aquifer. However, statistics indicate that<br />
some <strong>of</strong> these differences may be by<br />
chance. Significant differences only occur<br />
with higher concentrations in the upper<br />
aquifer compared to the bedrock or<br />
alluvial aquifer and the lower aquifer<br />
compared to the alluvial aquifer (ANOVA<br />
with Tukey test, p≤ 0.01). These TDS<br />
patterns appear to be the result <strong>of</strong><br />
recharge sources and dissolution reactions<br />
as groundwater moves downgradient 28<br />
Gross Alpha (piC/L)<br />
40<br />
30<br />
20<br />
10<br />
0<br />
AL BAS GR SED VOL<br />
Geology<br />
This boxplot illustrates the variation in gross<br />
alpha concentrations between five SS waterbearing<br />
units. Radiochemistry samples were<br />
collected at 23 <strong>of</strong> the 77 sites. The highest<br />
gross alpha concentrations, <strong>of</strong>ten over the<br />
health-based standard <strong>of</strong> 15 pCi/L, are found<br />
in sites located in granite (GR) geology. 34<br />
Statistical tests indicate that gross alpha<br />
concentrations in granite geology are<br />
significantly higher than those in either<br />
alluvial (AL) or sedimentary (SED) geology<br />
(ANOVA with Tukey test, p≤ 0.05). Previous<br />
studies indicate radiochemistry<br />
concentrations are generally higher in lowyield<br />
wells located in granite. 23 In the <strong>San</strong><br />
<strong>Simon</strong> sub-basin, granite rock generally<br />
occurs in the Dos Cabezas and Pinaleno<br />
Mountains. 26<br />
31
Table 7. Variation in Groundwater <strong>Quality</strong> Constituent Concentrations Among Four SS Water-Bearing<br />
Units Using Transformed Data with the ANOVA and Tukey Tests<br />
Constituent Significance Water-Bearing Unit Significant Differences<br />
Oxygen-18 ** Lower > Upper, Alluvial & Bedrock<br />
Deuterium ** Lower > Upper, Alluvial & Bedrock<br />
Temperature - f ** Lower > Upper & Bedrock<br />
pH - f ** Lower > Bedrock; Lower & Alluvial > Upper<br />
pH - lab ** Lower > Upper, Alluvial & Bedrock<br />
SC - f ** Upper > Alluvial & Bedrock; Lower > Alluvial<br />
SC - lab ** Upper > Alluvial & Bedrock; Lower > Alluvial<br />
Turbidity * Bedrock > Alluvial<br />
TDS ** Upper > Alluvial & Bedrock; Lower > Alluvial<br />
Bicarbonate<br />
ns<br />
Calcium ** Upper > Lower<br />
Magnesium ** Upper & Bedrock > Lower<br />
Hardness ** Upper > Lower & Alluvial<br />
Sodium ** Upper & Lower > Alluvial & Bedrock<br />
Potassium ** Upper & Lower & Alluvial > Bedrock<br />
Chloride ** Upper & Lower > Alluvial & Bedrock<br />
Sulfate ** Upper & Lower > Alluvial & Bedrock<br />
Fluoride ** Upper & Lower > Bedrock<br />
Nitrate (as N) ** Upper > Lower<br />
TKN<br />
ns<br />
Total Phosphorus ** Alluvial & Bedrock > Lower<br />
Boron ** Upper & Lower > Alluvial & Bedrock<br />
Arsenic ** Lower > Alluvial & Bedrock<br />
Iron<br />
Zinc<br />
Gross alpha<br />
Radon<br />
ns<br />
ns<br />
ns<br />
ns<br />
ns = not significant * = significant at p ≤ 0.05 ** = significant at p ≤ 0.01<br />
32
Table 8. Summary Statistics (95% Confidence Intervals) for Groundwater <strong>Quality</strong> Constituents With<br />
Significant Concentration Differences Among Four SS Water Bearing Units<br />
Constituent<br />
Significant<br />
Differences<br />
Alluvial Bedrock Lower Aquifer Upper Aquifer<br />
Oxygen-18 ** -9.6 to -10.1 -9.5 to -10.4 -10.2 to -11.2 -8.4 to 9.6<br />
Deuterium ** -67 to -71 -67 to -73 -74 to -81 -59 to -71<br />
Temperature - f ** 23.3 to 26.9 21.0 to 25.4 26.4 to 30.2 20.9 to 23.4<br />
pH - f ** 7.74 to 8.00 7.38 to 7.75 7.88 to 8.30 7.11 to 7.62<br />
pH - lab ** 7.43 to 7.68 7.12 to 7.55 7.93 to 8.32 7.27 to 7.95<br />
SC - f ** 219 to 590 493 to 851 754 to 1286 657 to 3495<br />
SC - lab ** 228 to 610 507 to 873 772 to 1317 677 to 3601<br />
Turbidity * -0.3 to 1.7 -0.8 to 15.7 - -<br />
TDS ** 147 to 420 327 to 573 503 to 848 401 to 2881<br />
Bicarbonate ns - - - -<br />
Calcium ** 21 to 63 43 to 95 22 to 49 28 to 279<br />
Magnesium ** 1.3 to 11.3 8.8 to 17.2 2.8 to 8.7 8.8 to 42.9<br />
Hardness ** 55 to 201 153 to 314 73 to 164 114 to 799<br />
Sodium ** 22 to 50 34 - 88 126 to 241 80 to 605<br />
Potassium ** 2.0 to 4.7 0.9 to 2.4 3.4 to 6.6 1.9 to 8.5<br />
Chloride ** -1 to 29 10 to 56 46 to 133 17 to 208<br />
Sulfate ** -13 to 136 62 to 190 133 to 250 30 to 1516<br />
Fluoride ** 0.8 to 2.2 0.70 to 1.60 2.9 to 6.6 1.3 to 5.0<br />
Nitrate (as N) ** - - 0.4 to 1.7 1.1 to 20.6<br />
TKN ns - - - -<br />
T. Phosphorus ** -.035 to 0.133 0.023 to 0.066 0.007 to 0.025 -<br />
Boron ** 0.005 to 0.005 0.016 to 0.101 0.06 to 0.64 0.02 to 0.79<br />
Arsenic ** 0.005 to 0.005 0.005 to 0.008 0.002 to 0.085 -<br />
Iron ns - - -<br />
Zinc ns - - -<br />
Gross alpha ns - - -<br />
Radon ns - - -<br />
33
Table 9. Variation in Groundwater <strong>Quality</strong> Constituent Concentrations Among Seven SS Water-Bearing<br />
Units Using Transformed Data with the ANOVA and Tukey Tests<br />
Constituent Significance Water-Bearing Unit Significant Differences<br />
Oxygen-18 ** Alluvial > Lower; Upper > Dos Cab, Lower & Pina;<br />
Pel > Alluvial, Chir, Dos Cab, Lower & Pina<br />
Deuterium ** Chir, Dos Cab, Lower, Pel & Upper > Lower; Chir, Pen & Upper > Pina<br />
Temperature - f ** Alluvial, Lower & Pinaleno > Chiricahua; Lower > Upper<br />
pH – f ** Lower > Chiricahua, Dos Cabezas & Upper<br />
pH – lab ** Alluvial, Lower & Upper > Chir; Lower > Alluvial, Dos Cab, Pel & Upper<br />
SC – f ** Upper & Lower > Alluvial & Chiricahua<br />
SC – lab ** Upper & Lower > Alluvial & Chiricahua<br />
Turbidity<br />
ns<br />
TDS ** Upper & Lower > Chiricahua & Alluvial; Upper > Pinaleno<br />
Bicarbonate ** Dos Cabezas, Lower, Peloncillo, Pinaleno & Upper > Chiricahua<br />
Calcium ** Upper & Dos Cabezas > Lower<br />
Magnesium ** Upper & Dos Cabezas > Lower<br />
Hardness ** Upper & Dos Cabezas > Lower<br />
Sodium ** Upper & Lower > Alluvial, Chir & Dos Cab; Pel & Pina > Chir<br />
Potassium ** Upper & Lower > Chir, Dos Cab & Pina; Alluvial > Dos Cab Pina<br />
Chloride ** Upper & Lower > Alluvial & Chir; Dos Cab & Pel > Chir<br />
Sulfate ** Upper & Lower > Alluvial & Pina; Upper > Chir; Dos Cab > Alluvial<br />
Fluoride ** Upper & Lower > Chiricahua; Lower > Dos Cabezas<br />
Nitrate (as N) ** Upper > Chiricahua & Lower<br />
TKN<br />
ns<br />
Total Phosphorus ** Alluvial, Chiricahua & Dos Cabezas > Lower<br />
Boron ** Upper & Lower > Alluvial & Chiricahua; Lower > Dos Cabezas<br />
Arsenic ** Lower > Alluvial<br />
Iron ** Dos Cabezas > Alluvial, Chiricahua, Lower & Upper<br />
Zinc<br />
Gross alpha<br />
Radon<br />
ns<br />
ns<br />
ns<br />
ns = not significant * = significant at p ≤ 0.05 ** = significant at p ≤ 0.01<br />
34
Table 10. Summary Statistics (95% Confidence Intervals) for Groundwater <strong>Quality</strong> Constituents With<br />
Significant Concentration Differences Among Seven SS Water Bearing Units<br />
Constituent<br />
Alluvial<br />
Aquifer<br />
Chiricahua Dos Cabezas Lower<br />
Aquifer<br />
Pelconcillo Pinaleno Upper<br />
Aquifer<br />
Oxygen-18 -9.6/10.1 -9.5/10.3 -9.7/10.7 -10.3/11.2 -6.6/-9.9 -9.5/11.8 -8.6/9.6<br />
Deuterium -67.2/70.8 -64.7/69.5 -67.5/74.2 -75.8/81.7 -51.9/73.7 -67.1/84.6 -60.1/69.3<br />
Temperature - f 23.3-26.9 114.7-24.3 - 26.3-30.2 - 20.7-35.8 21.0-24.3<br />
pH - f - 7.08-7.92 7.20-7.62 7.92-8.32 - - 7.13-7.58<br />
pH - lab 7.43-7.68 6.54-7.24 7.22-7.71 7.98-8.33 6.53-8.37 - 7.24-7.88<br />
SC - f 219-590 70-998 - 779-1310 - - 650-3220<br />
SC - lab 228-610 75-1027 - 797-1341 - - 673-3319<br />
TDS 147-420 42-792 - 517-862 - 109-511 406-2644<br />
Bicarbonate - 35-235 223-368 150-248 114-382 94-350 207-372<br />
Calcium - - 61-105 20-46 - - 35-258<br />
Magnesium - - 10-26 3-9 - - 8-39<br />
Hardness - - 207-369 70-159 - - 126-738<br />
Sodium 22-50 7-22 6-135 133-247 33-128 21-105 74-553<br />
Potassium 2.0-4.7 0.9-1.6 0.6-1.7 3.6-6.9 - -0.1-2.4 2.1-8.0<br />
Chloride -1-29 2-6 -16-120 50-137 -22 - 169 - 20-191<br />
Sulfate -13-136 -34-416 69-181 136-253 - -38-108 47-1379<br />
Fluoride - 0.2-0.7 0.2-2.3 3.0-6.7 - - 1.2-4.6<br />
Nitrate (as N) - 0.1-0.6 - 0.4-1.6 - - 1.3-18.8<br />
T. Phosphorus -.035-.133 .002-.113 -.009-.124 .008-.024 - - -<br />
Boron .005-.005 .005-.005 -.027-.128 .078-.649 - - .017-.713<br />
Arsenic .005-.005 - - .003-.085 - - -<br />
Iron .032-.099 0.05-0.05 -.394-2.437 .042-.113 - - .049-.053<br />
Zinc - - - - - - -<br />
Gross alpha - - - - - - -<br />
Radon - - - - - - -<br />
35
Table 11. Variation in Groundwater <strong>Quality</strong> Constituent Concentrations Among Five SS Geologic Units<br />
Using Transformed Data with the ANOVA and Tukey Tests<br />
Constituent Significance Geologic Unit Significant Differences<br />
Oxygen-18<br />
Deuterium<br />
ns<br />
ns<br />
Temperature - f ** Alluvial & Granite > Volcanic<br />
pH - f<br />
ns<br />
pH - lab ** Alluvial > Volcanic<br />
SC - f<br />
SC - lab<br />
Turbidity<br />
TDS<br />
ns<br />
ns<br />
ns<br />
ns<br />
Bicarbonate ** Granite > Volcanic<br />
Calcium * Sedimentary > Alluvial & Volcanic<br />
Magnesium<br />
ns<br />
Hardness ** Sedimentary > Alluvial & Granite & Volcanic<br />
Sodium * Alluvial > Sedimentary<br />
Potassium ** Alluvial > Granite & Sedimentary; Basaltic > Granite<br />
Chloride<br />
Sulfate<br />
ns<br />
ns<br />
Fluoride ** Alluvial > Volcanic<br />
Nitrate (as N)<br />
TKN<br />
Total Phosphorus<br />
Boron<br />
Arsenic<br />
Zinc<br />
ns<br />
ns<br />
ns<br />
ns<br />
ns<br />
ns<br />
Gross alpha * Granite > Alluvial & Sedimentary<br />
Gross beta<br />
Radon gas<br />
ns<br />
ns<br />
ns = not significant * = significant at p ≤ 0.05 ** = significant at p ≤ 0.01<br />
36
Table 12. Summary Statistics (95% Confidence Intervals) for Groundwater <strong>Quality</strong> Constituents With<br />
Significant Concentration Differences Among Five SS Geologic Units<br />
Constituent<br />
Oxygen-18<br />
Deuterium<br />
Significant<br />
Differences<br />
ns<br />
ns<br />
Alluvial Basaltic Granite Sedimentary Volcanic<br />
Temperature - f ** 25.1 - 27.7 21.3 - 32.4 15.8 - 24.6<br />
pH – f<br />
ns<br />
pH – lab ** 7.69 – 7.99 6.72 - 7.71<br />
SC – f<br />
SC – lab<br />
Turbidity<br />
TDS<br />
ns<br />
ns<br />
ns<br />
ns<br />
Bicarbonate ** 239 - 401 85 - 243<br />
Calcium * 33 - 80 65 - 239 13 - 46<br />
Magnesium<br />
ns<br />
Hardness ** 109 - 251 211 - 397 221 - 697 47 - 158<br />
Sodium ** 111 - 224 13 - 25<br />
Potassium ** 3.2 - 5.2 8.4 - 8.4 0.5 - 1.3 0.6 – 1.7<br />
Chloride<br />
Sulfate<br />
ns<br />
ns<br />
Fluoride ** 2.4 - 4.6 0.3 – 2.0<br />
Nitrate (as N)<br />
TKN<br />
ns<br />
ns<br />
T. Phosphorus ns<br />
Boron<br />
Arsenic<br />
Iron<br />
Zinc<br />
ns<br />
ns<br />
ns<br />
ns<br />
Gross alpha * 1.7 - 4.9 1.6 - 32.2 -0.9 – 6.5<br />
Gross beta<br />
Radon<br />
ns<br />
ns<br />
ns = not significant * = significant at p ≤ 0.05 ** = significant at p ≤ 0.01<br />
37
Isotope Comparison - Groundwater<br />
characterizations using oxygen and hydrogen isotope<br />
data may be made with respect to the climate and/or<br />
elevation where the water originated, residence<br />
within the aquifer, and whether or not the water was<br />
exposed to extensive evaporation prior to<br />
collection. 11 These characterizations are made by<br />
comparing oxygen-18 isotopes (δ 18 O) and deuterium<br />
(δD), an isotope <strong>of</strong> hydrogen, data to the Global<br />
Meteoric Water Line (GMWL). The GMWL is<br />
described by the linear equation: δD = 8δ 18 O + 10<br />
where δD is deuterium in parts per thousand (per mil,<br />
0 / 00 ), 8 is the slope <strong>of</strong> the line, δ 18 O is oxygen-18 0 / 00 ,<br />
and 10 is the y-intercept. 11 The GMWL is the<br />
standard by which water samples are compared and<br />
represents the best fit isotopic analysis <strong>of</strong> numerous<br />
water samples, worldwide.<br />
Regional isotopic data may be plotted to create a<br />
Local Meteoric Water Line (LMWL) which is<br />
affected by varying climatic and geographic factors.<br />
When the LMWL is compared to the GMWL,<br />
inferences may be made about the origin or history <strong>of</strong><br />
the local water. 11 The LMWL created by δ 18 O and δD<br />
values for samples collected at sites in the SS were<br />
compared to the GMWL. The δD and δ 18 O data lie to<br />
the right <strong>of</strong> the GMWL (Figure 17). Meteoric waters<br />
exposed to evaporation characteristically plot<br />
increasingly below and to the right <strong>of</strong> the GMWL.<br />
Evaporation tends to preferentially contain a higher<br />
percentage <strong>of</strong> lighter isotopes in the vapor phase; the<br />
water that remains behind is isotopically heavier. 11<br />
increasing amounts <strong>of</strong> summer monsoon recharge as<br />
the sites plot further up the evaporation trajectory. 41<br />
No significant differences were found in the δD and<br />
δ 18 O in among these three water-bearing units<br />
(ANOVA test with Tukey option, p ≤ 0.05).<br />
However, sites in or near the Dos Cabezas Mountains<br />
tend to be the most depleted, followed by those in the<br />
alluvial aquifer, and sites in or near the Chiricahua<br />
Mountains. The surface water sample collected from<br />
Cave Creek in the Chiricahua Mountains above the<br />
town <strong>of</strong> Portal was also in this group. Sites in or near<br />
the Peloncillo Mountains and in the upper aquifer<br />
tend to be the most enriched.<br />
The most enriched sites at the top <strong>of</strong> the evaporation<br />
trajectory consisted <strong>of</strong> two windmills located on the<br />
fringes <strong>of</strong> the Peloncillo Mountains and a very<br />
shallow windmill located along the <strong>San</strong> <strong>Simon</strong> River<br />
downgradient <strong>of</strong> the town <strong>of</strong> <strong>San</strong> <strong>Simon</strong>. These sites<br />
are probably predominantly recharged from summer<br />
monsoon storms. 41<br />
Groundwater from arid environments is typically<br />
subject to evaporation which enriches δD and δ 18 O<br />
resulting in a lower slope value (usually between 3<br />
and 6) as compared to the slope <strong>of</strong> 8 associated with<br />
the GMWL. 11 The data for the arid SS conform to<br />
this theory, having a slope <strong>of</strong> 6.51, with the LMWL<br />
described by the linear equation:<br />
δD = 6.51 18 O - 6.09<br />
The most depleted or isotopically lighter waters are<br />
generally associated with sites in the lower aquifer or<br />
bedrock near the Pinaleno Mountains. Significant<br />
differences were found in the δD and δ 18 O in lower<br />
aquifer sites compared with sites in the alluvial<br />
aquifer, bedrock, or the upper aquifer (ANOVA test<br />
with Tukey option, p ≤ 0.05). Some <strong>of</strong> these sites<br />
appear to represent the oldest water in the sub-basin,<br />
recharged during a time period cooler than present.<br />
Higher on the evaporation trajectory are intermixed<br />
sites from the alluvial aquifer, bedrock, and upper<br />
aquifer. All these sites appear to be predominantly<br />
recharged from local winter precipitation with<br />
Figure 17. Values for 63 isotope samples are shown<br />
in this graph. Most sites in the bedrock, alluvial<br />
aquifer, and upper aquifer are clustered in the center<br />
<strong>of</strong> the graph with more depleted lower aquifer sites in<br />
the lower left corner. Lower aquifer isotope sites were<br />
found to be significantly different from bedrock,<br />
alluvial aquifer, and upper aquifer sites (ANOVA test<br />
with Tukey option, p ≤ 0.01).<br />
38
CONCLUSIONS<br />
Groundwater Suitability for Domestic Use<br />
Groundwater in the SS is generally suitable for<br />
domestic and/or municipal use with 67 percent <strong>of</strong><br />
sample sites (52 <strong>of</strong> 77) meeting all health-based<br />
water quality standards. The 25 sites that did not<br />
meet health-based standards are mostly clustered<br />
around the town <strong>of</strong> <strong>San</strong> <strong>Simon</strong> and generally follow<br />
the <strong>San</strong> <strong>Simon</strong> River northwest to the sub-basin<br />
boundary. Thus, sites representing large areas <strong>of</strong> the<br />
SS, particularly in the southern but also in the<br />
western portions, met all health based standards. The<br />
29 sample sites that also met all aesthetics-based<br />
standards also follow the same geographic pattern.<br />
Overall Groundwater <strong>Quality</strong><br />
The <strong>San</strong> <strong>Simon</strong> sub-basin <strong>of</strong> the Safford Groundwater<br />
<strong>Basin</strong> is large and hydrologically complex.<br />
Groundwater quality varies dramatically within the<br />
sub-basin but some general patterns may be<br />
discerned.<br />
Calcium concentrations are best predicted among<br />
anions by sulfate concentrations; in contrast, sodium<br />
concentrations are best predicted almost equally by<br />
sulfate and chloride concentrations with carbonate<br />
concentrations also having a major influence<br />
(multiple regression, p ≤ 0.01). The calcium - sulfate<br />
relationship may be impacted by the dissolution <strong>of</strong><br />
calcite and gypsum concentrated by evaporation<br />
during irrigation <strong>of</strong> agricultural areas that<br />
subsequently recharges the groundwater. 10 In<br />
contrast, the sodium - chloride/sulfate relationship<br />
may be related to the dissolution <strong>of</strong> evaporite<br />
deposits. 20 28 Geophysical studies and drilling data<br />
indicate that the <strong>San</strong> <strong>Simon</strong> Valley contains<br />
significant quantities salt and gypsum deposits, that<br />
4, 44<br />
are over 2,700 feet thick at Tanque.<br />
Many constituents significantly decreased with<br />
increasing groundwater and/or well depth<br />
(regression, p ≤ 0.05). However, groundwater and/or<br />
well depth were <strong>of</strong>ten unable to be determined.<br />
Groundwater depth data were further complicated by<br />
levels representing artesian or partial artesian flows<br />
rather than water table conditions. Thus, water level<br />
in a well tapping the lower aquifer could be<br />
shallower than a well tapping the upper aquifer. As<br />
such, these correlations are <strong>of</strong> limited value and<br />
should be cautiously interpreted and used.<br />
The SS is perhaps better described by examining<br />
groundwater evolution from the southern upgradient<br />
areas to northern downgradient areas with Interstate<br />
10 roughly the dividing line.<br />
<strong>San</strong> <strong>Simon</strong> sub-basin south <strong>of</strong> Interstate 10 - The<br />
southern portion <strong>of</strong> the SS consists <strong>of</strong> bedrock <strong>of</strong> the<br />
Chiricahua Mountains, the Dos Cabezas Mountains,<br />
and the unconfined alluvial aquifer which occupies<br />
the valley areas between the Chiricahua Mountains<br />
and the New Mexico border. This area might be<br />
roughly considered all <strong>of</strong> the sub-basin south <strong>of</strong><br />
Interstate 10 with the exception <strong>of</strong> irrigated areas in<br />
the vicinity <strong>of</strong> the town <strong>of</strong> <strong>San</strong> <strong>Simon</strong>.<br />
The groundwater in these areas is generally suitable<br />
for domestic and/or municipal use; only three sample<br />
sites exceeded health based water quality standards.<br />
Two sites in the Dos Cabezas had gross alpha<br />
exceedances and a fluoride exceedance occurred near<br />
the New Mexico town <strong>of</strong> Rodeo. In addition, most<br />
samples also met aesthetics based water quality<br />
standards in these areas. Exceedances occurred with<br />
TDS and sulfate at two sites in the Chiricahuas,<br />
fluoride at two sites in the alluvial aquifer, and at six<br />
sites in the Dos Cabezas involving various<br />
combinations <strong>of</strong> TDS, chloride, fluoride, iron, and<br />
manganese.<br />
Most sample sites in this area had a calciumbicarbonate<br />
chemistry which <strong>of</strong>ten is indicative <strong>of</strong><br />
recharge areas. 28 Bicarbonate was the predominant<br />
anion except at two sulfate sites in the Chiricahuas.<br />
This area generally had the freshest groundwater in<br />
the sub-basin with TDS aesthetic based standards <strong>of</strong><br />
500 mg/L rarely exceeded and <strong>of</strong>ten below 250 mg/L.<br />
The two sites with TDS exceedances in the<br />
Chiricahuas also had sulfate aesthetics based standard<br />
exceedances likely indicating that these sites are<br />
impacted by nearby historic mining operations. 21<br />
TDS concentrations in the Dos Cabezas tended to be<br />
slightly higher than in the Chiricahuas or the alluvial<br />
aquifer.<br />
Constituents, such as arsenic and nitrate, which<br />
commonly exceed health-based water quality<br />
standards in groundwater in <strong>Arizona</strong>, were low in the<br />
southern portion <strong>of</strong> the sub-basin. The majority <strong>of</strong><br />
fluoride concentrations were also low except in three<br />
locations: the extreme southern portion <strong>of</strong> the alluvial<br />
aquifer; the northeast portion <strong>of</strong> the alluvial aquifer<br />
along the New Mexico state line; and the western<br />
portion <strong>of</strong> the Dos Cabezas range.<br />
<strong>San</strong> <strong>Simon</strong> sub-basin north <strong>of</strong> Interstate 10 - The<br />
northern portion <strong>of</strong> the SS consists <strong>of</strong> the upper<br />
aquifer, the lower aquifer, and bedrock <strong>of</strong> the<br />
Peloncillo Mountains and the Pinaleno Mountains.<br />
39
This area might be roughly considered all the subbasin<br />
north <strong>of</strong> Interstate 10 in addition to the irrigated<br />
areas south <strong>of</strong> the freeway near the town <strong>of</strong> <strong>San</strong><br />
<strong>Simon</strong>.<br />
The groundwater in this area commonly is unsuitable<br />
for domestic and/or municipal use without additional<br />
water treatment. Sample sites in or near the<br />
Peloncillo Mountains, the Pinaleno Mountains, and<br />
near the town <strong>of</strong> Bowie generally met all health based<br />
water quality standards. However, the majority <strong>of</strong><br />
sample sites around the town <strong>of</strong> <strong>San</strong> <strong>Simon</strong> and<br />
northwest along the <strong>San</strong> <strong>Simon</strong> River exceeded both<br />
health based and aesthetics based water quality<br />
standards.<br />
Most sample sites in the northern portions <strong>of</strong> the subbasin<br />
had either a sodium-bicarbonate or sodiummixed<br />
chemistry. These chemistries, along with<br />
higher pH values, are common in downgradient<br />
areas. 28 Previous studies had found sodium<br />
percentages greater than 75 in the northwestern part<br />
<strong>of</strong> the sub-basin. 15 In downgradient areas, sodium<br />
<strong>of</strong>ten becomes the dominant cation probably as the<br />
result <strong>of</strong> halite dissolution. 28 Very few sites had a<br />
calcium or mixed predominant cation. The<br />
predominant anion was either bicarbonate or mixed<br />
except for sulfate at some sites around and<br />
downgradient <strong>of</strong> the town <strong>of</strong> <strong>San</strong> <strong>Simon</strong>.<br />
The freshest groundwater in the northern portion <strong>of</strong><br />
the sub-basin generally was found at sites west <strong>of</strong> the<br />
town <strong>of</strong> Bowie (including the Pinaleno Mountains)<br />
and near the town <strong>of</strong> <strong>San</strong> <strong>Simon</strong> and the Peloncillo<br />
Mountains. These sites had TDS concentrations<br />
generally below the aesthetic based standard <strong>of</strong> 500<br />
mg/L. Northwest <strong>of</strong> the town <strong>of</strong> <strong>San</strong> <strong>Simon</strong> along the<br />
<strong>San</strong> <strong>Simon</strong> River, sites mostly exceeded TDS<br />
standards with some slightly saline with<br />
concentrations over 1,000 mg/L. 18<br />
Fluoride and arsenic concentrations commonly<br />
exceeded health-based water quality standards in the<br />
southern portion <strong>of</strong> the sub-basin. Fluoride<br />
exceedances generally occurred around and<br />
northwest <strong>of</strong> the town <strong>of</strong> <strong>San</strong> <strong>Simon</strong>. In contrast,<br />
arsenic exceedances generally occurred only<br />
northwest <strong>of</strong> the town <strong>of</strong> <strong>San</strong> <strong>Simon</strong>. Nitrate was also<br />
elevated at a few sites around the town <strong>of</strong> <strong>San</strong> <strong>Simon</strong>,<br />
which is probably due to nitrogen fertilizer<br />
applications applied to irrigated farmland and<br />
subsequently recharged to groundwater. 10 Nitrate was<br />
also elevated at an isolated shallow windmill<br />
northwest <strong>of</strong> the town <strong>of</strong> Bowie. This is likely the<br />
result <strong>of</strong> a nearby livestock corrals where cattle<br />
frequently water. Other likely occurrences <strong>of</strong> cattle<br />
impacting shallow windmills in remote locations<br />
have been noted in the Douglas, Sacramento Valley,<br />
and Detrital Valley groundwater basins.<br />
Aquifer Overview<br />
Alluvial Aquifer – This unconfined aquifer is used<br />
only for the purposes <strong>of</strong> this report and is defined as<br />
the alluvial areas south <strong>of</strong> the <strong>San</strong> <strong>Simon</strong> Cienega.<br />
The demarcation <strong>of</strong> the alluvial aquifer is based on<br />
observed and <strong>of</strong>ten dramatic water chemistry changes<br />
that occur between the <strong>San</strong> <strong>Simon</strong> Cienega and the<br />
town <strong>of</strong> <strong>San</strong> <strong>Simon</strong>. The alluvial aquifer has few<br />
water quality exceedances and the lowest salinity<br />
concentrations in the sub-basin. The only health<br />
based water quality exceedance was fluoride at one<br />
site near Rodeo. Fluoride exceedances in the Rodeo<br />
area were also reported in previous studies. 6<br />
In the alluvial aquifer, fluoride concentrations are<br />
positively correlated with pH-field levels (Pearson<br />
Correlation Coefficient test, p ≤ 0.01). This<br />
correlation suggests that exchange <strong>of</strong> hydroxyl ions<br />
for fluoride may be occurring and probably is a<br />
control, perhaps the most important, <strong>of</strong> fluoride<br />
concentrations in solution. 29 During weathering <strong>of</strong><br />
fluoride-containing rocks, particularly schist and<br />
volcanic rocks, the fluoride ions may initially<br />
exchange for hydroxyl groups on clays. This process<br />
would be favored by the lower, near neutral pH<br />
conditions <strong>of</strong> recharge areas and by the<br />
electronegativity <strong>of</strong> fluoride and identical size <strong>of</strong><br />
fluoride and hydroxyl ions. As pH values increase<br />
downgradient through silicate hydrolysis reactions,<br />
greater concentrations <strong>of</strong> hydroxyl ions may increase<br />
the concentrations <strong>of</strong> fluoride in solution. 28<br />
Groundwater sampled in the alluvial aquifer is<br />
significantly heavier or enriched (and appear to<br />
consist <strong>of</strong> more recent recharge) than groundwater in<br />
the lower aquifer based on oxygen-18 and deuterium<br />
isotope levels. Groundwater sampled in the alluvial<br />
aquifer had significantly lower concentrations <strong>of</strong><br />
TDS, sodium, chloride, sulfate, boron, arsenic, and<br />
pH values than sites in the lower aquifer. Except for<br />
pH-lab and arsenic, this pattern is repeated for the<br />
upper aquifer (ANOVA with Tukey test, p ≤ 0.05).<br />
Upper Aquifer - Defined in this report as the<br />
unconfined aquifer located in alluvial areas north <strong>of</strong><br />
the <strong>San</strong> <strong>Simon</strong> Cienega, the upper aquifer commonly<br />
has water quality exceedances <strong>of</strong> fluoride and nitrate<br />
(health based) and TDS and sulfate (aesthetics<br />
based). Elevated fluoride concentrations in the upper<br />
aquifer are likely the result <strong>of</strong> upward leakage <strong>of</strong><br />
high-fluoride water from the lower aquifer. 28 TDS<br />
40
levels may be elevated to the extent that groundwater<br />
is considered slightly saline. 18 In the upper aquifer,<br />
TDS and nitrate concentrations are positively<br />
correlated (Pearson Correlation Coefficient test, p ≤<br />
0.05). This relationship is a strong indication that<br />
salt-laden irrigation water carrying nitrates is<br />
recharging the upper aquifer, a phenomena that<br />
appears to be also occurring in the nearby Willcox<br />
10 33<br />
groundwater basin.<br />
Groundwater sampled in the upper aquifer is<br />
significantly heavier or enriched (and probably<br />
consists <strong>of</strong> more recent recharge) than those in the<br />
lower aquifer based on oxygen-18 and deuterium<br />
isotope levels. Groundwater samples in the upper<br />
aquifer have significantly lower temperature, pHfield,<br />
and pH-lab levels than the lower aquifer. This<br />
pattern is reversed with calcium, magnesium,<br />
hardness, and nitrate concentrations. Previous<br />
studies had cited the more highly mineralized waters<br />
<strong>of</strong> non-artesian waters compared with artesian<br />
water. 15 In addition, groundwater samples in the<br />
upper aquifer had higher concentrations <strong>of</strong> TDS,<br />
sodium, chloride, sulfate, boron and fluoride<br />
(bedrock only) than groundwater samples from the<br />
bedrock or the alluvial aquifer (ANOVA with Tukey<br />
test, p ≤ 0.05).<br />
Many <strong>of</strong> these patterns can be explained by<br />
agricultural activities that impact recharge to the<br />
upper aquifer. Elevated nitrate concentrations are<br />
likely the result <strong>of</strong> nitrogen fertilizer applied to<br />
irrigated fields. 10 The major source <strong>of</strong> elevated<br />
calcium, hardness, and TDS concentrations is the<br />
dissolution <strong>of</strong> calcite and salts concentrated by<br />
evaporation during irrigation, than recharged to the<br />
aquifer. 10 Thus, the upper aquifer appears to be a<br />
chemically open system or one in which the aquifer<br />
chemistry is controlled or influenced by gases or<br />
water that enter the system after the initial recharge. 28<br />
Lower Aquifer - Defined in this report as the<br />
confined or partially confined aquifer located in<br />
alluvial areas north <strong>of</strong> the <strong>San</strong> <strong>Simon</strong> Cienega, the<br />
lower aquifer <strong>of</strong>ten has water quality exceedances <strong>of</strong><br />
fluoride and arsenic (health based) and TDS, sulfate,<br />
and pH (aesthetics based). TDS concentrations may,<br />
in places, be elevated to the extent that groundwater<br />
is considered slightly saline. 18 The lower aquifer is<br />
likely a chemically closed system, or one in which the<br />
aqueous chemistry is determined solely by the<br />
reactions <strong>of</strong> the initial recharge waters with the<br />
various aquifer minerals and gases as groundwater<br />
moves downgradient. 28<br />
Fluoride concentrations in the lower aquifer are<br />
positively correlated with pH-field levels and<br />
negatively correlated with calcium concentrations<br />
(Pearson Correlation Coefficient test, p ≤ 0.05).<br />
Fluoride concentrations are found in this aquifer<br />
more than quadruple the 4 mg/L health standard.<br />
Elevated fluoride concentrations have historically<br />
been present in the sub-basin as a 1952 study found<br />
two-thirds <strong>of</strong> sampled wells containing over 1.5 mg/L<br />
with samples over 10 mg/L common. 15<br />
Fluoride concentrations in the lower aquifer probably<br />
are largely controlled by calcium concentrations<br />
through precipitation or dissolution <strong>of</strong> the mineral<br />
fluorite. 22 28 Under equilibrium conditions, smaller<br />
concentrations <strong>of</strong> calcium permit higher fluoride<br />
concentrations in solution. Thus, if a source <strong>of</strong><br />
fluoride ions is available for dissolution, large<br />
concentrations <strong>of</strong> dissolved fluoride may occur if the<br />
groundwater is depleted in calcium. 28<br />
Arsenic concentrations in groundwater may be<br />
influenced by groundwater residence time, lithology,<br />
and clay mineralogy <strong>of</strong> the aquifer. 34 The highest<br />
concentrations <strong>of</strong> arsenic are typically associated<br />
with the central parts <strong>of</strong> basins whose chemistries<br />
have evolved under closed conditions such as the<br />
lower aquifer in the <strong>San</strong> <strong>Simon</strong> sub-basin. 34<br />
Groundwater samples in the lower aquifer are<br />
significantly lighter or depleted which is<br />
characteristic <strong>of</strong> older recharge than those in the<br />
alluvial aquifer, lower aquifer or bedrock based on<br />
oxygen-18 and deuterium isotope values (ANOVA<br />
with Tukey test, p ≤ 0.05).<br />
Bedrock - Defined in this report as the Chiricahua,<br />
Dos Cabezas, Peloncillo, and Pinaleno Mountains,<br />
bedrock areas generally have few water quality<br />
exceedances and low salinity concentrations though<br />
some areas have water quality concerns. Granite<br />
areas <strong>of</strong> the Dos Cabezas and Pinaleno Mountains<br />
may exceed gross alpha water health based quality<br />
standards. Aesthetics based water quality standards<br />
exceedances are more common and include TDS and<br />
sulfate in the Chiricahua Mountains, TDS, chloride,<br />
fluoride, iron, and manganese in the Dos Cabezas<br />
Mountains, TDS and fluoride in the Peloncillo<br />
Mountains, and beryllium, uranium, pH, iron, and<br />
fluoride in the Pinaleno Mountains. The highest<br />
radon concentrations were found at sample sites in<br />
the Pinaleno and Dos Cabezas Mountains. Calcium<br />
concentrations are positively correlated to hardness,<br />
magnesium, bicarbonate, and sulfate concentrations<br />
in bedrock. In contrast, sodium concentrations are<br />
positively correlated with potassium, bicarbonate,<br />
41
chloride, arsenic, boron, and fluoride concentrations.<br />
Nitrate concentrations were positively correlated with<br />
both oxygen-18 and deuterium indicating higher<br />
nitrate concentrations tend to be the result <strong>of</strong> more<br />
recent recharge (Pearson Correlation Coefficient test,<br />
p ≤ 0.05).<br />
Study Design and Data Evaluation<br />
The 77 groundwater sample sites were generally<br />
selected using a modified grid-based, random siteselection<br />
approach. This method allowed the spatial<br />
distribution <strong>of</strong> sample sites though the SS although<br />
some portions had low sample densities because <strong>of</strong><br />
the large size <strong>of</strong> the sub-basin and the paucity <strong>of</strong><br />
wells and/or springs in certain areas. Based on the<br />
available groundwater in the sub-basin, this<br />
methodology under represents the groundwater<br />
available in basin fill areas compared with the small<br />
volume <strong>of</strong> groundwater available in bedrock areas. 44<br />
Bedrock areas will likely never be used as sites for<br />
municipal wells because <strong>of</strong> limited yields; however,<br />
recent patterns <strong>of</strong> development in the SS have<br />
resulted in scattered residences served by private<br />
domestic wells, <strong>of</strong>ten located in the foothills <strong>of</strong> the<br />
various mountain ranges. Thus, the groundwater<br />
quality <strong>of</strong> bedrock areas is important for much <strong>of</strong> the<br />
new development occurring in the sub-basin.<br />
Most wells sampled were constructed prior to 1980<br />
and lack associated driller logs which specify the<br />
location <strong>of</strong> perforated openings in the well casing.<br />
As such, the delineation <strong>of</strong> which aquifer (or<br />
aquifers) a well was pumping water from was<br />
sometimes a judgment call made with the assistance<br />
<strong>of</strong> isotopic and temperature data.<br />
<strong>Quality</strong> assurance procedures were followed and<br />
quality control samples were collected to ensure the<br />
validity <strong>of</strong> groundwater quality data. Analysis <strong>of</strong><br />
equipment blank samples indicated systematic<br />
contamination <strong>of</strong> SC-lab and turbidity; however, the<br />
extent <strong>of</strong> contamination by these parameters was not<br />
considered significant. Contamination <strong>of</strong> blanks by<br />
copper, mercury, and chloride on individual field<br />
trips was noted but also determined not to be<br />
significant.<br />
Analysis <strong>of</strong> duplicate samples revealed excellent<br />
median correlations <strong>of</strong> less than 2 percent except with<br />
turbidity (17 percent). Split samples generally had<br />
more variability but still rarely exceeded a maximum<br />
difference <strong>of</strong> 20 percent. In order to interchangeably<br />
use groundwater data collected for a previous ADEQ<br />
Watershed study with sample data from this<br />
groundwater study, two wells sampled in 1997 were<br />
resampled in 2002. 37 Results indicated that the<br />
maximum difference between sample constituents<br />
rarely exceeded 15 percent and statistical tests<br />
indicated no significant difference in concentrations.<br />
Data validation was also examined in five QA/QC<br />
correlations that affirmed the acceptability <strong>of</strong> the<br />
groundwater quality data for further analysis. Only<br />
the groundwater temperature - groundwater depth<br />
correlation was not significant (regression analysis, p<br />
≤ 0.05). The non-significance <strong>of</strong> this QA/QC<br />
correlation is likely due to incomplete groundwater<br />
depth information as well as from groundwater depth<br />
data influenced by artesian or partial-artesian flows.<br />
Data analysis for this study was conducted using<br />
Systat s<strong>of</strong>tware. The non-normality <strong>of</strong> most nontransformed<br />
data, and the normality <strong>of</strong> most logtransformed<br />
data was determined using the<br />
Kolmogorov-Smirnov one-sample test with the<br />
Lilliefors option. 8 Spatial variations in constituent<br />
concentrations were investigated using the parametric<br />
Analysis <strong>of</strong> Variance (ANOVA) test in conjunction<br />
with the Tukey test. Correlations among constituent<br />
concentrations were analyzed using the Pearson<br />
Correlation Coefficient test.<br />
42
REFERENCES<br />
1<br />
<strong>Arizona</strong> <strong>Department</strong> <strong>of</strong> <strong>Environmental</strong> <strong>Quality</strong>, 1991,<br />
<strong>Quality</strong> Assurance Project Plan: <strong>Arizona</strong> <strong>Department</strong><br />
<strong>of</strong> <strong>Environmental</strong> <strong>Quality</strong> Standards Unit, 209 p.<br />
13<br />
Crockett, J.K., 1995, Idaho statewide groundwater<br />
quality monitoring program–Summary <strong>of</strong> results, 1991<br />
through 1993: Idaho <strong>Department</strong> <strong>of</strong> Water Resources,<br />
Water Information Bulletin No. 50, Part 2, p. 60.<br />
2 <strong>Arizona</strong> <strong>Department</strong> <strong>of</strong> <strong>Environmental</strong> <strong>Quality</strong>, 2002-<br />
2003, <strong>Arizona</strong> Laws Relating to <strong>Environmental</strong><br />
<strong>Quality</strong>: St. Paul, Minnesota, West Group Publishing,<br />
§49-221-224, p 134-137.<br />
3<br />
4<br />
5<br />
<strong>Arizona</strong> State Land <strong>Department</strong>, 1997, “Land Ownership<br />
- <strong>Arizona</strong>” GIS coverage: <strong>Arizona</strong> Land Resource<br />
Information Systems, downloaded, 4/7/04.<br />
<strong>Arizona</strong> Pay Dirt, 1984, Studies indicate <strong>Arizona</strong> has<br />
tremendous deposits <strong>of</strong> salt: <strong>Arizona</strong> Pay Dirt, Issue<br />
538, p. 6A.<br />
<strong>Arizona</strong> Water Resources Research Center, 1995, Field<br />
Manual for Water-<strong>Quality</strong> Sampling: Tucson,<br />
University <strong>of</strong> <strong>Arizona</strong> College <strong>of</strong> Agriculture, 51 p.<br />
6<br />
Barnes, R.L., 1991, Maps showing groundwater<br />
conditions in the <strong>San</strong> <strong>Simon</strong> sub-basin <strong>of</strong> the Safford<br />
basin, Graham and Cochise Counties, <strong>Arizona</strong>,<br />
Hidalgo County, New Mexico – 1987: <strong>Arizona</strong><br />
<strong>Department</strong> <strong>of</strong> Water Resources Hydrologic Map<br />
Series Report Number 19, 2 sheets, scale 1:250,000.<br />
7<br />
Bitton, Gabriel and Gerba, C.P.,1994. Groundwater<br />
Pollution Microbiology: Krieger Publishing<br />
Company, Malabar, Florida, 119 p.<br />
8<br />
Brown, S.L., Yu, W.K., and Munson, B.E., 1996, The<br />
impact <strong>of</strong> agricultural run<strong>of</strong>f on the pesticide<br />
contamination <strong>of</strong> a river system - A case study on the<br />
middle Gila River: <strong>Arizona</strong> <strong>Department</strong> <strong>of</strong><br />
<strong>Environmental</strong> <strong>Quality</strong> Open File Report 96-1:<br />
Phoenix, <strong>Arizona</strong>, 50 p.<br />
9<br />
Chronic, Halka, 1983. Roadside Geology <strong>of</strong> <strong>Arizona</strong>:<br />
Mountain Press Publishing Company, Missoula,<br />
Montana, 321 p.<br />
10<br />
Coes, A.L., Gellenbeck, D.J., Towne, D.C., and Freark,<br />
M.C., 2000, Ground-water quality in the upper <strong>San</strong>ta<br />
Cruz basin, <strong>Arizona</strong>, 1998: U.S. Geological Survey,<br />
Water-Resources Investigations Report 00-4117, 55 p.<br />
11<br />
Coplen, T.B., Herczeg, A.L., Barnes, C., and Craig, H.,<br />
1999, “Isotope engineering-Using stable isotopes <strong>of</strong><br />
the water molecule to solve practical problems,” in<br />
Cook, P.G. and Herczeg, A.L., eds, <strong>Environmental</strong><br />
Tracers in <strong>Sub</strong>surface Hydrology: Boston, Kluwer<br />
Academic Publishers, p. 89-99.<br />
12 Cordy, G.E., <strong>San</strong>ger, H.W., and Gellenbeck,, D.J., 2000,<br />
Radon in Ground Water in Central and Southern<br />
<strong>Arizona</strong>: A Cause for Concern: <strong>Arizona</strong> Hydrologic<br />
Society, Annual Symposium, Phoenix, <strong>Arizona</strong>,<br />
September 20-23, 2000, p. 79-81.<br />
14 Cushman, R.L. and Jones, R.S., 1947, Geology and<br />
ground-water resources <strong>of</strong> the <strong>San</strong> <strong>Simon</strong> basin,<br />
Cochise and Graham Counties, <strong>Arizona</strong> with a section<br />
on <strong>Quality</strong> <strong>of</strong> water by J.D. Hem: U.S. Geological<br />
Survey Open-File Report, [unnumbered], 31 p.<br />
15<br />
DeCook, K.J., 1952, <strong>San</strong> <strong>Simon</strong> basin, Cochise County,<br />
in Halpenny, L.C., and others, editors, Ground water<br />
in the Gila River basin and adjacent areas, <strong>Arizona</strong>-a<br />
summary: U.S. Geological Survey Open-File Report,<br />
[unnumbered], p. 59-68.<br />
16<br />
Del Mar Laboratory, 2002, Personal communication<br />
from Del Mar staff member.<br />
17<br />
Graf, Charles, 1990, An overview <strong>of</strong> groundwater<br />
contamination in <strong>Arizona</strong>: Problems and principals:<br />
<strong>Arizona</strong> <strong>Department</strong> <strong>of</strong> <strong>Environmental</strong> <strong>Quality</strong><br />
seminar, 21 p.<br />
18<br />
Heath, R.C., 1989, Basic ground-water hydrology: U.S.<br />
Geological Survey Water-Supply Paper 2220, 84 p.<br />
19<br />
Helsel, D.R. and Hirsch, R.M., 1992, Statistical methods<br />
in water resources: New York, Elsevier, 529 p.<br />
20<br />
Hem, J.D., 1985, Study and interpretation <strong>of</strong> the<br />
chemical characteristics <strong>of</strong> natural water (3 rd ed.): U.S.<br />
Geological Survey Water-Supply Paper 2254, 264 p.<br />
21 Henderson, Timothy, 1984, Groundwater: Strategies for<br />
state action: Washington, D.C., The <strong>Environmental</strong><br />
Law Institute, 99 p.<br />
22<br />
23<br />
Knechtel, M.M., 1938, Geology and ground-water<br />
resources <strong>of</strong> the valley <strong>of</strong> Gila River and <strong>San</strong> <strong>Simon</strong><br />
Creek, Graham County, <strong>Arizona</strong>, with a section on<br />
The Chemical character <strong>of</strong> the groundwater by E.W.<br />
Lohr: U.S. Geological Survey Water-Supply Paper<br />
796-F, p. 181-222, 2 sheets, scale 1:96,0000.<br />
Lowry, J.D. and Lowry, S.B., 1988, Radionculides in<br />
drinking waters: American Water Works Association<br />
Journal 80 (July), pp. 50-64.<br />
24<br />
Madison, R.J., and Brunett, J.O., 1984, Overview <strong>of</strong> the<br />
occurrence <strong>of</strong> nitrate in ground water <strong>of</strong> the United<br />
States, in National Water Summary 1984-Water<br />
<strong>Quality</strong> Issues: U.S. Geological Survey Water Supply<br />
Paper 2275, pp. 93-105.<br />
25<br />
Molitor, Delbert, 1997, Suspended sediment monitoring<br />
project: <strong>San</strong> <strong>Simon</strong> watershed, southeast <strong>Arizona</strong>,<br />
1983 to 1995: Bureau <strong>of</strong> Land Management Safford<br />
Field Office Study 573-070, 71 p.<br />
43
26<br />
Richard, S.M., Reynolds, S.J., Spencer, J.E. and<br />
Pearthree, P.A., 2000, Geologic map <strong>of</strong> <strong>Arizona</strong>:<br />
<strong>Arizona</strong> Geological Survey Map 35, scale<br />
1:1,000,000.<br />
27<br />
Roberts, Isaac, 2000, Personal communication from<br />
ADHS laboratory staff member.<br />
28<br />
Robertson, F.N., 1991, Geochemistry <strong>of</strong> ground water in<br />
alluvial basins <strong>of</strong> <strong>Arizona</strong> and adjacent parts <strong>of</strong><br />
Nevada, New Mexico, and California: U.S. Geological<br />
Survey Pr<strong>of</strong>essional Paper 1406-C, 90 p.<br />
29 Robertson, F.N., and Garrett, W.B., 1988, Distribution<br />
<strong>of</strong> fluoride in ground water in the alluvial basins <strong>of</strong><br />
<strong>Arizona</strong> and adjacent parts <strong>of</strong> California, Nevada, and<br />
New Mexico: U.S. Geological Survey Hydrologic<br />
Investigations Atlas HA-665, 3 sheets, scale<br />
1:500,000.<br />
36<br />
Vogt, K.D., 1979, Soil survey <strong>of</strong> <strong>San</strong> <strong>Simon</strong> area,<br />
<strong>Arizona</strong>, parts <strong>of</strong> Cochise, Graham, and Greenlee<br />
Counties: U.S. <strong>Department</strong> <strong>of</strong> Agriculture Soil<br />
Conservation Service in cooperation with the <strong>Arizona</strong><br />
Agricultural Experiment Station, 148 p.<br />
37<br />
Wallin, R., 1999, Groundwater quality in the upper Gila<br />
River basin, <strong>Arizona</strong>: <strong>Arizona</strong> <strong>Department</strong> <strong>of</strong><br />
<strong>Environmental</strong> <strong>Quality</strong> Open File Report 98-12, 48 p.<br />
38 Water <strong>Quality</strong> Association website, 2004, www.wqa.org<br />
39<br />
White, N.D., 1963, Analysis and evaluation <strong>of</strong> available<br />
hydrologic data for <strong>San</strong> <strong>Simon</strong> basin, Cochise and<br />
Graham Counties, <strong>Arizona</strong>: U.S. Geological Survey<br />
Water Supply Paper 1619-DD, 32 p.<br />
4 0 Wilkinson, L., and Hill, M.A., 1996. Using Systat 6.0<br />
for Windows, Systat: Evanston, Illinois, p. 71-275.<br />
30<br />
31<br />
Rockfellow, J.A., 1955, Log <strong>of</strong> an <strong>Arizona</strong> Trail Blazer:<br />
<strong>Arizona</strong> Silhouettes: Tucson, <strong>Arizona</strong>.<br />
Schwennesen, A.T., 1917, Groundwater in the <strong>San</strong><br />
<strong>Simon</strong> Valley, <strong>Arizona</strong> and New Mexico, with a<br />
section on agriculture by Forbes, R.H.: U.S.<br />
Geological Survey Water-Supply Paper 425-A, 35 p.<br />
4 1 Hogan, J. 2004, Personal communication from an<br />
Adjunct Assistant Pr<strong>of</strong>essor in the University <strong>of</strong><br />
<strong>Arizona</strong> <strong>Department</strong> <strong>of</strong> Hydrology and Water<br />
Resources.<br />
42 Western Regional Climate Center website, 2004,<br />
www.wrcc.dri.edu<br />
32<br />
Tellman, B., Yarde, R., and Wallace, M.G., 1997,<br />
<strong>Arizona</strong>’s changing rivers: How people have affected<br />
rivers: Water Resources Research Center, University<br />
<strong>of</strong> <strong>Arizona</strong>, 198 p.<br />
33<br />
Towne, D.C., and Freark, M.C., 1999, Ambient<br />
groundwater quality <strong>of</strong> the Willcox basin: A 1999<br />
baseline study: <strong>Arizona</strong> <strong>Department</strong> <strong>of</strong> <strong>Environmental</strong><br />
<strong>Quality</strong> Open File Report 01-09, 55 p.<br />
43<br />
Oppenheimer, J.M., and Sumner, J.S., 1980, Depth-tobedrock<br />
map, <strong>Basin</strong> and Range province, <strong>Arizona</strong>:<br />
Tucson, University <strong>of</strong> <strong>Arizona</strong>, <strong>Department</strong> <strong>of</strong><br />
Geosciences, Laboratory <strong>of</strong> Geophysics, 1 sheet, scale<br />
1:1,000,000.<br />
44<br />
Harris, Raymond, 2004, Personal communication from<br />
<strong>Arizona</strong> Geological Survey staff member.<br />
34<br />
U.S. <strong>Environmental</strong> Protection Agency, 1993, A pocket<br />
guide to the requirements for the operators <strong>of</strong> small<br />
water systems: U.S. <strong>Environmental</strong> Protection Agency<br />
Region 9, 3 rd edition, 47 p.<br />
35<br />
U.S. Salinity Laboratory, 1954, Diagnosis and<br />
improvement <strong>of</strong> saline and alkali soils: U.S.<br />
<strong>Department</strong> <strong>of</strong> Agriculture Handbook No. 60, 233 p.<br />
44
Appendix A. Basic Data on Sample Sites, <strong>San</strong> <strong>Simon</strong> <strong>Sub</strong>-<strong>Basin</strong><br />
Site # Cadastral /<br />
Pump Type<br />
Latitude -<br />
Longitude<br />
ADWR<br />
#<br />
ADEQ #<br />
Site<br />
Name<br />
Sample Type<br />
Well<br />
Depth<br />
Water<br />
Depth<br />
Aquifer/<br />
Geology<br />
1 st Field Trip, June 12-13, 1997 - Wallin & Hall<br />
S-A<br />
(D-10-28)36aad<br />
Artesian<br />
32°31'24.049"<br />
109°25'32.814"<br />
615746 34438 BLM Hot<br />
Well<br />
Inorganic 1920' -- Lower Aquifer<br />
Alluvium<br />
S-B/C<br />
(D-12-29)16bcc<br />
Windmill<br />
32°23'25.710"<br />
109°23'51.829"<br />
622814 35773 Antelope<br />
Well<br />
Inorganic 836' 104' Lower Aquifer<br />
Alluvium<br />
S-D<br />
(D-13-28)23dbc<br />
Turbine pump<br />
32°17'06.819"<br />
109°27'26.984"<br />
618354 36966 Hale #1 Inorganic 750' 407' Lower Aquifer<br />
Alluvium<br />
S-E<br />
(D-13-28)23ddc<br />
Turbine pump<br />
32°16'54.000"<br />
109°27'26.000"<br />
-- 36967 Hale #2 Inorganic<br />
Pesticides<br />
700' 415' Lower Aquifer<br />
Alluvium<br />
S-F<br />
(D-13-29)20ccc<br />
Turbine pump<br />
32°16'44.751"<br />
109°24'57.370"<br />
618349 36993 Hale #3 Inorganic, Radiochem<br />
Pesticides<br />
700' 327' Lower Aquifer<br />
Alluvium<br />
S-G<br />
(D-13-31)20ada<br />
Turbine pump<br />
32°17'23.985"<br />
109°11'36.590"<br />
-- 37177 Owens Inorganic<br />
Radiochem<br />
-- 73' Lower Aquifer<br />
Alluvium<br />
S-H<br />
(D-13-31)28baa<br />
Turbine pump<br />
32°16'44.251"<br />
109°11'06.187"<br />
620750 37192 Marquez Inorganic<br />
Pesticides<br />
600' 120' Lower Aquifer<br />
Alluvium<br />
S-I<br />
(D-14-31)06adc<br />
Turbine pump<br />
32°14'33.000"<br />
109°12'55.000"<br />
622763 38192 Parker #1 Inorganic 100' 58' Upper Aquifer<br />
Alluvium<br />
S-J<br />
(D-14-31)10aaa<br />
Turbine pump<br />
32°14'11.215"<br />
109°09'31.690"<br />
611805 38207 Chapman<br />
#1<br />
Inorganic 750' 166' Lower Aquifer<br />
Alluvium<br />
S-K<br />
S-L<br />
(D-14-31)10aba<br />
Turbine pump<br />
(D-14-31)10daa<br />
Turbine pump<br />
32°14'10.798"<br />
109°09'46.599"<br />
32°13'42.542"<br />
109°09'30.998"<br />
611804 38208 Chapman<br />
#2<br />
611807 38215 Chapman<br />
#3<br />
Inorganic<br />
Radiochem<br />
Pesticides<br />
847' 143' Lower Aquifer<br />
Alluvium<br />
Inorganic 100' 44' Upper Aquifer<br />
Alluvium<br />
S-M<br />
(D-14-31)16dcc<br />
<strong>Sub</strong>mersible pump<br />
32°14'25.879"<br />
109°11'01.952"<br />
615986 38255 Parker #2 Inorganic 2000' 72' Lower Aquifer<br />
Alluvium<br />
S-N<br />
(D-14-31)29bcc1<br />
<strong>Sub</strong>mersible pump<br />
32°11'10.900"<br />
109°12'34.149"<br />
607142 38309 Parker #3 Inorganic 200' 103' Upper Aquifer<br />
Alluvium<br />
S-O<br />
(D-14-31)29bcc2<br />
Turbine pump<br />
32°11'05.000"<br />
109°12'34.134"<br />
607136 56595 Parker #4 Inorganic 1200' 80' Lower Aquifer<br />
Alluvium<br />
S-P<br />
(D-15-31)06aaa<br />
Windmill<br />
32°09'41.000"<br />
109°12'39.000"<br />
616049 39175 Parker<br />
Windmll<br />
Inorganic<br />
Radiochem<br />
154' -- Upper Aquifer<br />
Alluvium<br />
2 ne Field Trip, July 31, 2001 - Towne & Boettcher<br />
SS-1<br />
SS-2<br />
SS-3/4<br />
(D-10-28)36aad<br />
Artesian<br />
(D-11-29)36cbb<br />
Artesian<br />
(D-11-29)01cdd<br />
<strong>Sub</strong>mersible pump<br />
32°31'24.049"<br />
109°25'32.814"<br />
32°90'045.446"<br />
110°22'08.235"<br />
32°15'41.795"<br />
110°20'50.617"<br />
615746 34438 BLM Hot<br />
Well<br />
-- 35003 Howard<br />
Well<br />
643384 59954 Rabbit<br />
Farm Well<br />
Inorganic Radon<br />
O,H isotopes<br />
3rd t Field Trip, May 6-8, 2002 -Towne & Harmon (Equipment Blank = SS-14)<br />
1920' ' Lower Aquifer<br />
Alluvium<br />
Inorganic ' ' Lower Aquifer<br />
Alluvium<br />
Inorganic ' ' Lower Aquifer<br />
Alluvium<br />
SS-5<br />
(D-9-29)13bdc<br />
<strong>Sub</strong>mersible pump<br />
32°39'04.783"<br />
109°19'59.181"<br />
615671 34052 Hackberry<br />
RanchWell<br />
Inorganic, Radiochem,<br />
Radon, O, H isotopes<br />
500' 260' Lower Aquifer<br />
Alluvium<br />
SS-6/7<br />
(D-9-29)34ddd<br />
<strong>Sub</strong>mersible pump<br />
32°35'57.827"<br />
109°21'28.242"<br />
615672 34053 West Well Inorganic<br />
O, H isotopes<br />
365' 304' Lower Aquifer<br />
Alluvium<br />
SS-8<br />
(D-8-29)22caa<br />
Windmill<br />
32°43'20.298"<br />
109°21'55.291"<br />
803573 33415 Rock Well Inorganic<br />
O, H isotopes<br />
-- -- Lower Aquifer<br />
Alluvium<br />
SS-9<br />
(D-9-30)33dcd<br />
Windmill<br />
32°35'57.968"<br />
109°16'29.297"<br />
615676 34055 Clay Well Inorganic, Radon<br />
O, H isotopes<br />
300' 100' Bedrock<br />
Volcanic<br />
SS-10<br />
(D-10-30)27ddd<br />
<strong>Sub</strong>mersible pump<br />
32°31'35.891"<br />
109°15'09.968"<br />
615747 59757 Delong<br />
RanchWell<br />
Inorganic, Radiochem,<br />
Radon, O, H isotopes<br />
-- -- Lower Aquifer<br />
Alluvium<br />
SS-11<br />
(D-11-30)15ccb<br />
<strong>Sub</strong>mersible pump<br />
32°28'19.009"<br />
109°16'37.797"<br />
615822 35006 Joy Valley<br />
Well<br />
Inorganic<br />
O, H isotopes<br />
160' 139' Lower Aquifer<br />
Alluvium<br />
45
Appendix A. Basic Data on Sample Sites, <strong>San</strong> <strong>Simon</strong> <strong>Sub</strong>-<strong>Basin</strong>--Continued<br />
Site # Cadastral /<br />
Pump Type<br />
SS-12<br />
SS-13<br />
SS-15<br />
SS-16<br />
SS-17<br />
SS-18<br />
SS-19/20<br />
SS-21<br />
SS-22<br />
SS-23<br />
SS-24<br />
(D-11-30)31ccb<br />
Windmill<br />
(D-12-31)026aac<br />
<strong>Sub</strong>mersible pump<br />
(D-12-29)25ddc<br />
Windmill<br />
(D-12-30)28bdd<br />
Windmill<br />
(D-13-30)03bdd<br />
Windmill<br />
(D-12-29)16bcc<br />
Windmill<br />
(D-11-30)01ccc<br />
<strong>Sub</strong>mersible pump<br />
(D-13-30)15daa<br />
Windmill<br />
(D-13-31)22cac<br />
Windmill<br />
(D-12-31)24dac<br />
<strong>Sub</strong>mersible pump<br />
(D-13-31)06caa<br />
Windmill<br />
Latitude -<br />
Longitude<br />
32°25'45.863"<br />
109°19'38.509"<br />
32°25'32.474"<br />
109°12'48.950"<br />
32°21'14.018"<br />
109°20'00.144"<br />
32°21'47.344"<br />
109°17'17.249"<br />
32°19'47.362"<br />
109°16'20.129"<br />
32°23'25.317"<br />
109°23'51.709"<br />
32°29'47.610"<br />
109°14'28.680"<br />
32°18'02.123"<br />
109°15'42.190"<br />
32°17'01.596"<br />
109°10'18.204"<br />
32°22'34.016"<br />
109°07'47.783"<br />
32°19'40.352"<br />
109°13'12.993"<br />
ADWR # ADEQ # Site<br />
Name<br />
615823 35007 Ltl. Artesian<br />
Well<br />
Sample Type<br />
Inorganic, Radon<br />
O, H isotopes<br />
533248 59955 Wolf Well Inorganic, Radiochem,<br />
O, H isotopes<br />
643393 59758 West Well Inorganic, Radon<br />
O, H isotopes<br />
643397 35778 Yellowhammer<br />
Well<br />
622811 59759 Headquarter<br />
Well<br />
622814 35773 Antelope<br />
Well<br />
Inorganic<br />
O, H isotopes<br />
Inorganic<br />
O, H isotopes<br />
Inorganic<br />
O, H isotopes<br />
622826 59760 North Well Inorganic, Radiochem,<br />
Radon, O, H isotopes<br />
622806 59761 Garrett<br />
Ranch Well<br />
Inorganic<br />
O, H isotopes<br />
615939 37188 Matt Well Inorganic, Radon<br />
O, H isotopes<br />
622802 35784 McKenzie<br />
Ranch Well<br />
Inorganic, Radiochem,<br />
O, H isotopes<br />
622817 59762 Copper Well Inorganic<br />
O, H isotopes<br />
4th Field Trip, May 15-16,, 2002 - Towne & Horsley (Equipment Blank SS-34)<br />
Well<br />
Depth<br />
Water<br />
Depth<br />
Aquifer/<br />
Geology<br />
800' 1' Lower Aquifer<br />
Alluvium<br />
320' 210' Bedrock<br />
Volcanic<br />
61' 50' Upper Aquifer<br />
Alluvium<br />
47' 15' Upper Aquifer<br />
Alluvium<br />
1075' 50' Lower Aquifer<br />
Alluvium<br />
836' 150' Lower Aquifer<br />
Alluvium<br />
437' 200' Lower Aquifer<br />
Alluvium<br />
1100' 25' Lower Aquifer<br />
Alluvium<br />
200' 100' Lower Aquifer<br />
Alluvium<br />
410' 10' Bedrock<br />
Volcanic<br />
600' 110' Lower Aquifer<br />
Alluvium<br />
SS-25<br />
SS-26<br />
SS-27<br />
(D-11-26)23bcc<br />
Windmill<br />
(D-12-27)17dcc<br />
Windmill<br />
(D-14-28)14cbc<br />
Windmill<br />
32°27'52.420"<br />
109°40'14.474"<br />
32°23'003.101"<br />
109°36'35.487"<br />
32°12'52.961"<br />
109°27'53.997"<br />
SS-28 (D-15-28)12acc 32°08'43.531"<br />
109°26'23.106"<br />
SS-29/30<br />
SS-31a<br />
(D-13-28)35bcb<br />
Windmill<br />
(D-14-32)11dab<br />
Windmill<br />
32°15'45.848"<br />
109°27'54.696"<br />
32°13'42.290"<br />
109°02'56.135"<br />
SS-31/32 (D-18-31)08bcb 31°52'57.381"<br />
109°12'24.427"<br />
SS-33 (D-17-30)33abc 31°55'01.609"<br />
109°16'41.420"<br />
SS-35 (D-17-30)33dcd 31°54'21.500"<br />
109°16'37.865"<br />
615819 34984 State Land<br />
Windmill<br />
615872 35689 State Land<br />
Windmill<br />
Inorganic, Radiochem,<br />
Radon, O, H isotopes<br />
Inorganic<br />
O, H isotopes<br />
515729 59773 Peterson Inorganic<br />
O, H isotopes<br />
-- 39146 Apache<br />
Spring<br />
615927 59774 State Land<br />
Windmill<br />
59775 Section 11<br />
Windmill<br />
-- 41492 Unnamed<br />
Spring<br />
-- 59776 Barclay<br />
Spring<br />
-- 40799 Lw Rustler<br />
Spring<br />
Inorganic,<br />
Radon, O, H isotopes<br />
Inorganic, Radiochem,<br />
O, H isotopes<br />
Inorganic<br />
O, H isotopes<br />
Inorganic, Radiochem,<br />
Radon, O, H isotopes<br />
Inorganic<br />
O, H isotopes<br />
Inorganic, Radon<br />
O, H isotopes<br />
5th Field Trip, May 29-31, 2002 -Towne & Harmon (Equipment Blank = SS-42)<br />
500' ' Bedrock<br />
Granite<br />
500' 375' Lower Aquifer<br />
Alluvium<br />
160' 23' Bedrock<br />
Granite<br />
-- -- Bedrock<br />
Granite<br />
640' 378' Lower Aquifer<br />
Alluvium<br />
-- -- Upper Aquifer<br />
Alluvium<br />
-- -- Bedrock<br />
Sedimentary<br />
-- -- Bedrock<br />
Volcanic<br />
-- -- Bedrock<br />
Volcanic<br />
SS-36<br />
(D-11-26)09bcc<br />
Windmill<br />
32°29'33.591"<br />
109°42'15.952"<br />
615817 34981 WA Well Inorganic,<br />
O, H isotopes<br />
70' 49' Bedrock<br />
Granite<br />
SS-37<br />
(D-12-26)10acc<br />
Windmill<br />
32°24'20.473"<br />
109°40'43.110"<br />
615864 59790 - Inorganic, Radiochem,<br />
Radon, O, H isotopes<br />
600' 550' Upper Aquifer<br />
Alluvium<br />
SS-38<br />
(D-17-31)27aca<br />
<strong>Sub</strong>mersible pump<br />
31°55'11.338"<br />
109°09'37.869"<br />
602720 40829 Silver Creek<br />
Well<br />
Inorganic, Radiochem,<br />
Radon, O, H isotopes<br />
500' 180' Bedrock<br />
Sedimentary<br />
SS-39<br />
(D-18-32)26add<br />
<strong>Sub</strong>mersible pump<br />
31°50'04.480"<br />
109°03'07.277"<br />
623073 59793 Cloudt Well Inorganic, Radon<br />
O, H isotopes<br />
160' 145' Alluvial Aquifer<br />
Alluvium<br />
SS-40<br />
(D-19-32)28ccc<br />
Turbine pump<br />
31°44'28.148"<br />
109°05'09.473"<br />
605460 41977 Many Wells<br />
Well<br />
Inorganic<br />
O, H isotopes<br />
510' 172' Alluvial Aquifer<br />
Alluvium<br />
46
Appendix A. Basic Data on Sample Sites, <strong>San</strong> <strong>Simon</strong> <strong>Sub</strong>-<strong>Basin</strong>--Continued<br />
Site # Cadastral /<br />
Pump Type<br />
SS-41<br />
SS-43/44<br />
SS-45<br />
SS-46<br />
(D-19-32)33ddc<br />
<strong>Sub</strong>mersible pump<br />
(D-21-31)08dac<br />
<strong>Sub</strong>mersible pump<br />
(D-20-32)22bbb<br />
Windmill<br />
(C-30-22)13cab<br />
Windmill<br />
Latitude -<br />
Longitude<br />
31°43'35.996"<br />
109°04'13.488"<br />
31°37'57.952"<br />
109°10'44.287"<br />
31°40'55.841"<br />
109°04'10.736"<br />
31°41'45.203"<br />
109°02'00.345"<br />
ADWR # ADEQ # Well<br />
Name<br />
620644 41984 3 Triangle<br />
Well<br />
642414 59792 Gibbons<br />
Ranch<br />
620643 42670 South<br />
Windmill<br />
-- 59794 Clover<br />
Well<br />
Sample Type<br />
Inorganic,<br />
Radon, O, H isotopes<br />
Inorganic<br />
Radon, O, H isotopes<br />
Inorganic<br />
O, H isotopes<br />
Inorganic, Radiochem,<br />
O, H isotopes<br />
6th Field Trip, June 11-14, 2002 - Towne & Harmon (Equipment Blank SS-64)<br />
Well<br />
Depth<br />
Water<br />
Depth<br />
Aquifer/<br />
Geology<br />
480' 378' Alluvial Aquifer<br />
Alluvium<br />
700' 600' Alluvial Aquifer<br />
Alluvium<br />
510' 375' Alluvial Aquifer<br />
Alluvium<br />
-- -- Alluvial Aquifer<br />
Alluvium<br />
SS-47<br />
SS-48<br />
SS-49<br />
SS-50<br />
SS-51<br />
SS-52<br />
SS-53/54<br />
SS-55<br />
SS-56<br />
SS-57<br />
SS-58/59<br />
SS-60<br />
SS-61<br />
SS-62<br />
SS-63<br />
SS-65<br />
(D-12-26)28bbd<br />
Windmill<br />
(D-11-25)36abc<br />
Windmill<br />
(D-13-25)12abb<br />
Windmill<br />
(D-13-26)10cca<br />
Windmill<br />
(D-14-31)36dcd<br />
Turbine pump<br />
(D-15-32)06d<br />
Turbine pump<br />
(D-14-31)25bcd<br />
Turbine pump<br />
(D-15-30)17ad<br />
Windmill<br />
(D-15-30)15ddd<br />
<strong>Sub</strong>mersible pump<br />
(D-15-29)15acd<br />
<strong>Sub</strong>mersible pump<br />
(D-21-31)23ccc<br />
<strong>Sub</strong>mersible pump<br />
(C-26-21)24baa<br />
Turbine pump<br />
(D-15-32)34dcd<br />
<strong>Sub</strong>mersible pump<br />
(D-20-30)36caa<br />
<strong>Sub</strong>mersible pump<br />
(D-19-32)18cbd<br />
<strong>Sub</strong>mersible pump<br />
(D-17-31)26acc<br />
Windmill<br />
32°21'55.706"<br />
109°42'10.126"<br />
32°26'21.452"<br />
109°44'45.304"<br />
32°19'28.935"<br />
109°44'47.257"<br />
32°18'49.101"<br />
109°40'58.515"<br />
32°09'50.620"<br />
109°07'45.309"<br />
32°08'55.727"<br />
109°06'51.189"<br />
32°11'06.813"<br />
109°08'10.347"<br />
32°07'38.225"<br />
109°17'43.211"<br />
32°07'16.186"<br />
109°15'45.525"<br />
32°07'54.617"<br />
109°22'08.842"<br />
31°34'59.003"<br />
109°09'53.309"<br />
32°02'11.113"<br />
109°02'32.076"<br />
32°03'09.481"<br />
109°02'49.720"<br />
31°38'47.412"<br />
109°14'13.307"<br />
31°46'29.497"<br />
109°06'55.748"<br />
31°55'05.737"<br />
109°08'38.620"<br />
615867 35682 State Land<br />
Windmill<br />
615815 49298 Wood Cyn<br />
Windmill<br />
615911 36846 State Land<br />
Windmill<br />
615916 36884 State Land<br />
Windmill<br />
Inorganic<br />
Radon, O, H isotopes<br />
Inorganic, Radiochem,<br />
Radon, O, H isotopes<br />
Inorganic, Radiochem,<br />
Radon, O, H isotopes<br />
Inorganic, Radiochem,<br />
O, H isotopes<br />
624194 59968 Bohlender Inorganic, Radon<br />
O, H isotopes<br />
616712 39195 Bohlender Inorganic<br />
O, H isotopes<br />
626398 59831 Bohlender Inorganic<br />
O, H isotopes<br />
802388 59832 Cross J<br />
Windmill<br />
-- 59833 Dunn<br />
Spring<br />
642724 39163 Maulkins<br />
RanchWell<br />
Inorganic, Radiochem,<br />
Radon, O, H isotopes<br />
Inorganic, Radon<br />
O, H isotopes<br />
Inorganic, Radiochem<br />
Radon O, H isotopes<br />
642412 59834 Gibbons Inorganic, Radon<br />
O, H isotopes<br />
-- 59981 Lake Well Inorganic<br />
O, H isotopes<br />
-- 59982 State Line<br />
Well<br />
Inorganic<br />
O, H isotopes<br />
648082 42652 Gibbons Inorganic,<br />
Radon, O, H isotopes<br />
577580 59835 Dennison Inorganic, Radiochem,<br />
O, H isotopes<br />
612941 40819 Portal Land<br />
Co. Well<br />
Inorganic,<br />
Radon, O, H isotopes<br />
500' 280' Upper Aquifer<br />
Alluvium<br />
500' 250' Bedrock<br />
Granite<br />
200' 40' Bedrock<br />
Granite<br />
300' 75' Bedrock<br />
Granite<br />
800' 220' Alluvial Aquifer<br />
Alluvium<br />
915' 100' Alluvial Aquifer<br />
Alluvium<br />
810' 215' Alluvial Aquifer<br />
Alluvium<br />
100' 40' Bedrock<br />
Sedimentary<br />
-- -- Bedrock<br />
Sedimentary<br />
40' ' Bedrock<br />
Granite<br />
900' 600' Bedrock<br />
Basaltic<br />
200' 40' Alluvial Aquifer<br />
Alluvium<br />
Alluvial Aquifer<br />
Alluvium<br />
800' 710' Alluvial Aquifer<br />
Alluvium<br />
465' 336' Alluvial Aquifer<br />
Alluvium<br />
275' 80' Bedrock<br />
Sedimentary<br />
SS-66 (D-18-31)08 -- -- -- Cave Creek O, H isotopes - - Surface Water<br />
SS-67<br />
(D-15-30)35bbb<br />
Windmill<br />
32°05'19.715"<br />
109°15'32.620"<br />
– 39170 Windmill Inorganic,<br />
Radon, O, H isotopes<br />
– -- Bedrock<br />
Volcanic<br />
7th Field Trip, September 10-13, 2002 - Towne & Mihalic (Equipment Blanks SS-76 & 77)<br />
SS-68<br />
(D-11-28)31ccd<br />
Windmill<br />
32°25'44.654"<br />
109°31'51.992"<br />
615821 34990 Corral<br />
Well<br />
Inorganic<br />
Radon, O, H isotopes<br />
169' 62' Upper Aquifer<br />
Alluvium<br />
SS-69/70<br />
(D-12-28)27ccb<br />
Turbine pump<br />
32°21'22.753"<br />
109°28'59.531"<br />
625837 35738 Irrigation<br />
Well<br />
Inorganic, O, H isotopes 800' ' Lower Aquifer<br />
Alluvium<br />
SS-71/72<br />
(D-13-31)20dad<br />
<strong>Sub</strong>mersible pump<br />
32°17'01.406"<br />
109°11'50.875"<br />
621287 37182 Trailer<br />
Well<br />
Inorganic, Radon,<br />
O, H isotopes<br />
300' ' Upper Aquifer<br />
Alluvium<br />
47
Appendix A. Basic Data on Sample Sites, <strong>San</strong> <strong>Simon</strong> <strong>Sub</strong>-<strong>Basin</strong>--Continued<br />
Site # Cadastral /<br />
Pump Type<br />
SS-73/74<br />
SS-75<br />
SS-78<br />
(D-13-31)21ccd<br />
<strong>Sub</strong>mersible pump<br />
(D-13-32)09abd<br />
Windmill<br />
(D-16-31)29bdd<br />
<strong>Sub</strong>mersible pump<br />
Latitude -<br />
Longitude<br />
32°16'44.146"<br />
109°11'06.031"<br />
32°19'22.270"<br />
109°07'47.783"<br />
32°00'28.264"<br />
109°11'43.154"<br />
SS-79/80 (D-19-30)15ddd 31°46'19.161"<br />
109°15'36.096"<br />
SS-81<br />
SS-82<br />
(D-14-31)04ada<br />
Turbine pump<br />
(D-14-31)10bbb<br />
Turbine pump<br />
32°14'50.574"<br />
109°10'43.371"<br />
32°14'01.929"<br />
109°10'18.794"<br />
ADWR # ADEQ # Well<br />
Name<br />
-- 62317 Marques<br />
HouseWell<br />
615940 37271 CowSpring<br />
Well<br />
Sample Type<br />
Inorganic, Radon,<br />
O, H isotopes<br />
Inorganic, Radon<br />
O, H isotopes<br />
647868 39977 Tank Well Inorganic, Radiochem,<br />
O, H isotopes<br />
-- 60555 Price<br />
Spring<br />
541143 60240 Irrigation<br />
Well<br />
621226 38210 Noland<br />
Well<br />
Inorganic, Radiochem,<br />
Radon, O, H isotopes<br />
Inorganic &<br />
O, H isotopes<br />
Inorganic &<br />
O, H isotopes<br />
Well<br />
Depth<br />
Water<br />
Depth<br />
Aquifer/<br />
Geology<br />
125' - Upper Aquifer<br />
Alluvium<br />
40' - Bedrock<br />
Volcanic<br />
195' 80' Bedrock<br />
Sedimentary<br />
- - Bedrock<br />
Volcanic<br />
750' 120' Lower Aquifer<br />
Alluvium<br />
100 50' Upper Aquifer<br />
Alluvium<br />
48
Appendix B. Groundwater <strong>Quality</strong> Data, <strong>San</strong> <strong>Simon</strong> <strong>Sub</strong>-<strong>Basin</strong><br />
Site #<br />
MCL<br />
Exceedances<br />
Temp<br />
( o C)<br />
pH-field<br />
(su)<br />
pH-lab<br />
(su)<br />
SC-field<br />
(μS/cm)<br />
SC-lab<br />
(μS/cm)<br />
T. Alk<br />
(mg/L)<br />
TDS<br />
(mg/L)<br />
Hardness<br />
(mg/L)<br />
Hard (cal)<br />
(mg/L)<br />
S-A TDS, SO 4 , F, As* 42.1 8.17 8.5 1673 1465 160 990 22 - --<br />
S-B/C TDS, Cl, SO 4, , F,<br />
As*<br />
Turbidity<br />
(NTU)<br />
27.4 8.21 8.05 2110 2100 140 1400 67.5 - 1.07<br />
S-D TDS, SO 4 28.4 7.38 7.9 1229 1200 110 850 390 - 0.27<br />
S-E TDS, SO 4 26.6 7.21 8.0 1312 1300 120 890 400 - 4.0<br />
S-F - 27.3 7.78 8.0 396 400 140 270 85 - 0.09<br />
S-G F 31.2 7.83 8.2 375 380 110 260 85 - 0.01<br />
S-H TDS, SO 4 , F 21.5 7.54 8.1 1338 1300 200 940 300 - 0.33<br />
S-I TDS, SO 4 , F 20.9 7.17 7.9 2440 2400 250 1800 550 - 0.96<br />
S-J - 27.3 7.64 7.9 410 410 120 290 130 - 0.09<br />
S-K Fe 27.9 7.65 7.7 445 450 110 320 160 - 0.07<br />
S-L TDS, Cl, SO 4 ,<br />
NO 3 -N, F, Be<br />
20.4 6.90 7.2 5520 5500 300 4600 1300 - 0.09<br />
S-M pH, F, As* 24.9 8.86 8.8 258 260 74 180 20 - 0.13<br />
S-N - 21.9 7.44 8.1 627 620 160 420 200 - 0.03<br />
S-O F 32.6 7.94 8.1 491 500 140 340 64 - 0.08<br />
S-P - 22.9 7.65 8.0 581 570 160 390 200 - 6.3<br />
SS-1 TDS,SO 4 , F, As 40.5 8.47 8.6 1540 1700 160 1000 18 16 0.02<br />
SS-2 pH, TDS, F, As 31.6 8.85 8.9 1008 1000 200 620 22 20 0.06<br />
SS-3/4 pH, TDS, F, As* 29.4 8.99 9.0 1151 1200 210 800 ND ND 0.03<br />
SS-5 TDS, F 23.4 8.01 8.0 818 860 170 530 130 130 0.05<br />
SS-6/7 pH, TDS, F, As* 28.8 8.64 8.55 1092 1100 245 700 13.5 14 0.07<br />
SS-8 TDS 26.8 8.01 7.8 1419 1400 86 860 140 140 21<br />
SS-9 TDS, SO 4 , As* 24.1 7.99 8.0 1343 1400 170 880 100 100 1.2<br />
SS-10 TDS, Cl, SO 4 , As* , 35.1 8.26 8.4 2312 2400 110 1500 56 59 0.05<br />
SS-11 TDS, F 26.4 8.38 8.3 1313 1400 250 850 35 35 0.23<br />
SS-12 TDS, SO 4 , F, As* 26.4 8.29 8.3 995 1000 110 680 71 78 0.23<br />
SS-13 - 24.8 8.09 8.0 436 450 190 290 100 100 0.41<br />
SS-15 TDS, SO 4 , F 22.2 7.96 8.1 1469 1500 220 1100 130 120 0.18<br />
SS-16 TDS, F, As* 22.5 7.52 7.6 1023 1100 400 690 100 100 0.33<br />
SS-17 TDS, F, As* 23.3 7.85 7.9 808 870 240 560 110 100 0.49<br />
bold = parameter level exceeds Primary or Secondary MCL<br />
ND = not detected above minimum reporting level<br />
* = concentration exceeds the revised arsenic SDW Primary MCL which becomes effective in 2006 F = Fluoride Primary MCL exceedance<br />
49
Appendix B. Groundwater <strong>Quality</strong> Data, <strong>San</strong> <strong>Simon</strong> <strong>Sub</strong>-<strong>Basin</strong>--Continued<br />
Site #<br />
MCL<br />
Exceedances<br />
SS-18 TDS, Cl, SO 4 ,<br />
F,As* ,<br />
SS-19/20 TDS, Cl, SO 4 ,<br />
F,As* ,<br />
Temp<br />
( o C)<br />
pH-field<br />
(su)<br />
pH-lab<br />
(su)<br />
SC-field<br />
(μS/cm)<br />
SC-lab<br />
(μS/cm)<br />
T. Alk<br />
(mg/L)<br />
TDS<br />
(mg/L)<br />
Hardness<br />
(mg/L)<br />
Hard (cal)<br />
(mg/l)<br />
Turbidity<br />
(NTU)<br />
27.7 8.29 8.2 2170 2300 140 1300 51 52 4.0<br />
42.3 7.19 7.4 3129 3200 275 2100 230 225 0.29<br />
SS-21 pH, TDS, F, As* 25.2 9.02 8.9 1563 1700 710 1000 ND ND 1.0<br />
SS-22 F 24.5 8.32 7.8 308 330 100 240 30 38 2.7<br />
SS-23 - 25.7 7.14 7.0 375 390 150 270 71 77 0.18<br />
SS-24 F, As* 22.8 8.09 7.9 596 640 170 430 73 79 0.51<br />
SS-25 F, Be 24.8 7.05 6.8 347 350 130 210 110 110 0.56<br />
SS-26 - 28.6 7.87 7.7 492 490 150 290 61 64 4.5<br />
SS-27 TDS, F, Fe, Mn 24.2 7.09 7.6 883 880 260 540 310 310 46<br />
SS-28 - -- 7.22 7.4 617 590 240 340 280 280 0.02<br />
SS-29/30 - 25.6 7.82 7.85 529 525 150 320 120 120 3.5<br />
SS-31a TDS 20.4 8.08 7.9 942 940 170 570 170 170 0.40<br />
SS-31/32 TDS, SO 4 24.8 7.30 7.1 1384 1350 130 1100 735 750 0.06<br />
SS-33 - 11.7 8.21 6.7 95 85 25.1 56 26 30 0.09<br />
SS-35 - 10.0 7.02 6.6 82 79 28 60 26 28 1.0<br />
SS-36 TDS 39.0 7.34 7.4 932 930 330 590 340 350 0.04<br />
SS-37 - 25.8 7.70 7.2 307 320 120 190 83 83 26<br />
SS-38 TDS, SO 4 22.5 7.11 7.1 1317 1400 240 1100 760 770 0.15<br />
SS-39 F 22.3 8.27 7.8 257 265 88 200 50 52 0.03<br />
SS-40 - 22.2 7.85 7.3 181 180 74 130 58 61 0.37<br />
SS-41 - 22.4 7.58 7.2 166 180 69 130 58 60 0.16<br />
SS-43/44 - 28.4 7.68 7.8 352 350 170 235 110 110 0.17<br />
SS-45 - 24.6 7.73 7.4 268 290 120 180 92 91 5.9<br />
SS-46 - 22.1 7.78 7.4 224 240 100 170 69 70 0.79<br />
SS-47 - 24.6 7.84 7.7 414 440 150 270 64 65 2.0<br />
SS-48<br />
pH, gross α, Fe<br />
uranium<br />
27.2 8.79 8.8 463 480 200 290 ND ND 5.5<br />
SS-49 TDS, Cl, F, gross α 28.9 7.76 7.9 1851 1900 330 1100 410 390 1.1<br />
SS-50 TDS, F, gross α 23.5 7.26 7.4 1185 1200 370 750 280 260 0.84<br />
bold = parameter level exceeds Primary or Secondary MCL<br />
ND = not detected above minimum reporting level<br />
* = concentration exceeds the revised arsenic SDW Primary MCL which becomes effective in 2006 F = Fluoride Primary MCL exceedance<br />
50
Appendix B. Groundwater <strong>Quality</strong> Data, <strong>San</strong> <strong>Simon</strong> <strong>Sub</strong>-<strong>Basin</strong>--Continued<br />
Site #<br />
MCL<br />
Exceedances<br />
Temp<br />
( o C)<br />
pH-field<br />
(su)<br />
pH-lab<br />
(su)<br />
SC-field<br />
(μS/cm)<br />
SC-lab<br />
(μS/cm)<br />
T. Alk<br />
(mg/L)<br />
TDS<br />
(mg/L)<br />
Hardness<br />
(mg/L)<br />
Hard (cal)<br />
(mg/L)<br />
SS-51 - 27.8 7.79 7.6 386 380 120 260 130 130 0.20<br />
SS-52 F 27.3 7.98 7.5 374 390 110 250 100 100 0.02<br />
Turbidity<br />
(NTU)<br />
SS-53/54 TDS, S0 4 26.3 7.60 7.5 1364 1400 140 1000 510 500 0.014<br />
SS-55 Fe, Mn 21.5 7.56 7.4 682 700 210 460 350 320 100<br />
SS-56 - 20.7 7.54 7.4 631 670 240 420 320 320 0.20<br />
SS-57 TDS 20.3 7.13 7.4 803 870 260 570 400 400 0.04<br />
SS-58/59 - 28.8 8.13 7.85 332 340 150 215 70.5 72.5 1.15<br />
SS-60 F 22.7 8.00 7.8 410 430 150 270 100 110 0.02<br />
SS-61 - 22.2 8.11 7.6 563 600 160 390 160 170 0.35<br />
SS-62 F 29.7 7.83 7.5 381 400 180 250 160 160 ND<br />
SS-63 - 24.9 7.17 6.6 118 120 33 120 18 19 2.0<br />
SS-65 - 20.3 7.46 7.4 528 550 180 350 240 240 0.82<br />
SS-67 Fe, Mn 22.5 7.28 6.8 295 310 120 190 120 120 5.5<br />
SS-68 NO 3 -- 7.34 7.5 555 560 160 370 180 180 1.4<br />
SS-69/70 - 30.2 8.12 7.3 460 480 66 300 66 69 0.04<br />
SS-71/72 pH, F 25.1 9.03 8.9 437 480 150 280 ND ND 0.48<br />
SS-73/74 TDS, S0 4 , F 25.1 7.36 6.9 1744 1900 230 1300 350 360 0.16<br />
SS-75 TDS, F -- 7.61 6.9 832 870 300 560 270 270 0.19<br />
SS-78 - 22.8 7.35 7.4 692 760 240 480 350 370 0.02<br />
SS-79/80 - 19.1 8.34 6.23 59 64 12 68 14 11 3.2<br />
SS-81 - 26.9 7.23 7.1 663 710 110 480 210 230 0.12<br />
SS-82 TDS, S0 4 ,<br />
NO 3 , F<br />
21.1 6.95 7.2 4728 5100 360 4100 1100 1200 0.18<br />
bold = parameter level exceeds Primary or Secondary MCL<br />
ND = not detected above minimum reporting level<br />
* = concentration exceeds the revised arsenic SDW Primary MCL which becomes effective in 2006 F = Fluoride Primary MCL exceedance<br />
51
Appendix B. Groundwater <strong>Quality</strong> Data, <strong>San</strong> <strong>Simon</strong> <strong>Sub</strong>-<strong>Basin</strong>--Continued<br />
Site #<br />
Calcium<br />
(mg/L)<br />
Magnesium<br />
(mg/L)<br />
Sodium<br />
(mg/L)<br />
Potassium<br />
(mg/L)<br />
Bicarbonate<br />
(mg/L)<br />
Carbonate<br />
(mg/L)<br />
Chloride<br />
(mg/L)<br />
S-A 7.9 0.63 340 3.9 220 ND 150 290<br />
Sulfate<br />
(mg/L)<br />
S-B/C 24 1.55 435 6.15 170 ND 320 435<br />
S-D 120 25 120 3.5 130 ND 150 310<br />
S-E 120 30 130 2.0 150 ND 150 320<br />
S-F 31 3.0 56 5.7 170 ND 14 40<br />
S-G 34 1.9 51 2.2 130 ND 15 59<br />
S-H 97 18 190 4.6 240 ND 50 410<br />
S-I 160 36 360 5.8 310 ND 210 750<br />
S-J 50 3.8 42 2.6 150 ND 8.9 84<br />
S-K 62 4.4 40 2.6 130 ND 15 97<br />
S-L 470 68 990 14 370 ND 380 2700<br />
S-M 8.4 ND 54 1.2 77 6.5 21 30<br />
S-N 71 11 57 1.7 200 ND 43 120<br />
S-O 26 1.7 90 2.0 170 ND 13 90<br />
S-P 66 12 50 1.4 200 ND 32 89<br />
SS-1 6.4 ND 340 3.0 180 6.7 200 310<br />
SS-2 6.2 1.2 210 2.1 210 16 58 200<br />
SS-3/4 2.2 ND 250 2.1 210 22 47 240<br />
SS-5 31 14 120 11 210 ND 74 120<br />
SS-6/7 3.05 1.65 235 6.7 235 11 105 145<br />
SS-8 38 10 220 8 100 ND 180 230<br />
SS-9 27 8.8 250 10 210 ND 140 270<br />
SS-10 18 3.4 460 16 120 4.7 370 430<br />
SS-11 9.3 3.0 280 9.4 300 ND 110 200<br />
SS-12 25 4.0 180 5.8 130 ND 33 290<br />
SS-13 28 8.7 58 3.2 230 ND 16 14<br />
SS-15 28 13 290 4.8 270 ND 49 470<br />
SS-16 26 9.4 210 1.8 490 ND 14 120<br />
SS-17 28 8.6 150 1.9 290 ND 23 140<br />
bold = parameter level exceeds Primary or Secondary MCL<br />
ND = not detected above minimum reporting level<br />
52
Appendix B. Groundwater <strong>Quality</strong> Data, <strong>San</strong> <strong>Simon</strong> <strong>Sub</strong>-<strong>Basin</strong>--Continued<br />
Site #<br />
Calcium<br />
(mg/L)<br />
Magnesium<br />
(mg/L)<br />
Sodium<br />
(mg/L)<br />
Potassium<br />
(mg/L)<br />
Bicarbonate<br />
(mg/L)<br />
Carbonate<br />
(mg/L)<br />
Chloride<br />
(mg/L)<br />
SS-18 19 1.1 440 5.5 170 ND 320 430<br />
Sulfate<br />
(mg/L)<br />
SS-19/20 78.5 7.45 600 17.5 335 ND 415 620<br />
SS-21 1.0 ND 420 2.5 760 50 12 120<br />
SS-22 13 1.4 56 3.6 120 ND 4.3 33<br />
SS-23 23 4.9 57 2.0 180 ND 9.8 32<br />
SS-24 22 5.8 110 4.6 210 ND 23 91<br />
SS-25 31 7.4 28 1.2 160 ND 12 ND<br />
SS-26 21 2.7 78 5.1 180 ND 22 37<br />
SS-27 81 27 69 1.8 320 ND 33 150<br />
SS-28 100 7.5 12 1.1 290 ND 10 46<br />
SS-29/30 40 5.2 62.5 2.8 180 ND 36.5 49.5<br />
SS-31a 47 14 120 2.8 210 ND 89 120<br />
SS-31/32 265 22 21 2.2 160 ND 4.6 645<br />
SS-33 8.4 2.1 4.1 0.87 31 ND 1.8 ND<br />
SS-35 8.4 1.6 4.3 0.89 34 ND 1.3 ND<br />
SS-36 91 31 76 ND 400 ND 28 140<br />
SS-37 28 3.2 32 2.8 150 ND 13 8.1<br />
SS-38 250 35 28 1.2 290 ND 7.7 590<br />
SS-39 19 1.2 35 2.3 110 ND 16 9.1<br />
SS-40 19 3.5 13 2.8 90 ND 6.0 4.1<br />
SS-41 19 3.1 11 2.5 84 ND 6.3 3.8<br />
SS-43/44 33 6.9 32.5 7.75 210 ND 5.25 7.5<br />
SS-45 30 4.0 22 3.6 150 ND 8.1 5.4<br />
SS-46 26 1.2 22 0.56 120 ND 6.0 4.0<br />
SS-47 17 5.6 68 0.90 180 ND 24 17<br />
SS-48 2.2 ND 110 0.56 220 12 19 6.6<br />
SS-49 100 35 250 0.73 400 ND 280 240<br />
SS-50 74 19 170 0.56 450 ND 74 180<br />
SS-51 41 5.8 30 2.0 146 ND 6.2 66<br />
bold = parameter level exceeds Primary or Secondary MCL<br />
ND = not detected above minimum reporting level<br />
53
Appendix B. Groundwater <strong>Quality</strong> Data, <strong>San</strong> <strong>Simon</strong> <strong>Sub</strong>-<strong>Basin</strong>--Continued<br />
Site #<br />
Calcium<br />
(mg/L)<br />
Magnesium<br />
(mg/L)<br />
Sodium<br />
(mg/L)<br />
Potassium<br />
(mg/L)<br />
Bicarbonate<br />
(mg/L)<br />
Carbonate<br />
(mg/L)<br />
Chloride<br />
(mg/L)<br />
SS-52 35 4.5 38 1.8 130 ND 5.8 63<br />
Sulfate<br />
(mg/L)<br />
SS-53/54 150 33 100 2.85 170 ND 94 455<br />
SS-55 100 18 17 0.85 260 ND 7.1 160<br />
SS-56 96 20 10 0.84 290 ND 8.3 98<br />
SS-57 120 24 28 1.1 320 ND 17 170<br />
SS-58/59 16 7.45 37.5 8.4 181.5 ND 5.4 5.6<br />
SS-60 39 2.2 50 2.1 180 ND 7.5 49<br />
SS-61 62 2.9 60 2.8 200 ND 9.0 120<br />
SS-62 55 6.7 16 3.7 220 ND 6.3 8.2<br />
SS-63 5.7 1.1 17 1.6 40 ND 4.0 16<br />
SS-65 80 11 18 0.99 220 ND 4.0 100<br />
SS-66 - - - - - - - -<br />
SS-67 36 6.6 16 0.66 150 ND 4.5 27<br />
SS-68 58 8 38 2.4 200 ND 15 28<br />
SS-69/70 24 2 64 1.95 80 ND 58 67<br />
SS-71/72 2.4 ND 98 1.3 160 13 5.1 47<br />
SS-73/74 110 20 265 4.9 280 ND 80 580<br />
SS-75 84 14 87 ND 370 ND 29 130<br />
SS-78 120 17 18 1.1 290 ND 7.6 160<br />
SS-79/80 4.6 1.0 5.8 1.25 16 ND 1.8 10.5<br />
SS-81 84 5.5 54 3.0 130 ND 41 170<br />
SS-82 390 55 820 10 440 ND 190 2100<br />
bold = parameter level exceeds Primary or Secondary MCL<br />
ND = not detected above minimum reporting level<br />
54
Appendix B. Groundwater <strong>Quality</strong> Data, <strong>San</strong> <strong>Simon</strong> <strong>Sub</strong>-<strong>Basin</strong>--Continued<br />
Site #<br />
Nitrate-Nitrite-N<br />
(mg/L)<br />
Nitrate - N<br />
(mg/L)<br />
Nitrite-N<br />
(mg/L)<br />
TKN<br />
(mg/L)<br />
Ammonia-N<br />
(mg/L)<br />
Phosphorus<br />
(mg/L)<br />
SAR<br />
(value)<br />
Irrigation<br />
<strong>Quality</strong><br />
S-A ND ND - 0.25 ND ND 31.5 C3 - S4<br />
S-B/C ND ND - ND ND ND 23.1 C3 - S4<br />
S-D 0.51 0.51 - 0.14 ND ND 2.6 C3 - S1<br />
S-E 0.71 0.71 - 0.20 ND ND 2.8 C3 - S1<br />
S-F 0.96 0.96 - ND ND ND 2.4 C2 - S1<br />
S-G 0.46 0.46 - 0.20 ND ND 2.3 C2 - S1<br />
S-H 6.8 6.8 - 0.37 ND ND 4.7 C2 - S1<br />
S-I 8.9 8.9 - 0.46 ND ND 6.7 C4 - S2<br />
S-J 0.62 0.62 - 0.15 ND ND 1.5 C2 - S1<br />
S-K 1.2 1.2 - 0.20 ND ND 1.3 C2 - S1<br />
S-L 31 31 - 0.78 ND ND 11.3 C4 - S4<br />
S-M ND ND - 0.22 ND ND 5.1 C2 - S1<br />
S-N 0.64 0.64 - 0.31 ND ND 1.7 C2 - S1<br />
S-O 0.31 0.31 - ND ND ND 4.6 C2 - S1<br />
S-P 0.42 0.42 - 0.15 ND ND 1.5 C2 - S1<br />
SS-1 ND ND ND 0.14 ND 0.022 37 C3 - S4<br />
SS-2 0.42 ND ND ND ND ND 20.2 C3 - S4<br />
SS-3/4 ND ND ND ND ND ND 46.4 C3 - S4<br />
SS-5 2.3 2.3 ND ND ND ND 4.5 C3 - S1<br />
SS-6/7 2.3 2.3 ND ND ND ND 27.8 C3 - S4<br />
SS-8 0.27 0.11 0.16 ND ND ND 8.2 C3 -S2<br />
SS-9 1.2 1.2 ND ND ND ND 10.7 C3 - S3<br />
SS-10 0.84 0.78 0.056 ND ND ND 26.1 C4 - S4<br />
SS-11 0.065 0.065 ND 0.065 0.040 0.024 20.4 C3 - S3<br />
SS-12 0.36 0.36 ND ND ND ND 8.8 C3 - S2<br />
SS-13 0.82 0.82 ND 0.073 ND ND 2.5 C2 - S1<br />
SS-15 0.15 0.15 ND ND ND ND 11.4 C3 - S2<br />
SS-16 0.080 0.080 ND ND ND 0.055 9 C3 - S2<br />
SS-17 0.41 0.41 ND ND ND ND 6.4 C3 - S2<br />
bold = parameter level exceeds Primary or Secondary MCL ND = not detected above minimum reporting level<br />
Irrigation <strong>Quality</strong> - C = salinity hazard, S = sodium hazard, 1 = low, 2 = medium, 3 = high, 4 = very high<br />
55
Appendix B. Groundwater <strong>Quality</strong> Data, <strong>San</strong> <strong>Simon</strong> <strong>Sub</strong>-<strong>Basin</strong>—Continued<br />
Site #<br />
Nitrate-Nitrite-N<br />
(mg/L)<br />
Nitrate - N<br />
(mg/L)<br />
Nitrite-N<br />
(mg/L)<br />
TKN<br />
(mg/L)<br />
Ammonia-N<br />
(mg/L)<br />
Phosphorus<br />
(mg/L)<br />
SAR<br />
(value)<br />
Irrigation<br />
<strong>Quality</strong><br />
SS-18 0.054 0.054 ND ND ND ND 26.6 C4 - S4<br />
SS-19/20 0.54 0.54 ND ND ND ND 17.2 C4 - S4<br />
SS-21 ND ND ND 0.82 0.34 0.10 115.7 C3 - S4<br />
SS-22 ND ND ND ND ND ND 3.9 C2 - S1<br />
SS-23 0.90 0.90 ND ND ND 0.046 2.8 C2 - S1<br />
SS-24 0.59 0.59 ND ND ND ND 5.4 C2 - S1<br />
SS-25 1.7 1.7 ND ND ND ND 1.2 C2 - S1<br />
SS-26 5.2 5.2 ND ND ND ND 4.3 C2 - S1<br />
SS-27 0.054 0.054 ND ND ND ND 1.7 C2 - S1<br />
SS-28 2.3 2.3 ND ND ND ND 0.3 C2 - S1<br />
SS-29/30 0.255 0.255 ND ND ND ND 2.5 C2 - S1<br />
SS-31a 8.6 8.6 ND 0.11 ND 0.020 4 C3 - S1<br />
SS-31/32 0.02 0.02 ND 0.065 ND 0.026 0.3 C3 - S1<br />
SS-33 0.57 0.57 ND 0.078 0.028 0.063 0.3 C1 - S1<br />
SS-35 0.13 0.13 ND ND ND 0.045 0.4 C1 - S1<br />
SS-36 0.19 0.19 ND ND ND ND 1.8 C3 - S1<br />
SS-37 2.56 2.48 0.082 0.094 0.054 0.022 1.5 C2 - S1<br />
SS-38 0.26 0.26 ND 0.056 ND ND 0.4 C3 - S1<br />
SS-39 0.96 0.96 ND ND ND ND 2.1 C2 - S1<br />
SS-40 1.0 1.0 ND ND ND 0.087 0.7 C1 - S1<br />
SS-41 0.87 0.87 ND 0.050 ND 0.038 0.6 C1 - S1<br />
SS-43/44 0.49 0.49 ND 1.4 ND ND 1.3 C2 - S1<br />
SS-45 0.60 0.60 ND ND ND ND 1 C2 - S1<br />
SS-46 0.65 0.65 ND ND ND 0.022 1.2 C1 - S1<br />
SS-47 3.5 3.5 ND ND ND ND 3.7 C2 - S1<br />
SS-48 1.3 1.3 ND 0.05 ND ND 20.4 C2 - S3<br />
SS-49 4.0 4.0 ND 0.098 ND ND 5.5 C3 - S1<br />
SS-50 0.55 0.55 ND ND ND 0.022 4.6 C3 - S1<br />
bold = parameter level exceeds Primary or Secondary MCL ND = not detected above minimum reporting level<br />
Irrigation <strong>Quality</strong> - C = salinity hazard, S = sodium hazard, 1 = low, 2 = medium, 3 = high, 4 = very high<br />
56
Appendix B. Groundwater <strong>Quality</strong> Data, <strong>San</strong> <strong>Simon</strong> <strong>Sub</strong>-<strong>Basin</strong>--Continued<br />
Site #<br />
Nitrate-Nitrite-N<br />
(mg/L)<br />
Nitrate - N<br />
(mg/L)<br />
Nitrite-N<br />
(mg/L)<br />
TKN<br />
(mg/L)<br />
Ammonia-N<br />
(mg/L)<br />
Phosphorus<br />
(mg/L)<br />
SAR<br />
(value)<br />
Irrigation<br />
<strong>Quality</strong><br />
SS-51 0.44 0.44 ND ND ND ND 1.2 C2 - S1<br />
SS-52 0.43 0.43 ND ND ND ND 1.6 C2 - S1<br />
SS-53/54 4.6 4.6 ND 0.84 ND ND 1.9 C3 - S1<br />
SS-55 0.31 0.31 ND 0.58 0.023 0.10 0.4 C2 - S1<br />
SS-56 0.95 0.95 ND 0.40 0.028 0.021 0.3 C2 - S1<br />
SS-57 0.41 0.41 ND 0.078 ND ND 0.6 C3 - S1<br />
SS-58/59 0.88 0.88 ND ND ND ND 0.9 C2 - S1<br />
SS-60 0.70 0.70 ND ND ND ND 2.1 C2 - S1<br />
SS-61 0.49 0.49 ND ND ND ND 2 C2 - S1<br />
SS-62 0.57 0.57 ND ND ND ND 0.5 C2 - S1<br />
SS-63 0.43 0.43 ND ND ND 0.16 1.7 C1 - S1<br />
SS-65 0.32 0.32 ND ND ND 0.027 0.5 C2 - S2<br />
SS-66 - - - - - - - -<br />
SS-67 0.070 0.070 ND ND 0.023 0.086 0.7 C2 - S1<br />
SS-68 18 18 ND ND ND ND 1.2 C2 - S1<br />
SS-69/70 2.0 2.0 ND ND ND ND 3.4 C2 - S1<br />
SS-71/72 ND ND ND 0.15 0.12 0.027 17.4 C2 - S3<br />
SS-73/74 8.6 8.6 ND 0.064 ND ND 6.2 C3 - S2<br />
SS-75 0.52 0.52 ND 0.070 ND 0.028 2.3 C3 - S1<br />
SS-78 1.0 1.0 ND ND ND 0.024 0.4 C3 - S1<br />
SS-79/80 ND ND ND 0.082 ND ND 0.7 C1 - S1<br />
SS-81 2.4 2.4 ND ND ND ND 1.5 C2 - S1<br />
SS-82 30 30 ND 0.38 ND 0.038 10.3 C4 - S3<br />
bold = parameter level exceeds Primary or Secondary MCL ND = not detected above minimum reporting level<br />
Irrigation <strong>Quality</strong> - C = salinity hazard, S = sodium hazard, 1 = low, 2 = medium, 3 = high, 4 = very high<br />
57
Appendix B. Groundwater <strong>Quality</strong> Data, <strong>San</strong> <strong>Simon</strong> <strong>Sub</strong>-<strong>Basin</strong>—Continued<br />
Site #<br />
Antimony<br />
(mg/L)<br />
Arsenic<br />
(mg/L)<br />
Barium<br />
(mg/L)<br />
Beryllium<br />
(mg/L)<br />
Boron<br />
(mg/L)<br />
Cadmium<br />
(mg/L)<br />
Chromium<br />
(mg/L)<br />
Copper<br />
(mg/L)<br />
S-A ND 0.032* ND ND 0.37 ND ND ND 10<br />
Fluoride<br />
(mg/L)<br />
S-B/C ND 0.043* ND ND 0.52 ND ND ND 7.45<br />
S-D ND ND ND ND 0.10 ND ND ND 0.23<br />
S-E ND ND ND ND 0.10 ND ND ND 0.51<br />
S-F ND ND ND ND ND ND ND ND 1.5<br />
S-G ND ND ND ND ND ND ND ND 2.1<br />
S-H ND ND ND ND 0.22 ND ND ND 5.3<br />
S-I ND ND ND ND 0.17 ND ND ND 4.1<br />
S-J ND ND ND ND ND ND ND 0.011 0.83<br />
S-K ND ND ND ND ND ND ND 0.064 0.93<br />
S-L ND ND ND .00061 0.68 ND ND ND 3.8<br />
S-M ND 0.022* ND ND ND ND ND ND 11<br />
S-N ND ND ND ND ND ND ND ND 0.41<br />
S-O ND ND ND ND ND ND ND ND 2.8<br />
S-P ND ND ND ND ND ND ND 0.014 0.73<br />
SS-1 ND 0.053 ND ND 0.36 ND ND ND 11<br />
SS-2 ND 0.060 ND ND 0.28 ND ND ND 6<br />
SS-3/4 ND 0.030* ND ND 0.49 ND ND ND 17<br />
SS-5 ND ND ND ND 0.27 ND ND ND 2.0<br />
SS-6/7 ND 0.012* ND ND 0.32 ND ND ND 2.1<br />
SS-8 ND ND ND ND 0.19 ND ND ND 0.89<br />
SS-9 ND 0.022* ND ND 0.40 ND ND ND 3.7<br />
SS-10 ND 0.011* ND ND 0.24 ND ND ND 0.86<br />
SS-11 ND ND ND ND 0.50 ND ND ND 2.1<br />
SS-12 ND 0.026* ND ND 0.34 ND ND ND 4.5<br />
SS-13 ND ND ND ND ND ND ND ND 1.3<br />
SS-15 ND ND ND ND 1.3 ND ND ND 2.6<br />
SS-16 ND 0.029* ND ND 0.18 ND ND ND 7.9<br />
bold = parameter level exceeds Primary or Secondary MCL ND = not detected above minimum reporting level<br />
* = concentration exceeds the revised arsenic SDWA Primary MCL <strong>of</strong> 0.01 mg/L which becomes effective in 2006<br />
58
Appendix B. Groundwater <strong>Quality</strong> Data, <strong>San</strong> <strong>Simon</strong> <strong>Sub</strong>-<strong>Basin</strong>—Continued<br />
Site #<br />
Antimony<br />
(mg/L)<br />
Arsenic<br />
(mg/L)<br />
Barium<br />
(mg/L)<br />
Beryllium<br />
(mg/L)<br />
Boron<br />
(mg/L)<br />
Cadmium<br />
(mg/L)<br />
Chromium<br />
(mg/L)<br />
Copper<br />
(mg/L)<br />
SS-17 ND 0.013* ND ND 0.19 ND ND ND 5.7<br />
Fluoride<br />
(mg/L)<br />
SS-18 ND 00.34* ND ND 0.49 ND ND ND 7.1<br />
SS-19/20 ND 0.012* ND ND 0.68 ND ND ND 4.9<br />
SS-21 ND 0.016* ND ND 4.0 ND ND ND 15<br />
SS-22 ND ND ND ND 0.14 ND ND ND 7.6<br />
SS-23 ND ND ND ND ND ND ND ND 0.71<br />
SS-24 ND 0.013* ND ND 0.36 ND ND ND 5.6<br />
SS-25 ND ND ND .0019 ND ND ND 0.016 3.6<br />
SS-26 ND ND ND ND 0.20 ND ND ND 1.1<br />
SS-27 ND ND ND ND ND ND ND ND 2.9<br />
SS-28 ND ND ND ND ND ND ND ND 0.47<br />
SS-29/30 ND ND ND ND ND ND ND ND 0.23<br />
SS-31a ND ND ND ND 0.28 ND ND ND 0.95<br />
SS-31/32 ND ND ND ND ND ND ND ND 0.91<br />
SS-33 ND ND ND ND ND ND ND ND ND<br />
SS-35 ND ND ND ND ND ND ND ND ND<br />
SS-36 ND ND ND ND ND ND ND 0.040 0.74<br />
SS-37 ND ND ND ND ND ND ND ND 0.71<br />
SS-38 ND ND ND ND ND ND ND ND 0.44<br />
SS-39 ND ND ND ND ND ND ND ND 4.1<br />
SS-40 ND ND ND ND ND ND ND ND 0.40<br />
SS-41 ND ND ND ND ND ND ND ND 0.32<br />
SS-43/44 ND ND ND ND ND ND ND ND 1.5<br />
SS-45 ND ND ND ND ND ND ND ND 0.99<br />
SS-46 ND ND ND ND ND ND ND ND 0.24<br />
SS-47 ND 0.017* ND ND 0.13 ND ND ND 1.1<br />
SS-48 ND 0.017* ND ND 0.12 ND ND 0.012 1.3<br />
SS-49 ND ND ND ND 0.30 ND ND 0.058 3.6<br />
bold = parameter level exceeds Primary or Secondary MCL ND = not detected above minimum reporting level<br />
* = concentration exceeds the revised arsenic SDWA Primary MCL <strong>of</strong> 0.01 mg/L which becomes effective in 2006<br />
59
Appendix B. Groundwater <strong>Quality</strong> Data, <strong>San</strong> <strong>Simon</strong> <strong>Sub</strong>-<strong>Basin</strong>--Continued<br />
Site #<br />
Antimony<br />
(mg/L)<br />
Arsenic<br />
(mg/L)<br />
Barium<br />
(mg/L)<br />
Beryllium<br />
(mg/L)<br />
Boron<br />
(mg/L)<br />
Cadmium<br />
(mg/L)<br />
Chromium<br />
(mg/L)<br />
Copper<br />
(mg/L)<br />
SS-50 ND ND ND ND 0.12 ND ND 0.028 2.6<br />
SS-51 ND ND ND ND ND ND ND ND 1.1<br />
Fluoride<br />
(mg/L)<br />
SS-52 ND ND ND ND ND ND ND ND 2.3<br />
SS-53/54 ND ND 0.022 ND ND ND ND ND 0.59<br />
SS-55 ND ND ND ND ND ND ND ND 0.28<br />
SS-56 ND ND ND ND ND ND ND ND 0.30<br />
SS-57 ND ND ND ND ND ND ND ND 0.72<br />
SS-58/59 ND ND ND ND ND ND ND ND 1.1<br />
SS-60 ND ND ND ND ND ND ND ND 3.0<br />
SS-61 ND ND ND ND ND ND ND ND 1.9<br />
SS-62 ND ND ND ND ND ND ND ND 2.4<br />
SS-63 ND ND ND ND ND ND ND ND 0.45<br />
SS-65 ND ND ND ND ND ND ND ND 0.62<br />
SS-66 - - - - - - - - -<br />
SS-67 ND ND ND ND ND ND ND 0.010 0.12<br />
SS-68 ND ND ND ND ND ND 0.010 ND 0.43<br />
SS-69/70 ND ND ND ND ND ND ND ND 0.49<br />
SS-71/72 ND ND ND ND 0.26 ND ND ND 14<br />
SS-73/74 ND ND ND ND 0.20 0.002 ND ND 4.2<br />
SS-75 ND ND ND ND 0.13 ND 0.027 ND 2.0<br />
SS-78 ND ND ND ND ND ND ND ND 0.82<br />
SS-79/80 ND ND ND ND ND ND ND ND 0.165<br />
SS-81 ND ND ND ND ND ND ND ND 0.72<br />
SS-82 ND ND ND ND 1.1 ND ND ND 4.2<br />
bold = parameter level exceeds Primary or Secondary MCL ND = not detected above minimum reporting level<br />
* = concentration exceeds the revised arsenic SDWA Primary MCL <strong>of</strong> 0.01 mg/L which becomes effective in 2006<br />
60
Appendix B. Groundwater <strong>Quality</strong> Data, <strong>San</strong> <strong>Simon</strong> <strong>Sub</strong>-<strong>Basin</strong>--Continued<br />
Site #<br />
Iron<br />
(mg/L)<br />
Lead<br />
(mg/L)<br />
Manganese<br />
(mg/L)<br />
Mercury<br />
(mg/L)<br />
Nickel<br />
(mg/L)<br />
Selenium<br />
(mg/L)<br />
Silver<br />
(mg/L)<br />
Thallium<br />
(mg/L)<br />
S-A ND ND ND ND - 0.009 ND ND ND<br />
S-B/C ND ND ND ND - ND ND ND 0.12<br />
Zinc<br />
(mg/L)<br />
S-D ND ND ND ND - 0.0062 ND ND ND<br />
S-E ND ND ND ND - 0.0064 ND ND 0.52<br />
S-F ND ND ND ND - ND ND ND ND<br />
S-G ND ND ND ND - ND ND ND ND<br />
S-H ND ND ND ND - ND ND ND ND<br />
S-I ND ND ND ND - 0.012 ND ND 0.055<br />
S-J ND ND ND ND - ND ND ND ND<br />
S-K 0.50 ND ND ND - ND ND ND 0.69<br />
S-L ND ND ND ND - ND ND ND ND<br />
S-M ND ND ND ND - ND ND ND ND<br />
S-N ND ND ND ND - ND ND ND ND<br />
S-O ND ND ND ND - ND ND ND ND<br />
S-P ND ND ND .00082 - ND ND ND 0.43<br />
SS-1 ND ND ND ND ND ND ND ND ND<br />
SS-2 ND ND ND ND ND ND ND ND ND<br />
SS-3/4 ND ND ND ND ND ND ND ND ND<br />
SS-5 ND ND ND ND ND ND ND ND ND<br />
SS-6/7 ND ND ND ND ND ND ND ND ND<br />
SS-8 0.19 ND ND ND ND
Appendix B. Groundwater <strong>Quality</strong> Data, <strong>San</strong> <strong>Simon</strong> <strong>Sub</strong>-<strong>Basin</strong>--Continued<br />
Site #<br />
Iron<br />
(mg/L)<br />
Lead<br />
(mg/L)<br />
Manganese<br />
(mg/L)<br />
Mercury<br />
(mg/L)<br />
Nickel<br />
(mg/L)<br />
Selenium<br />
(mg/L)<br />
Silver<br />
(mg/L)<br />
Thallium<br />
(mg/L)<br />
SS-17 ND ND ND ND ND ND ND ND ND<br />
SS-18 ND ND ND ND ND ND ND ND ND<br />
Zinc<br />
(mg/L)<br />
SS-19/20 ND ND ND ND ND ND ND ND 0.20<br />
SS-21 ND ND ND ND ND ND ND ND ND<br />
SS-22 0.068 ND ND ND ND ND ND ND 0.065<br />
SS-23 ND ND ND ND ND ND ND ND 0.16<br />
SS-24 0.058 ND ND ND ND 0.0061 ND ND ND<br />
SS-25 ND 0.014 ND ND ND ND ND ND 3.2<br />
SS-26 0.20 ND ND ND ND ND ND ND 0.27<br />
SS-27 3.9 ND 0.058 ND ND ND ND ND 0.085<br />
SS-28 ND ND ND ND ND ND ND ND ND<br />
SS-29/30 0.073 ND ND ND ND ND ND ND 0.25<br />
SS-31a ND ND ND ND ND ND ND ND 0.13<br />
SS-31/32 ND ND ND ND ND ND ND ND ND<br />
SS-33 ND ND ND ND ND ND ND ND ND<br />
SS-35 ND ND ND ND ND ND ND ND ND<br />
SS-36 ND ND ND ND ND ND ND ND ND<br />
SS-37 ND ND ND ND ND ND ND ND 0.48<br />
SS-38 ND ND ND ND ND ND ND ND ND<br />
SS-39 ND ND ND ND ND ND ND ND ND<br />
SS-40 ND ND ND ND ND ND ND ND ND<br />
SS-41 ND ND ND ND ND ND ND ND 0.084<br />
SS-43/44 ND ND ND ND ND ND ND ND 0.052<br />
SS-45 0.25 ND ND ND ND ND ND ND 0.26<br />
SS-46 ND ND ND ND ND ND ND ND 0.69<br />
SS-47 0.14 ND ND ND ND ND ND ND 0.14<br />
SS-48 0.38 ND ND ND ND ND ND ND ND<br />
SS-49 ND ND ND ND ND ND ND ND 0.093<br />
bold = parameter level exceeds Primary or Secondary MCL<br />
ND = not detected above minimum reporting level<br />
62
Appendix B. Groundwater <strong>Quality</strong> Data, <strong>San</strong> <strong>Simon</strong> <strong>Sub</strong>-<strong>Basin</strong>--Continued<br />
Site #<br />
Iron<br />
(mg/L)<br />
Lead<br />
(mg/L)<br />
Manganese<br />
(mg/L)<br />
Mercury<br />
(mg/L)<br />
Nickel<br />
(mg/L)<br />
Selenium<br />
(mg/L)<br />
Silver<br />
(mg/L)<br />
Thallium<br />
(mg/L)<br />
SS-50 ND ND ND ND ND ND ND ND ND<br />
SS-51 ND ND ND ND ND ND ND ND ND<br />
Zinc<br />
(mg/L)<br />
SS-52 ND ND ND ND ND ND ND ND ND<br />
SS-53/54 ND ND ND ND ND ND ND ND ND<br />
SS-55 4.6 ND 0.16 ND ND ND ND ND 0.16<br />
SS-56 ND ND ND ND ND ND ND ND ND<br />
SS-57 ND ND ND ND ND ND ND ND ND<br />
SS-58/59 ND ND ND ND ND ND ND ND ND<br />
SS-60 ND ND ND ND ND ND ND ND ND<br />
SS-61 ND ND ND ND ND ND ND ND 0.058<br />
SS-62 ND ND ND ND ND ND ND ND 0.092<br />
SS-63 ND ND ND ND ND ND ND ND ND<br />
SS-65 ND ND ND ND ND ND ND ND 0.27<br />
SS-66 - - - - - - - - -<br />
SS-67 0.37 ND 0.074 ND ND ND ND ND 0.15<br />
SS-68 ND ND ND ND ND ND ND ND 0.067<br />
SS-69/70 ND ND ND ND ND ND ND ND ND<br />
SS-71/72 ND ND ND ND ND ND ND ND ND<br />
SS-73/74 ND ND ND ND ND ND ND ND ND<br />
SS-75 ND ND ND ND ND ND ND ND ND<br />
SS-78 ND ND ND ND ND ND ND ND ND<br />
SS-79/80 ND ND ND ND ND ND ND ND ND<br />
SS-81 ND ND ND ND ND ND ND ND ND<br />
SS-82 ND ND ND ND ND ND ND ND ND<br />
bold = parameter level exceeds Primary or Secondary MCL<br />
ND = not detected above minimum reporting level<br />
63
Appendix B. Groundwater <strong>Quality</strong> Data, <strong>San</strong> <strong>Simon</strong> <strong>Sub</strong>-<strong>Basin</strong>--Continued<br />
Site #<br />
Gross Alpha<br />
(pCi/L)<br />
Gross Beta<br />
(pCi/L)<br />
Ra-226<br />
(pCi/L)<br />
Ra-228<br />
(pCi/L)<br />
Uranium<br />
(ug/L)<br />
δ 18 O<br />
( 0 / 00 )<br />
δ D<br />
( 0 / 00 )<br />
Radon-222<br />
(pCi/L)<br />
Type <strong>of</strong><br />
Chemistry<br />
S-A - - - - - - - - sodium-mixed<br />
S-B/C - - - - - - - - sodium-mixed<br />
S-D - - - - - - - - mixed-sulfate<br />
S-E - - - - - - - - mixed-sulfate<br />
S-F 4.98 5.89 0.02 0.55 - - - - calcium-bicarbonate<br />
S-G 5.20 2.54 0.02 1.35 - - - - sodium-bicarbonate<br />
S-H - - - - - - - - sodium-sulfate<br />
S-I - - - - - - - - sodium-sulfate<br />
S-J - - - - - - - - calcium-bicarbonate<br />
S-K 5.01 2.67 0.00 0.21 - - - - calcium-mixed<br />
S-L - - - - - - - - sodium-sulfate<br />
S-M - - - - - - - - sodium-mixed<br />
S-N - - - - - - - - calcium-mixed<br />
S-O - - - - - - - - sodium-bicarbonate<br />
S-P 1.35 1.45 0.00 1.01 - - - - calcium-bicarbonate<br />
SS-1 - - - - - - 11.1 - 81 831 sodium-mixed<br />
SS-2 - - - - - - - - sodium-mixed<br />
SS-3/4 - - - - - - - - sodium-mixed<br />
SS-5 11 13 < LLD - - - 9.2 - 67 657 sodium-mixed<br />
SS-6/7 - - - - - - 11.1 - 82 - sodium-mixed<br />
SS-8 - - - - - - 11.1 - 80 - sodium-mixed<br />
SS-9 - - - - - - 11.1 - 83 488 sodium-mixed<br />
SS-10 < LLD 18 - - - - 10.8 - 83 331 sodium-mixed<br />
SS-11 - - - - - - 10.1 - 84 - sodium-mixed<br />
SS-12 - - - - - - 10.6 - 75 824 sodium-sulfate<br />
SS-13 4.3 4.1 - - - - 7.7 - 63 - sodium-bicarbonate<br />
SS-15 - - - - - - 9.6 - 70 432 sodium-sulfate<br />
SS-16 - - - - - - 8.2 - 57 - sodium-bicarbonate<br />
bold = parameter level exceeds Primary or Secondary MCL ND = not detected above minimum reporting level LLD = Lower Limit <strong>of</strong> Detection<br />
64
Appendix B. Groundwater <strong>Quality</strong> Data, <strong>San</strong> <strong>Simon</strong> <strong>Sub</strong>-<strong>Basin</strong>--Continued<br />
Site #<br />
Gross Alpha<br />
(pCi/L)<br />
Gross Beta<br />
(pCi/L)<br />
Ra-226<br />
(pCi/L)<br />
Ra-228<br />
(pCi/L)<br />
Uranium<br />
(ug/L)<br />
δ D<br />
( 0 / 00 )<br />
δ 18 O<br />
( 0 / 00 )<br />
Radon-222<br />
(pCi/L)<br />
Type <strong>of</strong><br />
Chemistry<br />
SS-17 - - - - - - 9.9 - 71 - sodium-bicarbonate<br />
SS-18 - - - - - - 11.4 - 82 - sodium-mixed<br />
SS-19/20 3.4 16 - - - - 9.65 - 77 331 sodium-mixed<br />
SS-21 - - - - - - 11.5 - 78 - sodium-bicarbonate<br />
SS-22 - - - - - - 12.0 - 82 304 sodium-bicarbonate<br />
SS-23 2.1 2.0 - - - - 9.5 - 68 - sodium-bicarbonate<br />
SS-24 - - - - - - 10.1 - 73 - sodium-bicarbonate<br />
SS-25 7.9 3.3 < LLD - - - 10.4 - 71 2893 mixed-bicarbonate<br />
SS-26 - - - - - - 12.3 - 89 - sodium-bicarbonate<br />
SS-27 - - - - - - 10.4 - 73 - mixed-bicarbonate<br />
SS-28 - - - - - - 10.7 - 73 4419 calcium-bicarbonate<br />
SS-29/30 5.9 3.4 < LLD - - - 11.0 - 75.5 - sodium-bicarbonate<br />
SS-31a - - - - - - 7.2 -53 - sodium-mixed<br />
SS-31/32 < LLD 3.1 - - - - 9.9 - 66 141 calcium-sulfate<br />
SS-33 - - - - - - 10.1 - 63 - calcium-bicarbonate<br />
SS-35 - - - - - - 10.4 - 68 641 calcium-bicarbonate<br />
SS-36 - - - - - -11.1 - 79 - mixed-bicarbonate<br />
SS-37 2.5 2.9 - - - - 9.1 - 66 134 mixed-bicarbonate<br />
SS-38 2.2 2.0 - - - - 9.0 - 64 370 calcium-sulfate<br />
SS-39 - - - - - - 9.9 - 70 425 sodium-bicarbonate<br />
SS-40 - - - - - - 9.9 - 70 - calcium-bicarbonate<br />
SS-41 - - - - - - 10.2 - 72 1189 calcium-bicarbonate<br />
SS-43/44 - - - - - - 9.75 - 68.5 729 mixed-bicarbonate<br />
SS-45 - - - - - - 9.8 - 71 - calcium-bicarbonate<br />
SS-46 6.6 2.1 < LLD - - - 9.0 - 64 - calcium-bicarbonate<br />
SS-47 - - - - - -10.9 - 80 673 sodium-bicarbonate<br />
SS-48 36 9.5 < LLD - 34 -11.5 - 83 1840 sodium-bicarbonate<br />
SS-49 20 4.0 < LLD - 18 - 8.9 - 62 74 sodium-mixed<br />
bold = parameter level exceeds Primary or Secondary MCL ND = not detected above minimum reporting level LLD = Lower Limit <strong>of</strong> Detection<br />
65
Appendix B. Groundwater <strong>Quality</strong> Data, <strong>San</strong> <strong>Simon</strong> <strong>Sub</strong>-<strong>Basin</strong>--Continued<br />
Site #<br />
Gross Alpha<br />
(pCi/L)<br />
Gross Beta<br />
(pCi/L)<br />
Ra-226<br />
(pCi/L)<br />
Ra-228<br />
(pCi/L)<br />
Uranium<br />
(ug/L)<br />
δ D<br />
( 0 / 00 )<br />
δ 18 O<br />
( 0 / 00 )<br />
Radon-222<br />
(pCi/L)<br />
Type <strong>of</strong><br />
Chemistry<br />
SS-50 16 5.0 < LLD - 17 - 9.9 - 69 - sodium-bicarbonate<br />
SS-51 - - - - - - 10.1 - 69 731 calcium-bicarbonate<br />
SS-52 - - - - - - 10.1 - 69 - mixed-bicarbonate<br />
SS-53/54 - - - - - - 9.5 - 65.5 - calcium-sulfate<br />
SS-55 2.4 3.0 - - - - 10.6 - 73 241 calcium-bicarbonate<br />
SS-56 - - - - - - 10.8 - 75 642 calcium-bicarbonate<br />
SS-57 4.6 2.5 - - - - 9.6 - 67 437 calcium-bicarbonate<br />
SS-58/59 - - - - - - 9.35 - 66 573 mixed-bicarbonate<br />
SS-60 - - - - - - 10.5 - 73 - mixed-bicarbonate<br />
SS-61 - - - - - - 10.3 - 73 - calcium-bicarbonate<br />
SS-62 - - - - - - 9.2 - 66 457 calcium-bicarbonate<br />
SS-63 < LLD 2.3 - - - - 10.5 - 72 - sodium-bicarbonate<br />
SS-65 - - - - - - 9.8 - 67 1062 calcium-bicarbonate<br />
SS-66 - - - - - - 9.6 -67 - -<br />
SS-67 - - - - - - 10.0 - 70 1754 calcium-bicarbonate<br />
SS-68 - - - - - - 9.1 - 64 179 calcium-bicarbonate<br />
SS-69/70 - - - - - - 9.8 - 71 - sodium-mixed<br />
SS-71/72 - - - - - - 11.4 - 81 1294 sodium-bicarbonate<br />
SS-73/74 - - - - - - 9.2 - 66 533 sodium-sulfate<br />
SS-75 - - - - - - 8.6 - 67 375 mixed-bicarbonate<br />
SS-78 6.0 - - - - - 9.7 - 68 - calcium-bicarbonate<br />
SS79/80 1.1 - - - - -10.0 - 69 33 mixed-mixed<br />
SS-81 - - - - - - 9.2 - 64 - calcium-sulfate<br />
SS-82 - - - - - - 9.1 - 67 - sodium-sulfate<br />
bold = parameter level exceeds Primary or Secondary MCL ND = not detected above minimum reporting level LLD = Lower Limit <strong>of</strong> Detection<br />
66
APPENDIX C. INVESTIGATION METHODS<br />
Various groundwater sites were sampled by the ADEQ<br />
Groundwater Monitoring Program to characterize<br />
regional groundwater quality in the SS. Samples were<br />
collected at all sites for inorganic (physical parameters,<br />
major ions, nutrients, and trace elements). At selected<br />
sites samples were collected for hydrogen and oxygen<br />
isotope, radon, radiochemistry and pesticide analysis.<br />
No bacteria sampling was conducted because<br />
microbiological contamination problems in groundwater<br />
are <strong>of</strong>ten transient and subject to a variety <strong>of</strong> changing<br />
environmental conditions including soil moisture<br />
content and temperature. 17<br />
Sampling Strategy<br />
This study focused on regional groundwater quality<br />
conditions that are large in scale and persistent in time.<br />
This research is designed to identify regional<br />
degradation <strong>of</strong> groundwater quality such as occurs from<br />
non-point sources <strong>of</strong> pollution or a high density <strong>of</strong> point<br />
sources. The quantitative estimation <strong>of</strong> regional<br />
groundwater quality conditions requires the selection <strong>of</strong><br />
sampling locations that follow scientific principles for<br />
probability sampling. 19<br />
Sampling in the SS conducted by ADEQ followed a<br />
systematic stratified random site-selection approach.<br />
This is an efficient method because it requires sampling<br />
relatively few sites to make valid statistical statements<br />
about the conditions <strong>of</strong> large areas. This systematic<br />
element requires that the selected wells be spatially<br />
distributed while the random element ensures that every<br />
well within a cell has an equal chance <strong>of</strong> being<br />
sampled. This strategy also reduces the possibility <strong>of</strong><br />
biased well selection and assures adequate spatial<br />
coverage throughout the study area. 19 The main benefit<br />
<strong>of</strong> a statistically-designed sampling plan is that it allows<br />
for greater groundwater quality assumptions than would<br />
be allowable with a non-statistical approach.<br />
Wells pumping groundwater for a variety <strong>of</strong> purposes -<br />
domestic, stock, and industrial - were sampled for this<br />
study, provided each individual well met ADEQ<br />
requirements. A well was considered suitable for<br />
sampling if the well owner gave permission to sample, if<br />
a sampling point existed near the wellhead, and if the<br />
well casing and surface seal appeared to be intact and<br />
undamaged. 5 Other factors such as casing access to<br />
determine groundwater depth and construction<br />
information were preferred but not essential.<br />
sampling if they had a constant flow through a clearlydefined<br />
point <strong>of</strong> egress, and if the sample point had<br />
minimal surface impacts. Well information compiled<br />
from the ADWR well registry and spring data are found<br />
in Appendix A.<br />
Several factors were considered to determine sample<br />
size for this study. Aside from administrative<br />
limitations on funding and personnel, this decision was<br />
based on three factors related to the conditions in the<br />
area:<br />
• Amount <strong>of</strong> groundwater quality data already<br />
available;<br />
• Extent to which impacted groundwater is<br />
known or believed likely to occur; and<br />
• Geologic and hydrologic complexity and<br />
variability <strong>of</strong> the basin. 19<br />
Sample Collection<br />
The personnel who designed the SS study were also<br />
responsible for the collection and interpretation <strong>of</strong> the<br />
data. This protocol helps ensure that consistently high<br />
quality data are collected, from which are drawn<br />
relevant and meaningful interpretations. The sample<br />
collection methods for this study conformed to the<br />
<strong>Quality</strong> Assurance Project Plan (QAPP) 1 and the Field<br />
Manual For Water <strong>Quality</strong> Sampling. 5 These sources<br />
should be consulted as references to specific sampling<br />
questions; however, a brief synopsis <strong>of</strong> the procedures<br />
in collecting a groundwater sample is provided.<br />
After obtaining permission from the owner to sample<br />
the well, the water level was measured with a sounder if<br />
the casing had access for a probe. The volume <strong>of</strong> water<br />
needed to purge the well three bore-hole volumes was<br />
calculated from well log and on-site information.<br />
Physical parameters - temperature, pH, and specific<br />
conductivity - were monitored at least every five<br />
minutes using a YSI multi-parameter instrument. To<br />
assure obtaining fresh water from the aquifer, typically<br />
after three bore volumes had been pumped and the<br />
physical parameters were stabilized within 10 percent, a<br />
sample representative <strong>of</strong> the aquifer was collected from<br />
a point as close to the wellhead as possible. In certain<br />
instances, it was not possible to purge three bore<br />
volumes. In these cases, at least one bore volume was<br />
evacuated and the physical parameters had stabilized<br />
within 10 percent.<br />
If registered wells were unavailable for sampling,<br />
springs or unregistered wells were randomly selected for<br />
sampling. Springs were considered adequate for<br />
67
Sample bottles were filled in the following order:<br />
1. Pesticide<br />
2. Radon<br />
3. Inorganic<br />
4. Radiochemistry<br />
5. Isotope<br />
Radon samples were collected in two unpreserved, 40-<br />
ml clear glass vials. Radon samples were carefully<br />
filled and sealed so that no headspace remained. 16<br />
The inorganic constituents were collected in three, 1-<br />
liter polyethylene bottles:<br />
• Samples to be analyzed for dissolved metals<br />
were filtered into bottles and preserved with 5<br />
ml nitric acid (70 percent). An on-site positive<br />
pressure filtering apparatus with a 0.45 micron<br />
(µm) pore size groundwater capsule filter was<br />
used.<br />
• Samples to be analyzed for nutrients were<br />
collected in bottles and preserved with 2 ml<br />
sulfuric acid (95.5 percent).<br />
• Samples to be analyzed for other parameters<br />
were unpreserved. 27<br />
Radiochemistry samples were collected in two<br />
collapsible 1-liter plastic containers and preserved with<br />
5 ml nitric acid to reduce the pH below 2.5 su. 5<br />
laboratory method, EPA water method, and Minimum<br />
Reporting Level (MRL) for both laboratories is<br />
provided in Table 13.<br />
The radon and radiochemistry samples were analyzed<br />
by Radiation Safety Engineering, Inc. Laboratory in<br />
Chandler, AZ. The analysis <strong>of</strong> radiochemistry samples<br />
was performed according to the following SDW<br />
protocols: Gross alpha was analyzed, and if levels<br />
exceeded 5 pCi/L, then radium-226 was measured. If<br />
radium-226 exceeded 3 pCi/L, radium-228 was<br />
measured. If gross alpha levels exceeded 15 pCi/L<br />
initially, then radium-226/228 and total uranium were<br />
measured.<br />
Hydrogen and oxygen isotope samples were analyzed<br />
by the University <strong>of</strong> <strong>Arizona</strong>, Laboratory <strong>of</strong> Isotope<br />
Geochemistry in Tucson.<br />
Sample Numbers<br />
Seventy-seven (77) groundwater sites (plus one surface<br />
water site) were sampled for the study. Various<br />
numbers and types <strong>of</strong> samples were collected and<br />
analyzed:<br />
• 77 - inorganic<br />
• 62 - hydrogen and oxygen isotopes<br />
• 33 - radon<br />
• 23 - radiochemistry<br />
• 4 - pesticide.<br />
Hydrogen and oxygen isotope samples were collected in<br />
a single 500 ml plastic bottle and were not preserved.<br />
Samples were kept at 4 0 C with ice in an insulated<br />
cooler, with the exception <strong>of</strong> the isotope and<br />
radiochemistry samples. Chain <strong>of</strong> custody procedures<br />
were followed in sample handling. Samples for this<br />
study were collected in June 1997, May 2001, and May<br />
- September 2002.<br />
Laboratory Methods<br />
The inorganic analyses for this study were conducted by<br />
the <strong>Arizona</strong> <strong>Department</strong> <strong>of</strong> Health Services (ADHS)<br />
Laboratory in Phoenix, <strong>Arizona</strong>, with inorganic splits<br />
analyzed by Del Mar Laboratory in Phoenix, <strong>Arizona</strong>.<br />
A complete listing <strong>of</strong> inorganic parameters, including<br />
68
Table 13. ADHS/Del Mar Laboratory Methods Used for the SS Study<br />
Constituent Instrumentation ADHS / Del Mar<br />
ADHS / Del Mar<br />
Water Method<br />
Minimum Reporting Level<br />
Physical Parameters and General Mineral Characteristics<br />
Alkalinity Electrometric Titration SM232OB 2 / 5<br />
SC (μS/cm) Electrometric EPA 120.1/ SM2510B 1 / 2<br />
Hardness Titrimetric, EDTA EPA 130.2 / SM2340B 10 / 1<br />
Hardness - Calc. Calculation -- --<br />
pH (su) Electrometric EPA 150.1 0.1<br />
TDS Gravimetric EPA 160.1 / SM2540C 10 / 20<br />
Turbidity (NTU) Nephelometric EPA 180.1 0.01 / 1<br />
Major Ions<br />
Calcium ICP-AES EPA 200.7 5 / 2<br />
Magnesium ICP-AES EPA 200.7 1 / 0.5<br />
Sodium ICP-AES EPA 200.7 / EPA 273.1 5<br />
Potassium Flame AA EPA 258.1 0.5 / 1<br />
Bicarbonate Calculation -- 2<br />
Carbonate Calculation -- 2<br />
Chloride Potentiometric Titration SM 4500 CLD / EPA 300.0 1 / 5<br />
Sulfate Colorimetric EPA 375.2 / EPA 300.0 10 / 5<br />
Nutrients<br />
Nitrate as N Colorimetric EPA 353.2 0.02 / 0.50<br />
Nitrite as N Colorimetric EPA 353.2 0.02<br />
Ammonia Colorimetric EPA 350.1/ EPA 350.3 0.02 / 0.5<br />
TKN Colorimetric EPA 351.2 / SM4500 0.05 / 0.5<br />
Total Phosphorus Colorimetric EPA 365.4 / EPA 365.3 0.02 / 0.05<br />
All units are mg/L except as noted<br />
16 27<br />
Source<br />
69
Table 13. ADHS/Del Mar Laboratory Methods Used for the SS Study--Continued<br />
Constituent Instrumentation ADHS / Del Mar<br />
Water Method<br />
Trace Elements<br />
ADHS / Del Mar<br />
Minimum Reporting Level<br />
Antimony Graphite Furnace AA EPA 200.9 0.005 / 0.004<br />
Arsenic Graphite Furnace AA EPA 200.9 0.01 / 0.003<br />
Barium ICP-AES EPA 200.7 0.1 / 0.01<br />
Beryllium Graphite Furnace AA EPA 200.9 0.0005<br />
Boron ICP-AES EPA 200.7 0.1 / 0.5<br />
Cadmium Graphite Furnace AA EPA 200.9 0.001 / 0.0005<br />
Chromium Graphite Furnace AA EPA 200.9 0.01 / 0.004<br />
Copper Graphite Furnace AA EPA 200.9 0.01 / 0.004<br />
Fluoride Ion Selective Electrode SM 4500 F-C 0.2 / 0.1<br />
Iron ICP-AES EPA 200.7 0.1<br />
Lead Graphite Furnace AA EPA 200.9 0.005 / 0.002<br />
Manganese ICP-AES EPA 200.7 0.05 / 0.02<br />
Mercury Cold Vapor AA SM 3112 B / EPA 245.1 0.0005 / 0.0002<br />
Nickel ICP-AES EPA 200.7 0.1 / 0.05<br />
Selenium Graphite Furnace AA EPA 200.9 0.005 / 0.004<br />
Silver Graphite Furnace AA EPA 200.9 / EPA 273.1 0.001 / 0.005<br />
Thallium Graphite Furnace AA EPA 200.9 0.002<br />
Zinc ICP-AES EPA 200.7 0.05<br />
All units are mg/L<br />
16 27<br />
Source<br />
70
APPENDIX D. DATA EVALUATION<br />
<strong>Quality</strong> Assurance<br />
<strong>Quality</strong>-assurance (QA) procedures were followed and<br />
quality-control (QC) samples were collected to quantify<br />
data bias and variability for the SS study. The design <strong>of</strong><br />
the QA/QC plan was based on recommendations<br />
included in the <strong>Quality</strong> Assurance Project Plan<br />
(QAPP) 1 and the Field Manual For Water <strong>Quality</strong><br />
Sampling. 5 The types and numbers <strong>of</strong> QC samples<br />
collected for this study are as follows:<br />
Inorganic: (5 full duplicate, 2 partial filter duplicates,<br />
5 splits, 5 full blanks, 1 partial filter blanks).<br />
Isotope: (5 duplicates, 0 splits, 0 blanks).<br />
Radiochemical: (0 duplicates, 0 splits, 0 blanks).<br />
Radon: (0 duplicates, 0 splits, 0 blanks).<br />
Pesticide: (0 duplicates, 0 splits, 0 blanks).<br />
Based on the QA/QC results, sampling procedures and<br />
laboratory equipment did not significantly affect the<br />
groundwater quality samples <strong>of</strong> this study.<br />
Blanks - Equipment blanks for inorganic analyses were<br />
collected to ensure adequate decontamination <strong>of</strong><br />
sampling equipment, and that the filter apparatus and/or<br />
de-ionized water were not impacting the groundwater<br />
quality sampling. 5 Equipment blank samples for major<br />
ion and nutrient analyses were collected by filling<br />
unpreserved and sulfuric acid preserved bottles with deionized<br />
water. Equipment blank samples for trace<br />
element analyses were collected with de-ionized water<br />
that had been filtered into nitric acid preserved bottles.<br />
Systematic contamination was judged to occur if more<br />
than 50 percent <strong>of</strong> the equipment blank samples<br />
contained measurable quantities <strong>of</strong> a particular<br />
groundwater quality constituent. 10 As such, SC-lab and<br />
turbidity were considered to be affected by systematic<br />
contamination; however, the extent <strong>of</strong> contamination<br />
was not considered significant. SC was detected in all<br />
five full equipment blanks while turbidity was detected<br />
in four full equipment blanks. SC had a mean <strong>of</strong> 1.8<br />
μS/cm, which was less than 1 percent <strong>of</strong> the SC mean<br />
level for the study. The SC detections may be explained<br />
in two ways: water passed through a de-ionizing<br />
exchange unit will normally have an SC value <strong>of</strong> at least<br />
1 μS/cm, and carbon dioxide from the air can dissolve in<br />
de-ionized water with the resulting bicarbonate and<br />
hydrogen ions imparting the observed conductivity. 27<br />
Similarly, turbidity had a mean level <strong>of</strong> 0.035 ntu, less<br />
than 1 percent <strong>of</strong> the turbidity median level for the<br />
study. Testing indicates turbidity is present at 0.01 ntu<br />
in the de-ionized water supplied by the ADHS<br />
laboratory, and levels increase with time due to storage<br />
in ADEQ carboys. 27<br />
Three other constituents were detected in the blanks but<br />
none appeared to significantly impact sampling results.<br />
Copper was detected at 0.011 mg/l in SS-14 but no other<br />
samples collected during that field trip had detections <strong>of</strong><br />
this constituent. Mercury was detected at 0.00095 mg/l<br />
in SS-34 but again no other samples collected during<br />
that field trip had detections <strong>of</strong> this constituent. The<br />
ADHS lab personnel thought that the nitric acid<br />
preservative bottle may have been contaminated as no<br />
mercury was detected in the unpreserved sample. 27<br />
Chloride was also detected in SS-14 at 5 mg/l.<br />
Duplicate Samples - Duplicate samples are identical<br />
sets <strong>of</strong> samples collected from the same source at the<br />
same time and submitted to the same laboratory. Data<br />
from duplicate samples provide a measure <strong>of</strong> variability<br />
from the combined effects <strong>of</strong> field and laboratory<br />
procedures. 5 Duplicate samples were collected from<br />
sampling sites that were believed to have elevated<br />
constituent concentrations as judged by field SC values.<br />
Partial filter duplicate samples were also collected in<br />
two cases. These occurred by collecting an extra<br />
duplicate sample in an unpreserved container. Upon<br />
submission to the ADHS laboratory, this sample water<br />
would be filtered and preserved with nitric acid.<br />
Variability in constituent concentrations between each<br />
pair <strong>of</strong> duplicate samples is provided both in terms <strong>of</strong><br />
absolute levels and as the percent difference. Percent<br />
difference is defined as the absolute difference between<br />
levels in the duplicate samples divided by the average<br />
level for the duplicate samples, multiplied by 100. Only<br />
constituents having levels exceeding the Minimum<br />
Reporting Level (MRL) were used in this analysis.<br />
Most constituents were examined using four duplicate<br />
samples, cations and trace elements were examined<br />
using an extra two duplicate filter samples.<br />
Analytical results indicate that <strong>of</strong> the 37 constituents<br />
examined, only 20 constituents had concentrations<br />
above MRLs in which both duplicate samples (Table<br />
14). Cadmium and nitrate were detected near the MRL<br />
in one sample, the other sample reporting a non-detect.<br />
With total phosphorus, this pattern occurred with two<br />
sets <strong>of</strong> duplicate samples.<br />
71
Table 14. Summary Results <strong>of</strong> SS Duplicate Samples from ADHS Laboratory<br />
Parameter<br />
Number<br />
Difference in Percent<br />
Difference in Concentrations<br />
Minimum Maximum Median Minimum Maximum Median<br />
Physical Parameters and General Mineral Characteristics<br />
Alkalinity, Total 5 0 % 2 % 0 % 0 10 0<br />
SC (μS/cm) 5 0 % 4 % 0 % 0 100 0<br />
Hardness 5 0 % 3% 0 % 0 10 0<br />
pH-field (su) 5 0 % 2 % 0 % 0 0.3 0<br />
TDS 5 0 % 3 % 0 % 0 10 0<br />
Turbidity (NTU) 4 5 % 67 % 17 % 0.02 0.1 0.07<br />
Major Ions<br />
Bicarbonate 5 0 % 2 % 1 % 0 10 3<br />
Carbonate 5 0 % 0 % 0 % 0 0 0<br />
Calcium 7 0 % 4 % 2 % 0 10 0.15<br />
Magnesium 7 0 % 6 % 0 % 0 0.9 0<br />
Sodium 7 0 % 7 % 1 % 0 20 5<br />
Potassium 7 0 % 8 % 0 % 0 1.3 0<br />
Chloride 5 0 % 40 % 0 % 0 10 0<br />
Sulfate 5 0 % 1 % 0 % 0 10 0<br />
Nutrients<br />
Nitrate (as N) 5 0 % 0 % 0 % 0 0.02 0<br />
TKN 5 0 % 3 % 0 % 0 0.003 0<br />
Trace Elements<br />
Arsenic 7 0 % 8 % 0 % 0 0.011 0<br />
Boron 7 0 % 2 % 0 % 0 0.02 0<br />
Fluoride 5 0 % 3 % 0 % 0 0.06 0<br />
Zinc 7 0 % 32 % 0% 0 0.078 0<br />
All units are mg/L except as noted with certain physical parameters<br />
Note: In one duplicate, cadmium and nitrate were detected at near the MRL in one sample and not detected in the other sample. In two duplicates, total<br />
phosphorus was detected near the MRL in two samples and not detected in the other two samples.<br />
72
The maximum difference between duplicate constituents<br />
never exceeded 8 percent with the exception <strong>of</strong> zinc (32<br />
percent), chloride (40 percent), and turbidity (67 percent).<br />
Turbidity values can be impacted by the exceedance <strong>of</strong><br />
this parameter’s holding time 27 ; this occurred frequently<br />
during the study. Although chloride had a high<br />
percentage difference, it had a relatively small<br />
concentration difference (3.6 mg/L). Based on these<br />
results, the differences in constituent concentrations <strong>of</strong><br />
duplicate samples were not considered to significantly<br />
impact the groundwater quality data.<br />
Split Samples - Split samples are identical sets <strong>of</strong><br />
samples collected from the same source at the same time<br />
that are submitted to two different laboratories to check<br />
for laboratory differences. 5 Five inorganic split samples<br />
were collected. Analytical results from the split samples<br />
were evaluated by examining the variability in<br />
constituent concentrations in terms <strong>of</strong> absolute levels and<br />
as the percent difference.<br />
Analytical results indicate that <strong>of</strong> the 38 constituents<br />
examined, only 19 had concentrations above MRLs for<br />
both ADHS and Del Mar laboratories in at least one<br />
sample. The maximum difference between split<br />
constituents rarely exceeded 20 percent (Table 15). As<br />
usual, TKN exhibited the largest maximum difference<br />
(100%), a pattern which has been found in other ADEQ<br />
ambient groundwater studies and is due to the difficulty<br />
in analyzing this constituent. 16 27 In three splits, TKN was<br />
detected in the Del Mar laboratory sample but not in the<br />
ADHS sample; in one split the pattern was reversed.<br />
Split samples were also evaluated using the nonparametric<br />
Sign test to determine if there were any<br />
significant (p ≤ 0.05) differences between ADHS<br />
laboratory and Del Mar Laboratory analytical results. 10<br />
Results <strong>of</strong> the Sign test showed that none <strong>of</strong> the 19<br />
constituents examined had significantly different<br />
concentrations between the laboratories.<br />
ADEQ 1997-2002 Well Comparison - As an additional<br />
QA/QC measurement, two wells that were sampled as<br />
part <strong>of</strong> the 1997 ADEQ Upper Gila Watershed study<br />
were resampled in 2002. 37 The two wells resampled<br />
include a deep artesian well (BLM Hot Springs Well) and<br />
a windmill (Antelope Well).<br />
Analytical results indicate that <strong>of</strong> the 18 constituents<br />
examined, the maximum difference between sample<br />
constituents typically did not exceed 15 percent (Table<br />
16). When there were large maximum percentage<br />
differences, there were relatively small concentration<br />
differences. Near the MRL, the error can be large as the<br />
result <strong>of</strong> small concentration differences. Constituents<br />
with large maximum percentage differences included<br />
those having difficult analytical methods (turbidity and<br />
TKN) as well as with nitrate and arsenic.<br />
These results appear to indicate that data collected by<br />
ADEQ in 1997 and 2002 can be used interchangably in<br />
the current assessment <strong>of</strong> <strong>San</strong> <strong>Simon</strong> sub-basin<br />
groundwater quality.<br />
Also based on the results <strong>of</strong> blanks, duplicates, and split<br />
samples, there appeared to be no significant QA/QC<br />
problems with the groundwater quality collected for this<br />
study.<br />
Data Validation<br />
The analytical work for this study was subjected to the<br />
following six QA/QC correlations.<br />
Cation/Anion Balances - In theory, water samples<br />
exhibit electrical neutrality. Therefore, the sum <strong>of</strong><br />
milliequivalents per liter (meq/L) <strong>of</strong> cations must equal<br />
the sum <strong>of</strong> meq/L <strong>of</strong> anions. However, this neutrality<br />
rarely occurs due to unavoidable variation inherent in all<br />
water quality analyses. Still, if the cation/anion balance is<br />
found to be within acceptable limits, it can be assumed<br />
there are no gross errors in concentrations reported for<br />
major ions. 20<br />
Overall, cation/anion balances <strong>of</strong> SS samples were<br />
significantly correlated (regression analysis, p ≤ 0.01)<br />
and were within acceptable limits (90 - 110 percent).<br />
SC/TDS - The SC and TDS concentrations measured by<br />
contract laboratories were significantly correlated as were<br />
field-SC and TDS concentrations (regression analysis, p<br />
≤ 0.01). Typically, the TDS concentration in mg/L should<br />
be from 0.55 to 0.75 times the SC in μS/cm for<br />
groundwater up to several thousand mg/L. 20 Groundwater<br />
in which the ions are mostly bicarbonate and chloride<br />
will have a multiplication factor near the lower end <strong>of</strong><br />
this range and groundwater high in sulfate may reach or<br />
even exceed the higher number. The relationship <strong>of</strong> TDS<br />
to SC becomes undefined for groundwater either with<br />
very high and low concentrations <strong>of</strong> dissolved solids. 20<br />
73
Table 15. Summary Results <strong>of</strong> SS Split Samples From ADHS/Del Mar Labs<br />
Constituents<br />
Number<br />
Difference in Percent Difference in Levels Significance<br />
Minimum Maximum Minimum Maximum<br />
Physical Parameters and General Mineral Characteristics<br />
Alkalinity, total 5 0 % 4 % 0 10 ns<br />
Alk., phenol 5 0 % 39 % 0 7.9 ns<br />
SC (μS/cm) 5 0 % 6 % 0 40 ns<br />
Hardness 5 0 % 14 % 0 20 ns<br />
pH (su) 5 1 % 4 % 0.09 0.58 ns<br />
TDS 5 0 % 8 % 0 10 ns<br />
Turbidity (NTU) 5 0 % 19 % 0 1.3 ns<br />
Major Ions<br />
Calcium 5 0 % 2 % 0 1 ns<br />
Magnesium 5 0 % 3 % 0 2 ns<br />
Sodium 5 0 % 5 % 0 10 ns<br />
Potassium 5 1 % 4 % 0.1 0.2 ns<br />
Chloride 5 0 % 12 % 0 11 ns<br />
Sulfate 5 1 % 5 % 0.7 10 ns<br />
Nutrients<br />
Nitrate as N 5 0 % 7 % 0 0.2 ns<br />
TKN 5 0 % 100 % 0 2.5 ns<br />
Trace Elements<br />
Arsenic 5 0 % 3 % 0 0.001 ns<br />
Boron 5 0 % 0 % 0 0 ns<br />
Fluoride 4 0 % 9 % 0 0.1 ns<br />
Zinc 5 0 % 100 % 0 0.52 ns<br />
All units are mg/L except as noted with certain physical parameters<br />
ns = No significant (p ≤ 0.05) difference between labs<br />
74
Table 16. Summary Results <strong>of</strong> 1997/2002 ADEQ Well Sampling Comparison<br />
Constituents<br />
Number<br />
Difference in Percent Difference in Levels Significance<br />
Minimum Maximum Minimum Maximum<br />
Physical Parameters and General Mineral Characteristics<br />
Alkalinity, total 2 0 % 0 % 0 0 ns<br />
Hardness 2 10 % 14 % 4 16.5 ns<br />
pH-field (su) 2 1 % 2 % 0.1 0.15 ns<br />
SC (μS/cm) 2 5 % 7 % 200 235 ns<br />
TDS 2 1 % 4 % 10 100 ns<br />
Turbidity (NTU) 1 58 % 58 % 2.93 2.93 ns<br />
Major Ions<br />
Calcium 2 10 % 12 % 1.5 5 ns<br />
Magnesium 2 0 % 17 % 0 0.45 ns<br />
Sodium 2 0 % 1 % 0 5 ns<br />
Potassium 2 6 % 13 % 0.65 0.9 ns<br />
Bicarbonate 1 0 % 0 % 0 0 ns<br />
Chloride 2 0 % 14 % 0 50 ns<br />
Sulfate 2 1 % 3 % 5 20 ns<br />
Nutrients<br />
Nitrate as N 2 0 % 76 % 0 0.356 ns<br />
TKN 2 0 % 28 % 0 0.11 ns<br />
Trace Elements<br />
Arsenic 2 12 % 25 % 0.009 0.021 ns<br />
Boron 2 1 % 3 % 0.01 0.03 ns<br />
Fluoride 2 2 % 5 % 0.35 1 ns<br />
All units are mg/L except as noted with certain physical parameters<br />
ns = No significant (p ≤ 0.05) difference between labs<br />
Note: Zinc was detected at the 1997 sample collected from Antelope Well at 0.12 mg/L and not detected above the MRL <strong>of</strong> 0.05 mg/L<br />
in 2002. 37<br />
75
Hardness - Concentrations <strong>of</strong> laboratorymeasured<br />
and calculated values were<br />
significantly correlated (regression analysis, p ≤<br />
0.01). Hardness concentrations were calculated<br />
using the following formula: [(Calcium x 2.497)<br />
+ (Magnesium x 4.118)].<br />
SC - The SC measured in the field using a YSI<br />
meter at the time <strong>of</strong> sampling was significantly<br />
correlated with the SC measured by contract<br />
laboratories (regression analysis, p ≤ 0.01).<br />
pH - The pH value is closely related to the<br />
environment <strong>of</strong> the water and is likely to be<br />
altered by sampling and storage. 20 Still, the pH<br />
values measured in the field using a YSI meter at<br />
the time <strong>of</strong> sampling were significantly<br />
correlated with laboratory pH values (regression<br />
analysis, p ≤ 0.01).<br />
Groundwater Temperature/Groundwater<br />
Depth - Groundwater temperature measured in<br />
the field was compared to groundwater depth to<br />
examine the relationship that exists between<br />
temperature and depth. Groundwater temperature<br />
should increase with depth, approximately 3<br />
degrees Celsius with every 100 meters or 328<br />
feet. 7 Groundwater temperature and water depth<br />
were however not significantly correlated<br />
(regression analysis, p ≤ 0.05).<br />
The analytical work conducted for this study was<br />
considered valid based on the quality control<br />
samples and the QA/QC correlations.<br />
Statistical Considerations<br />
Various methods were used to complete the<br />
statistical analyses for the groundwater quality<br />
data <strong>of</strong> this study. All statistical tests were<br />
conducted on a personal computer using<br />
SYSTAT s<strong>of</strong>tware. 40<br />
Data Normality: Initially, data associated with<br />
22 constituents were tested for both nontransformed<br />
and log-transformed normality using<br />
the Kolmogorov-Smirnov one-sample test with<br />
the Lilliefors option. 8 Results <strong>of</strong> this test using<br />
non-transformed data revealed that three<br />
constituents (pH-field, pH-lab, and oxygen-18)<br />
were normally distributed. This is not unusual as<br />
the distribution <strong>of</strong> many groundwater quality<br />
parameters is <strong>of</strong>ten not Gaussian or normal, but<br />
skewed to the right. 19 The results <strong>of</strong> the logtransformed<br />
test revealed that 14 <strong>of</strong> the 20 logtransformed<br />
constituents (isotopes being<br />
negative numbers were not able to be logtransformed)<br />
were normally-distributed with<br />
only temperature, turbidity, bicarbonate, sulfate,<br />
nitrate, gross beta, and deuterium not normally<br />
distributed. However, turbidity, sulfate, gross<br />
beta, and deuterium came close to being<br />
normally distributed. In summary, 14 percent <strong>of</strong><br />
non-transformed data were normally-distributed<br />
while 70 percent <strong>of</strong> the log-transformed<br />
constituents were normally-distributed.<br />
Spatial Relationships: The parametric analysis<br />
<strong>of</strong> variance (ANOVA) test was applied to<br />
investigate the hypothesis that constituent<br />
concentrations from groundwater sites in<br />
different aquifers or rock types, <strong>of</strong> the SS were<br />
the same. The ANOVA tests the equality <strong>of</strong> two<br />
or more means in experiments involving one<br />
continuous dependent variable and one<br />
categorical independent variable. 40 The null<br />
hypothesis <strong>of</strong> identical mean values for all data<br />
sets within each test was rejected if the<br />
probability <strong>of</strong> obtaining identical means by<br />
chance was less than or equal to 0.05.<br />
Comparisons conducted using the ANOVA test<br />
include aquifers (alluvial, lower, upper, and<br />
bedrock), water-bearing units (alluvial, lower,<br />
upper, Chiricahua, Dos Cabezas, Peloncillo, and<br />
Pinaleno) and rock types (alluvium, granite rock,<br />
volcanic rock, and basaltic rock). 26<br />
If the null hypothesis was rejected for any <strong>of</strong> the<br />
tests conducted, the Tukey method <strong>of</strong> multiple<br />
comparisons on the ranks <strong>of</strong> the data was<br />
applied. The Tukey test identified significant<br />
differences between constituent concentrations<br />
when compared to each possibility within each<br />
<strong>of</strong> the four tests. 19<br />
The ANOVA and Tukey tests are not valid for<br />
data sets with greater than 50 percent <strong>of</strong> the<br />
constituent concentrations below the MRL. 19<br />
Consequently, they were not calculated for trace<br />
parameters such as antimony, barium, beryllium,<br />
cadmium, chromium, copper, lead, manganese,<br />
mercury, nickel, selenium, silver, thallium,<br />
phenolphthalein alkalinity, carbonate, nitrite, and<br />
ammonia. Constituents such as arsenic, iron,<br />
total phosphorus, total kjeldahl nitrogen (TKN),<br />
and zinc, although not having greater than 50<br />
percent above the MRL, were calculated though<br />
the results should not be considered statisticallyvalid.<br />
Highlights <strong>of</strong> these statistical tests are<br />
summarized in the groundwater quality section.<br />
76
Constituent Concentration Correlations: In<br />
order to assess the strength <strong>of</strong> association<br />
between constituents, their concentrations were<br />
compared to each other using the Pearson<br />
Correlation Coefficient test.<br />
The Pearson correlation coefficient varies<br />
between -1 and +1, with a value <strong>of</strong> +1 indicating<br />
that a variable can be predicted perfectly by a<br />
positive linear function <strong>of</strong> the other, and vice<br />
versa. A value <strong>of</strong> -1 indicates a perfect inverse<br />
or negative relationship. The results <strong>of</strong> the<br />
Pearson Correlation Coefficient test were then<br />
subjected to a probability test to determine which<br />
<strong>of</strong> the individual pair wise correlations were<br />
significant. 40 The Pearson test is not valid for<br />
data sets with greater than 50 percent <strong>of</strong> the<br />
constituent concentrations below the MRL. 19<br />
Consequently, Pearson Correlation Coefficients<br />
were not calculated for the same constituents as<br />
in spatial relationships. However, constituents<br />
such as arsenic, iron, total phosphorus, total<br />
kjeldahl nitrogen (TKN), and zinc, although not<br />
having greater than 50 percent above the MRL,<br />
were calculated though the results should not be<br />
considered statistically-valid.<br />
77