Standard Operating Procedures for Surface Water Sampling
Standard Operating Procedures for Surface Water Sampling
Standard Operating Procedures for Surface Water Sampling

You also want an ePaper? Increase the reach of your titles
YUMPU automatically turns print PDFs into web optimized ePapers that Google loves.
<strong>Standard</strong> <strong>Operating</strong> <strong>Procedures</strong> <strong>for</strong><strong>Surface</strong> <strong>Water</strong> Quality <strong>Sampling</strong>Prepared by the <strong>Surface</strong> <strong>Water</strong> Section, ADEQ, 1110 W. Washington St., Phoenix, AZ 85007Edited by Jason D. JonesThe Arizona Department of Environmental Qualityshall preserve, protect and enhance the environmentand public health, and shall be a leader in the developmentof public policy to maintain and improvethe quality of Arizona’s air, land and water resourcesPrinted on recycled paperPublication Number TB 12-02
STANDARD OPERATING PROCEDURES FOR SURFACE WATER QUALITY SAMPLING2.3.5.2 Launching the boat..................................................................................................................................... 322.3.5.3 Returning from a trip ................................................................................................................................. 322.3.5.3.1 Putting the boat back on the trailer ....................................................................................................... 322.3.5.3.2 Returning equipment and decontamination .......................................................................................... 332.3.6 Border Safety .......................................................................................................................................332.3.6.1 Physical abilities: ....................................................................................................................................... 332.3.6.2 Training: .................................................................................................................................................... 332.3.6.3 Pre-trip Activities....................................................................................................................................... 332.3.6.4 Develop routing slip................................................................................................................................... 342.3.6.5 Field Activities........................................................................................................................................... 342.3.6.6 In-field safety protocols-............................................................................................................................ 352.3.6.7 Post-trip Activities ..................................................................................................................................... 352.3.6.8 Additional safety precautions that may be taken:....................................................................................... 35CHAPTER 3CHEMISTRY PROCEDURES....................................................................................................363.1 FIELD MEASUREMENTS .............................................................................................................................363.1.1 Dissolved Oxygen, Conductivity, pH, Temperature, and Depth ..........................................................363.1.1.1 Dissolved Oxygen...................................................................................................................................... 363.1.1.2 Depth (Lakes) ............................................................................................................................................ 373.1.1.3 Specific Electrical Conductivity, pH, and Temperature............................................................................. 373.1.2 Multiprobe Placement..........................................................................................................................373.1.2.1 Stream Multiprobe Placement.................................................................................................................... 373.1.2.2 Lake Multiprobe Placement / Determining Lake Stratification.................................................................. 373.1.3 Turbidity ..............................................................................................................................................383.1.3.1 Per<strong>for</strong>ming a Dilution <strong>for</strong> Turbidity........................................................................................................... 393.1.4 Hach DR/700 Colorimeter <strong>for</strong> Chlorine Analysis................................................................................393.1.4.1 Field Procedure <strong>for</strong> Measuring Free Available Chlorine ...........................................................................393.1.4.2 Field Procedure <strong>for</strong> Measuring Total Chlorine .......................................................................................... 403.1.5 Air Temperature...................................................................................................................................403.2 COLLECTING WATER CHEMISTRY SAMPLES .............................................................................................403.2.1 General In<strong>for</strong>mation ............................................................................................................................403.2.1.1 <strong>Sampling</strong> Order.......................................................................................................................................... 403.2.1.2 Sample Bottle Labeling.............................................................................................................................. 413.2.2 Collection Bottles.................................................................................................................................423.2.3 Filtering Dissolved Metals...................................................................................................................443.2.4 Acidifying or Preserving Metal and Nutrient Samples ........................................................................453.2.5 Collecting Field <strong>Water</strong> Chemistry Quality Control Samples...............................................................463.2.5.1 Quality Control <strong>Sampling</strong> Frequency ........................................................................................................ 463.2.5.2 Blanks ........................................................................................................................................................ 463.2.5.3 Duplicate and Split Samples ...................................................................................................................... 483.2.6 Chain of Custody and Laboratory Sample Submittal Forms ...............................................................483.2.6.1 General Chain of Custody Guidelines........................................................................................................ 483.2.7 Clean <strong>Sampling</strong> of Natural <strong>Water</strong>s <strong>for</strong> Trace Metals ..........................................................................493.2.7.1 Clean Hands/Dirty Hands Pre-<strong>Sampling</strong> Precautions ................................................................................503.2.7.2 Manual Grab <strong>Sampling</strong> .............................................................................................................................. 503.2.7.3 Grab <strong>Sampling</strong> with a <strong>Sampling</strong> Device .................................................................................................... 513.2.7.4 <strong>Sampling</strong> with a Continuous Flow <strong>Sampling</strong> Device.................................................................................513.2.7.5 Field Filtering ............................................................................................................................................ 523.2.7.5.1 Processing Field Blank and Dissolved Lead and Copper Samples: ...................................................... 523.2.7.5.2 Processing Field Blank <strong>for</strong> Mercury Sample (red dot equipment):....................................................... 533.2.7.6 Field Decontamination of Equipment ........................................................................................................ 533.2.7.7 Quality Assurance/Quality Control............................................................................................................ 543.2.7.7.1 Field Blank ........................................................................................................................................... 543.2.7.7.2 Field Duplicate ..................................................................................................................................... 543.3 STREAM COLLECTION TECHNIQUES ..........................................................................................................553.3.1 Collecting a Representative Stream Sample ........................................................................................553.3.1.1 Grab Sample Method ................................................................................................................................. 563.3.1.2 Equal Width Increment Sample Method.................................................................................................... 563.3.1.3 Modified Equal Width Increment Sample Collection ................................................................................593.3.1.4 Equal Discharge Increment Sample Collection.......................................................................................... 60REVISED SEPTEMBER 2012vii
STANDARD OPERATING PROCEDURES FOR SURFACE WATER QUALITY SAMPLING3.4 LAKE SAMPLING TECHNIQUES ..................................................................................................................633.4.1 Collecting a Representative Lakes Sample ..........................................................................................643.4.2 <strong>Water</strong> Sample Collection .....................................................................................................................663.4.2.1 Secchi Depth.............................................................................................................................................. 663.4.2.2 Beta Bottle ................................................................................................................................................. 673.4.2.2.1 Beta Bottle Collection Point in an Unstratified Lake............................................................................673.4.2.2.2 Beta Bottle Collection Points in an Stratified Lake .............................................................................. 673.4.2.3 Sediment Sample Collection...................................................................................................................... 683.4.2.4 Zooplankton <strong>Sampling</strong>............................................................................................................................... 69CHAPTER 4BACTERIA COLLECTION........................................................................................................714.1 MEMBRANE FILTER TECHNIQUE ...............................................................................................................714.1.1 Membrane Filter Sample Collection Procedure..................................................................................724.1.2 Equipment Setup ..................................................................................................................................724.1.3 Filtration and Plating Procedure ........................................................................................................734.1.4 Counting Bacteria Colonies.................................................................................................................754.1.4.1 Computing Bacterial Densities .................................................................................................................. 754.2 COLILERT ® SYSTEM ..................................................................................................................................784.2.1 Quanti-Tray/2000 Enumeration Procedure.........................................................................................794.2.2 Procedural Notes .................................................................................................................................824.2.3 Quality Control <strong>Procedures</strong>.................................................................................................................824.3 LAKE SAMPLING LOCATIONS FOR BACTERIA ............................................................................................82CHAPTER 5MEASURING FLOW...................................................................................................................855.1 INSTANTANEOUS DISCHARGE WITH FLOW METER ....................................................................................855.1.1 Field Procedure...................................................................................................................................855.1.2 Meter Error Messages .........................................................................................................................885.1.3 Key Summary.......................................................................................................................................885.2 FLOAT METHOD ........................................................................................................................................895.2.1 Float Method Procedure......................................................................................................................895.3 U.S.G.S. STAFF GAGE...............................................................................................................................895.4 VOLUMETRIC MEASUREMENT...................................................................................................................89CHAPTER 6AUTOMATED FIELD EQUIPMENT........................................................................................916.1 RAIN GAGE ...............................................................................................................................................916.1.1 Placement ............................................................................................................................................916.1.2 Pre-trip Activities.................................................................................................................................916.1.3 Maintenance and Calibration..............................................................................................................926.1.4 Downloading data ...............................................................................................................................936.1.5 Post-trip Activities ...............................................................................................................................936.1.6 File storage..........................................................................................................................................946.2 TEMPERATURE GAGES ..............................................................................................................................946.2.1 Placement ............................................................................................................................................946.2.2 Downloading data ...............................................................................................................................946.2.3 Post-trip Activities ...............................................................................................................................956.2.4 File storage..........................................................................................................................................956.3 PORTABLE (AUTOMATIC) SAMPLERS ........................................................................................................956.3.1 General Overview................................................................................................................................956.3.2 Quality Control....................................................................................................................................966.3.3 Placement/Deployment ........................................................................................................................966.3.4 Programming Options .........................................................................................................................986.3.5 Equipment Keys ...................................................................................................................................996.4 WATER LEVEL LOGGERS...........................................................................................................................996.4.1 General Care .......................................................................................................................................996.4.2 Level Logger Field Observations.......................................................................................................1006.4.3 HOBO® U-20 <strong>Water</strong> Level Loggers..................................................................................................1006.4.3.1 Barometric Pressure Compensation ......................................................................................................... 102REVISED SEPTEMBER 2012viii
STANDARD OPERATING PROCEDURES FOR SURFACE WATER QUALITY SAMPLING6.4.4 Global <strong>Water</strong> WL15 and WL16 <strong>Water</strong> Level Loggers .......................................................................1026.4.5 In-Situ Level Troll 500 <strong>Water</strong> Level Loggers.....................................................................................103CHAPTER 7 STREAM ECOSYSTEM MONITORING ...............................................................................1067.1 SAMPLING ORDER ...................................................................................................................................1067.2 COLLECTING MACROINVERTEBRATES.....................................................................................................1077.2.1 Site Selection......................................................................................................................................1077.2.2 Reference Site Selection.....................................................................................................................1087.2.3 When to Sample Macroinvertebrates.................................................................................................1087.2.4 How to Sample Macroinvertebrates ..................................................................................................1097.2.5 duplicate Samples ..............................................................................................................................1117.2.6 Macroinvertebrate Sample Labeling .................................................................................................1117.2.7 Storage...............................................................................................................................................1117.2.8 Chain of Custody ...............................................................................................................................1117.3 DIATOM COLLECTION .............................................................................................................................1127.3.1 Sample Collection and Field Processing...........................................................................................1127.3.2 Labeling.............................................................................................................................................1127.3.3 Preservation and Storage ..................................................................................................................1127.3.4 Chain of Custody ...............................................................................................................................1137.4 HABITAT ASSESSMENTS..........................................................................................................................1137.4.1 Stream Type Identification.................................................................................................................1137.4.2 Reach Length and Complexity ...........................................................................................................1147.4.2.1 Reach Length ........................................................................................................................................... 1147.4.2.2 Reach Complexity.................................................................................................................................... 1147.4.3 Measurements <strong>for</strong> Determining Stream Type ....................................................................................1157.4.3.1 Determining Bankfull Width ................................................................................................................... 1187.4.3.2 Bankfull Maximum Depth ....................................................................................................................... 1197.4.3.3 Correction Factors.................................................................................................................................... 1197.4.3.4 Field Bankfull Mean Depth...................................................................................................................... 1207.4.3.5 Cross-Sectional Area ............................................................................................................................... 1207.4.3.6 Floodprone width..................................................................................................................................... 1217.4.3.7 Determining Stream Type........................................................................................................................ 1217.4.3.8 Determining Valley Type......................................................................................................................... 1227.4.4 Reach Observations ...........................................................................................................................1227.4.4.1 Organic Debris / Channel Blockages in Active Channel ......................................................................... 1227.4.4.2 Reach Habitat Quality.............................................................................................................................. 1237.4.5 Depositional Features........................................................................................................................1237.4.6 Riparian Association..........................................................................................................................1247.4.7 Pebble Counts....................................................................................................................................1257.4.7.1 Riffle Pebble Count.................................................................................................................................. 1267.4.7.2 Reachwide Pebble Count ......................................................................................................................... 1287.4.7.2.1 How to Calculate Number of Runs and Diversity............................................................................... 1307.4.8 Riffle Geometry..................................................................................................................................1327.4.9 Canopy Density..................................................................................................................................1327.4.9.1 Determining Stream Order....................................................................................................................... 1337.4.10 Riparian Species ...........................................................................................................................1347.4.11 Biological Observations................................................................................................................1357.4.12 Indicators of Excess Nutrients ......................................................................................................1367.4.12.1 Physical – Depositional Area Conditions................................................................................................. 1367.4.12.3 Other indicators of excess nutrients ......................................................................................................... 1377.4.13 Regeneration Potential of Riparian Trees ....................................................................................1387.4.14 Estimating Riparian Vegetation Cover .........................................................................................1397.4.15 Non-Point Source Observations....................................................................................................1407.4.16 Pfankuch Channel Stability Evaluation ........................................................................................1417.4.17 Proper Functioning Condition (PFC) Assessment........................................................................1447.4.18 Habitat Assessment .......................................................................................................................1467.4.18.1 Riffle Habitat Quality .............................................................................................................................. 1467.4.18.2 Extent of Riffle Habitat............................................................................................................................ 146REVISED SEPTEMBER 2012ix
STANDARD OPERATING PROCEDURES FOR SURFACE WATER QUALITY SAMPLING7.4.18.3 Embeddedness in Riffles.......................................................................................................................... 1477.4.18.4 Sediment Deposition................................................................................................................................ 1477.4.18.5 Bank Stability .......................................................................................................................................... 1477.4.18.6 Habitat Assessment Index Scoring........................................................................................................... 1477.4.19 Site sketch......................................................................................................................................149CHAPTER 8 GEOMORPHOLOGY PROCEDURES ...................................................................................1518.1 STREAM CHANNEL CONDITION ...............................................................................................................1518.2 CROSS-SECTION SURVEYS ......................................................................................................................1518.2.1 Cross-Section Surveying Procedure Using the Topcon Rotating Laser Level...................................1518.3 LONGITUDINAL PROFILE PROCEDURE .....................................................................................................1558.4 CHANNEL VERTICAL STABILITY ASSESSMENT USING THE BANK HEIGHT RATIO....................................1578.4.1 Bank Height Ratio Procedure............................................................................................................1578.5 CHANNEL LATERAL STABILITY USING THE BANK ERODIBILITY HAZARD INDEX AND NEAR BANK STRESSRATIOS 1578.5.1 Near Bank Stress Procedure..............................................................................................................1618.6 CHANNEL PATTERN.................................................................................................................................1678.6.1 Channel Pattern <strong>Procedures</strong>..............................................................................................................1678.7 CHANNEL DIMENSION RELATIONS USING WIDTH/DEPTH RATIOS ..........................................................1708.7.1 Field and Analytical <strong>Procedures</strong> .......................................................................................................1718.8 STREAM CHANNEL SCOUR AND DEPOSITION POTENTIAL........................................................................1728.8.1 Sediment Competence Procedure...........................................................................................................1728.9 STREAM TYPE EVOLUTIONARY SCENARIOS ............................................................................................1768.9.1 Field Protocols ..................................................................................................................................1768.9.2 Rosgen Stability Assessment ..............................................................................................................1768.10 LINEAR HABITAT COMPLEXITY INDEX....................................................................................................1778.10.1 Linear Habitat Complexity Index Calculation Procedure ............................................................1778.11 POOL FACET SLOPE ANALYSIS................................................................................................................1788.11.1 Pool Facet Slope Analysis Procedure............................................................................................................ 178CHAPTER 9POST-TRIP PROCEDURES.....................................................................................................1799.1 CALCULATING DISCHARGE .....................................................................................................................1799.2 PEBBLE COUNTS......................................................................................................................................1799.3 POST-TRIP CALIBRATIONS ......................................................................................................................1809.4 ROUTINE MAINTENANCE.........................................................................................................................1819.4.1 Multiprobe Calibration......................................................................................................................1819.4.1.1 Hydrolab Maintenance............................................................................................................................. 1819.4.1.1.1 Specific Electrical Conductivity ......................................................................................................... 1819.4.1.1.2 pH....................................................................................................................................................... 1829.4.1.1.3 Dissolved Oxygen............................................................................................................................... 1829.4.1.1.4 Temperature........................................................................................................................................ 1839.4.1.2 YSI Maintenance ..................................................................................................................................... 1839.4.1.2.1 Conductivity ....................................................................................................................................... 1839.4.1.2.2 pH....................................................................................................................................................... 1839.4.1.2.3 Dissolved Oxygen............................................................................................................................... 1849.4.1.2.4 Temperature........................................................................................................................................ 1859.4.2 Turbidity ............................................................................................................................................1859.4.3 Flow Meter.........................................................................................................................................1869.4.4 Bacteria Kits and Incubators.............................................................................................................1879.4.5 SEM Monitoring ................................................................................................................................1879.5 MACROINVERTEBRATE SHIPPING ............................................................................................................1879.5.1 Sample Preparation <strong>for</strong> Shipping to Taxonomy Laboratory..............................................................187CHAPTER 10 DATA MANAGEMENT .......................................................................................................18910.1 WHERE IS WATER QUALITY DATA STORED? ..........................................................................................18910.2 WQDB BASICS .......................................................................................................................................18910.3 NAVIGATING THE WQDB .......................................................................................................................191REVISED SEPTEMBER 2012x
STANDARD OPERATING PROCEDURES FOR SURFACE WATER QUALITY SAMPLING10.3.1 Logging into the Database............................................................................................................19110.3.2 Navigating through the WQDB.....................................................................................................19210.3.2.1 Inquiry Menu ........................................................................................................................................... 19510.3.2.1.1 Single Site Detailed ............................................................................................................................ 19510.3.2.1.2 Multiple Site Menu............................................................................................................................. 19610.3.2.1.3 Test Results ........................................................................................................................................ 19710.3.2.2 Report Menu ............................................................................................................................................ 19810.3.2.3 Lookup Table Menu................................................................................................................................. 19810.3.2.4 Supervisor Menu...................................................................................................................................... 19910.4 ENTERING DATA .....................................................................................................................................19910.4.1 Electronic Uploads .......................................................................................................................19910.4.1.1 Electronic Upload Process ....................................................................................................................... 20010.4.1.2 What Parameters are Electronically Uploaded? ....................................................................................... 20110.4.1.3 How to Avoid Electronically Uploading Data ......................................................................................... 20110.4.2 Manual Data Entry .......................................................................................................................20210.4.2.1 Navigating to the Site Visit Screen .......................................................................................................... 20210.4.2.2 Adding a New Visit ................................................................................................................................. 20310.4.2.3 Adding a Sample to an Existing Visit ...................................................................................................... 20310.4.2.4 Updating an Existing Sample................................................................................................................... 20310.4.3 Entering Data Using a Template ..................................................................................................20410.4.4 Entering Data by Hand.................................................................................................................20810.5 CREATING NEW SITES .............................................................................................................................21410.5.1 Procedure to Create a New Site....................................................................................................21410.5.2 How Sites are Named....................................................................................................................21410.5.2.1 Stream Code Abbreviations ..................................................................................................................... 21510.5.2.2 Lake Code Abbreviations......................................................................................................................... 21610.5.2.3 Canal IDing and Code Abbreviations ...................................................................................................... 21610.6 DATA MANAGEMENT QUALITY CONTROL ..............................................................................................21710.6.1 Overview and Timeframes ............................................................................................................21710.6.2 Data Review Process ....................................................................................................................21810.6.2.1 Determine and Report <strong>Surface</strong> <strong>Water</strong> Quality <strong>Standard</strong> Exceedances ..................................................... 22110.6.2.2 Comparing Hardness Dependent <strong>Standard</strong>s............................................................................................. 22210.6.2.2 Review <strong>for</strong> Errors, Omissions, and Dubious or Unusual Data ................................................................. 22310.6.2.3 Compare Results from Split and Duplicate Samples................................................................................ 22410.6.2.4 Determine if Equipment Blanks were “Clean.” ....................................................................................... 22510.6.2.5 QC Ratios................................................................................................................................................. 22510.6.2.5.1 Lab and Field Specific Conductivity Ratio......................................................................................... 22710.6.2.5.2 Lab and Field pH Ratio....................................................................................................................... 22710.6.2.5.3 TDS and Specific Conductivity Ratio................................................................................................. 22710.6.2.5.4 TDS and Calculated Sum of Constituent Ratios ................................................................................. 22810.6.2.5.5 Cation and Anion Balance .................................................................................................................. 22810.6.3 Data Approval...............................................................................................................................22910.7 SITE FILES ...............................................................................................................................................22910.7.1 Site File Contents..........................................................................................................................22910.7.2 Filing System.................................................................................................................................23010.7.3 Site File Security ...........................................................................................................................23110.7.4 Signing Out Files ..........................................................................................................................23110.7.5 Public Review of Site Files............................................................................................................23110.7.6 Records Retention and Archiving Files.........................................................................................231APPENDIX ACHECKLISTS........................................................................................................................233AMBIENT STREAMS ...............................................................................................................................................233LAKES ...................................................................................................................................................................234TMDL - GENERAL.................................................................................................................................................235TMDL - AUTOSAMPLER ........................................................................................................................................237SURVEYING EQUIPMENT........................................................................................................................................238APPENDIX BMACROINVERTEBRATE LAB REQUIREMENTS........................................................240SAMPLE RECEIPT ...................................................................................................................................................240REVISED SEPTEMBER 2012xi
STANDARD OPERATING PROCEDURES FOR SURFACE WATER QUALITY SAMPLINGSAMPLE PROCESSING.............................................................................................................................................240SUB-SAMPLING......................................................................................................................................................240SORTING ................................................................................................................................................................240SORTING EFFICACY ...............................................................................................................................................241TAXONOMIC IDENTIFICATION................................................................................................................................241REFERENCE COLLECTION AND STORAGE...............................................................................................................241REPORTING............................................................................................................................................................242QUALITY CONTROL TASKS....................................................................................................................................242QUALITY CONTROL FIELD AND LABORATORY PROCEDURES ................................................................................242BIOASSESSMENTS AS APPLIED TO PROJECTS BY OTHER ENTITIES (NPDES PERMITS) ...........................................243APPENDIX CAPPENDIX DAPPENDIX EWATERSHED DELINEATION METHOD........................................................................245STORET CODES...................................................................................................................249QUERYING DATA USING MICROSOFT ACCESS........................................................274A FEW IMPORTANT THINGS TO KNOW...................................................................................................................274BASIC NAVIGATION...............................................................................................................................................274APPENDIX F BASIC DATA MANIPULATION ........................................................................................279GETTING THE DATA INTO THE "RIGHT" FORMAT....................................................................................................279Making each Parameter Unique ......................................................................................................................280Adding a Negative to the Longitude Field........................................................................................................280Create a Pivot Table to Display your Results ..................................................................................................281Preparing to Import your data.........................................................................................................................281IMPORTING DATA INTO ARCMAP ..........................................................................................................................283IMPORTING DATA INTO SYSTAT..........................................................................................................................283APPENDIX G SEPTIC SYSTEM DETECTION USING OPTICAL BRIGHTENERS ..........................284EQUIPMENT ...........................................................................................................................................................284PLACEMENT...........................................................................................................................................................285SUPPORTING DATA................................................................................................................................................285SAMPLE RETRIEVAL AND PROCESSING..................................................................................................................286DATA ANALYSES AND INTERPRETATION ...............................................................................................................286APPENDIX H FLOAT SWITCH CONSTRUCTION .................................................................................288FLOAT SWITCH INSTALLATION..............................................................................................................................289APPENDIX I GENERAL LEVEL LOGGER MAINTENANCE FIELD PROCEDURES .........................290APPENDIX J AUTOSAMPLER DEFAULT AND RECOMMENDED PROGRAM SETTINGS FORTMDL STORM SAMPLING .................................................................................................................................291APPENDIX K BORDER AREA CONTACT INFORMATION .................................................................293TUCSON SECTOR STATIONS ...................................................................................................................................293YUMA SECTOR ......................................................................................................................................................295CORONADO NATIONAL FOREST.............................................................................................................................295COUNTY SHERIFFS.................................................................................................................................................296BUREAU OF LAND MANAGEMENT .........................................................................................................................297REFERENCES ........................................................................................................................................................298REVISED SEPTEMBER 2012xii
STANDARD OPERATING PROCEDURES FOR SURFACE WATER QUALITY SAMPLINGCHAPTER 1PRE-TRIP ACTIVITIESPreparation is the key to a successful monitoring trip. Monitoring staff are responsible <strong>for</strong>remembering numerous items be<strong>for</strong>e they even leave the office. This chapter is designed to helpstaff prepare <strong>for</strong> trips by using checklists, calibrating equipment, and considering site safety be<strong>for</strong>ethey leave the office.1.1 IMPORTANT DOCUMENTS AND FORMSThis document is used in conjunction with several other documents, each of which answers basicquestions related to water quality sampling as indicated below.Quality Assurance Program Plan (QAPP)Addresses specific quality issues <strong>for</strong> the program<strong>Sampling</strong> and Analysis Plan (SAP)Addresses where, when and what to sample<strong>Standard</strong> <strong>Operating</strong> <strong>Procedures</strong> (SOPs)Addresses how to sampleField FormsDocuments <strong>Sampling</strong> Data and <strong>Procedures</strong>Staff should be familiar with each of these documents be<strong>for</strong>e attempting to sample.1.2 FIELD TRIP EQUIPMENT LISTSCheck lists are very important tools to ensure that all the needed equipment is accounted <strong>for</strong>be<strong>for</strong>e going out into the field. Appendix A has checklists sorted by program (lakes, ambientstreams, TMDL, etc.). The checklists may not be complete <strong>for</strong> all projects. Certain projects don'tneed all of the equipment listed here <strong>for</strong> every trip.1.3 ORDERING SUPPLIES1.3.1 ORDERING BACTERIA PLATESBacteria plates <strong>for</strong> the membrane filter technique should be ordered in advance from theappropriate vendor (such as VWR). The Monitoring Unit currently uses "snap lid plates." withmodified mTEC agar.The media and control culture must be refrigerated and kept in the dark immediately after beingobtained from the vendor. Media should not be used beyond the expiration date.1.3.2 ORDERING OTHER SUPPLIESIt is the responsibility of each unit to make sure that all supplies are fully stocked in the lab.Contact the lab coordinator if bottles, acid, batteries, bags or any other supplies need to beordered.REVISED SEPTEMBER 2012 1
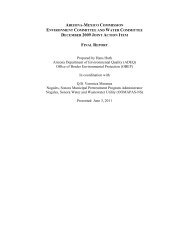
STANDARD OPERATING PROCEDURES FOR SURFACE WATER QUALITY SAMPLING1.4 EQUIPMENT CALIBRATION1.4.1 GENERAL CARE OF THE MULTIMETERADEQ currently uses Hydrolab and YSI multimeters. The multimeter measures field parameterssuch as temperature, pH, and conductivity. They consist of two main parts; the surveyor readoutunit and the sonde. The surveyor is the computer while the sonde contains the various probes.The calibration procedures listed in this document are just a subset of the YSI andHydrolab manuals. Always consult the respective equipment manual if additionalin<strong>for</strong>mation is needed.The sonde and surveyor must be transported and stored in the hard plastic Pelican cases. If theunits are stored in anti-static plastic bags.Proper care of the probes is essential <strong>for</strong> accurate readings. Keep probes cleared of organic mattersuch as algal filaments and sand. An occasional pre-calibration cleaning and rinse with isopropylalcohol and a very soft brush or cotton ball is recommended. Repeated use of the meter canaccumulate iron filings on the Hydrolab's magnetic dissolved oxygen stirrer. Regular cleaning willkeep the build-up from becoming an operational problem. FIGURE 1.1 shows the location of thesensors on the Hydrolab Minisonde unit. FIGURE 1.2 shows the calibration of the Hydrolab.Conductivity /DO / TDSStirrerpHTempFIGURE 1.1. Minisonde sensor placement.FIGURE 1.2. Hydrolab calibration.REVISED SEPTEMBER 2012 2
STANDARD OPERATING PROCEDURES FOR SURFACE WATER QUALITY SAMPLINGMaintain about 1/8 to 1/4 inch of tap water (or pH 4 buffer) in the probe protective cup at alltimes. Do not let the probes dry out because they will be permanently damaged and will have tobe replaced.Never store deionized water in the probe protective cup.The connectors on the cable, probe and transmitter should be cleared of debris. Do not let thecable ends fall into the dirt or water. Keep protector caps on the sensor connectors and cableconnectors whenever they are not in use.Always check the battery reading be<strong>for</strong>e taking the unit into the field. The Hydrolab Surveyor 4read-out units are equipped with a rechargeable nickel metal hydride battery (FIGURE 1.3).The fully charged battery holds a charge of 8.5 volts and should be recharged when thelevel reaches 6.5 volts. Nickel metal hydride batteries can be charged to full voltage atany time, no matter how low the voltage.Turn the unit off immediately after use to preserve the batterycharge. The stirrer unit is the largest draw on the battery, so use itsparingly. Some models will allow the observer to disable thestirrer when not needed.Carefully coil the cable after use into a 6" to 12" diameter coil. Donot step on the cable or allow it to become kinked. If the pinconnector to the probe or stirrer becomes difficult to slip on,lubricate the connector sleeve with the clear petroleum lubricantprovided in the maintenance kit. The male connector pins shouldoccasionally be cleaned with a weak solvent and a soft brush. Aftercleaning, always apply a thin coating of petroleum lubricant.FIGURE 1.3. SurveyorProtect units from temperatures greater than 122 F (50 C).Units will automatically shut down at this temperature. The readoutunits utilize a liquid crystal display and very cold or very hottemperatures will adversely affect the display read-out; there<strong>for</strong>e, donot subject units to extreme hot and cold temperatures.1.4.2 HYDROLAB CALIBRATION PROTOCOLSAll equipment should be calibrated be<strong>for</strong>e and after each use in the field and recorded in theequipment log book, which is kept with the unit. This allows the sampler to determine theaccuracy of the field parameters taken at the site and ensures that the instrument is ready <strong>for</strong> thenext user. Some individuals may chose to calibrate at each site depending on the requirements oftheir sample plan. Each time the instrument is pre-calibrated and post -calibrated, the results mustbe noted in the log book along with the name of the user and the intended use of the equipment.REVISED SEPTEMBER 2012 3
STANDARD OPERATING PROCEDURES FOR SURFACE WATER QUALITY SAMPLINGAny problems with the unit should also be noted. As a general rule, the temperature and otherparameter readings should be monitored <strong>for</strong> approximately a minute to ensure that the valuesstabilize be<strong>for</strong>e the readings are recorded in the unit’s log book. There may be some drift betweenthe two calibration values, depending on the amount of elapsed time between the pre-calibrationand post-calibration.When calibrating the units, use the function and cursor keys on the Surveyor 4 read-out units(FIGURE 1.3) to navigate through the procedure.Try running through the calibration procedure again if the readout states “calibration out ofrange”. If the problem occurs again, it may be that the probe in question needs the referencesolution replaced. Use fresh reference solution (be sure it hasn't expired) and replace the probesold solution. If the probe will still not calibrate, make notes in the calibration book regarding theproblem and have it shipped back to the manufacturer <strong>for</strong> repair. Do not put the faulty unit backinto the cabinet.1.4.2.1 Specific Electrical Conductance CalibrationThere are normally three conductivity standards found in the lab area, 0.1 Molar (M), 0.01 M and0.001 M potassium chloride (KCl) solutions. Use the 0.01 M KCl unless your site has low or highconductivity. These three standards are typically sufficient <strong>for</strong> most conditions encountered in thefield. If a site has unusually high conductivity readings, it may be necessary to have the lab preparea standard that more closely resembles the site conditions. The ranges and values assigned to thestandards are in most cases given in micro Siemens per centimeter (μS/cm). When calibratingwith the KCl standards, ensure that the solutions have not exceeded the expiration date. <strong>Standard</strong>solutions can be disposed of in the lab sink, using tap water to dilute and rinse equipment.1. Rinse the sensors three times with a half full calibration cup of deionized water to clear theprobes of contaminants.2. Use a paper towel or other non-abrasive absorbent material and dry the electrodes of theElectrical Conductivity (EC) probe. When the electrodes are dry, use the calibration menuon the readout unit to set the EC value to zero and push enter to save. This is the 1stpoint of the 2 point calibration. Rinse the sensors one additional time with DI water.3. Rinse the sensors two times with a small amount of KCl standard solution. Try to use asolution that has a conductivity range somewhere near the conditions expected to be seenin the field.4. Pour in the same KCl standard that was used when rinsing, until the conductivityelectrodes are covered with the solution. Make sure there are no bubbles attached to theEC chamber; if bubbles are present, gently tap the cup to dislodge them.5. Check the EC readings and look <strong>for</strong> stabilization of the value be<strong>for</strong>e continuing. ECreadings are corrected to 25 C, regardless of the ambient temperature of the solution.6. Use the calibration button on the readout unit to adjust the EC value to the conductancevalue of the KCl solution; press Enter. This saves the calibration reading.7. If other probes need calibrating, discard the KCl solution and rinse the cup and sensors 2times with deionized water. When the EC calibration is completed, discard the KClREVISED SEPTEMBER 2012 4
STANDARD OPERATING PROCEDURES FOR SURFACE WATER QUALITY SAMPLINGsolution into the sink and flush with tap water. When storing the unit, add a smallamount of tap water in the cup to keep the probes moist.1.4.2.2 pH CalibrationWhen per<strong>for</strong>ming a pH calibration, always check the buffer solutions being used and make surethat they are still within the expiration period specified on the container. pH calibration isper<strong>for</strong>med by measuring two buffer solutions of differing and known pH values. This allows thesensitivity, or slope, to be determined. If acidic conditions are expected at the sample site,calibrate using the 4.0 buffer solution and the 7.0 buffer solution. If the sample site typicallyshows basic conditions of above pH 7, use the 7.0 buffer and the 10.0 buffer.Always use the 7.0 buffer first and then either the 4.0 or the 10.0 to establish the slope.Because of the basic nature of Arizona's soils, most surface waters are usually above apH of 7.0.1. Rinse the probes three times with a half full cup of deionized water to clear the sensors ofcontaminants. Rinse the cup and sensors two times with a small amount of the 7.0 pHbuffer solution.2. Fill the calibration cup with enough of the 7.0 pH buffer solution to completely cover thepH electrode.3. Let the temperature and pH values stabilize be<strong>for</strong>e recording the current pH value.4. Use the calibration menu to reset the pH value to 7.00. Save the new calibration value.Record the new value given by the unit in the log-book.5. Rinse the cup and sensors 3 times with deionized water.6. Repeat procedures 1 through 4 with a slope solution of either pH 4.00 or pH 10.00.1.4.2.3 Dissolved Oxygen CalibrationCalibration of the dissolved oxygen (DO) probe is per<strong>for</strong>med in the storage cup of the Minisondeunit. Be<strong>for</strong>e beginning the calibration process, check the membrane on the DO probe <strong>for</strong>wrinkles and tears. There should not be any air bubbles present under the membrane. If any ofthese conditions are present, the membrane should be replaced with a new one be<strong>for</strong>e calibration.Hydrolab recommends that the unit be allowed to sit overnight after replacing the membrane.This allows the membrane to stretch and con<strong>for</strong>m itself to the probe. Although calibration can beper<strong>for</strong>med using a known DO concentration, it is easier to use percent saturation DO. Saturationof oxygen in water is determined by air pressure. ADEQ currently employs hand held altimeterscapable of reporting ambient air pressure <strong>for</strong> calibration in the lab and at the sample site. SomeHydrolab units have the barometer built into the read-out unit.1. Fill the calibration cup with tap water to below the DO probe membrane (water must notcover the membrane).2. Blot the DO membrane gently with a lint-free absorbent cloth or tissue to remove anywater droplets. Use a material that is non-abrasive.3. Invert the cap and slide it over the top of the calibration cup, and let the unit sit <strong>for</strong> about5 minutes to allow the conditions inside the cup to stabilize. Do not screw the cap backon. This will increase pressure inside the calibration cup.REVISED SEPTEMBER 2012 5
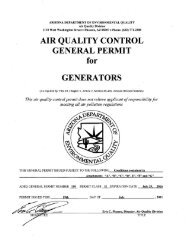
STANDARD OPERATING PROCEDURES FOR SURFACE WATER QUALITY SAMPLING4. Use the hand-held altimeter or the barometer in the unit to measure the ambient airpressure (the terms “air pressure” and “barometric pressure” are equivalent). If abarometer is not available or not functioning properly, contact a nearby airport. If thecalibration site is at approximately the same elevation and is not too distant from theairport, the air pressure reading should be usable <strong>for</strong> calibration purposes.Barometer readings from the Hydrolab or handheld barometer are usually “true”(uncorrected) values of air pressure and can be used “as is” <strong>for</strong> dissolved oxygencalibration. Weather service readings are usually not “true”, i.e., they are corrected tosea level, and there<strong>for</strong>e cannot be used until they are “uncorrected”. An approximate<strong>for</strong>mula <strong>for</strong> this “uncorrection” (where the BP readings MUST be in mm Hg) is: TrueBP = [Corrected BP] – [2.5 * (Local Altitude in feet above sea level/100)]. Also note,25.4 * (inches of Hg) = mm of Hg.If an altimeter is not available or the altimeter on hand is not functioning properly,there is a basic rule of thumb that can be used to obtain air pressure. <strong>Standard</strong>pressure at sea level is 29.92 inches of Hg. Atmospheric pressure decreases withincreasing altitude. For every increase of 1,000 feet in elevation above sea level, airpressure will decrease approximately 1.0 inch of Hg. This simple <strong>for</strong>mula can beuseful, but may not hold up well in cases where there is a DO exceedance that cannotbe attributed to naturally occurring conditions. Be sure to qualify the DO data if thismethod has to be used.5. Be<strong>for</strong>e calibrating the DO probe, record the pre-calibration percent saturation value afterthe unit has stabilized. Using the calibration menu <strong>for</strong> % saturation, enter the barometricpressure when prompted. Record the new DO percent saturation reading, which shouldbe at or near 100%. The reading should be stable <strong>for</strong> about 20 to 30 seconds. If DO isbeing measured at a number of sites and at substantially different elevations, the unitshould be calibrated at each site. Most stream and lake sampling will require DOcalibration at each site.1.4.3 YSI CALIBRATION PROCEDURESBe<strong>for</strong>e Calibrating the YSI, connect the Sonde to the unit via cable and turn unit on. Highlightsonde run and press enter. FIGURE 1.4 shows the basic components of the YSI Sonde andSurveyor.REVISED SEPTEMBER 2012 6
STANDARD OPERATING PROCEDURES FOR SURFACE WATER QUALITY SAMPLINGFIGURE 1.4. YSI Multiprobe <strong>for</strong> streams1.4.3.1 Dissolved Oxygen1. With the calibration cup on the sonde, open up the cap and place approximately 3 mm(1/8 inch) of water in the bottom of the calibration cup. Make certain that the DO andtemperature probes are not immersed in the water and are dry (use chem wipe to dry).Engage only 1 or 2 threads of the calibration cup to ensure the DO probe is vented to theatmosphere. Wait approximately 10 minutes <strong>for</strong> the air in the calibration cup to becomewater saturated and <strong>for</strong> the temperature to equilibrate.2. Press escape to return main menu. Select sonde menu and press enter to connect Sondeto unit. Select calibrate, then dissolved oxy, and DO sat%. Calibration of dissolved oxygen inthe DO % procedure also results in calibration of the DO mg/L mode and vice versa.3. Next enter the barometric pressure (mmHg) located at the right bottom of the screen andpress enter. Allow to stabilize and press enter.4. Return to the 650 main menu by pressing escape 3 times and select sonde run. Allow tostabilize.The true values <strong>for</strong> dissolved oxygen, conductivity, and pH should be recorded fromthe sonde run menu and not the calibration menu.5. Record the DO% value in the equipment logbook.Laboratory barometer readings are usually “true” (uncorrected) values of air pressureand can be used “as is” <strong>for</strong> oxygen calibration. Weather service readings are usually not“true”, i.e., they are corrected to sea level, and there<strong>for</strong>e cannot be used until they areREVISED SEPTEMBER 2012 7
STANDARD OPERATING PROCEDURES FOR SURFACE WATER QUALITY SAMPLING“uncorrected”. An approximate <strong>for</strong>mula <strong>for</strong> this “uncorrection” (where the BPreadings MUST be in mm Hg) is: True BP = [Corrected BP] – [2.5 * (Local Altitudein feet above sea level/100)]Helpful Linkshttp://156.42.96.39/alert/Wx/wcurrent.txt (Current "corrected" barometric pressure)http://www.onlineconversion.com/pressure.htm (Converts between pressure units)1.4.3.2 Conductivity1. With the calibration cup attached to the sonde, rinse the cup and conductivity sensor witha small amount of the standard that will be used and discard rinse. Avoid crosscontaminationof standard solutions with other solutions. Make certain that there are nosalt deposits around the oxygen and pH probes, particularly if employing standards of lowconductivity.2. Fill the calibration cup with the appropriate standard solution until the conductivity probeis completely immersed in the solution. Gently rotate and/or move the sonde up anddown to remove any bubbles from the conductivity cell.3. Allow at least one minute <strong>for</strong> the temperature to equilibrate be<strong>for</strong>e proceeding.4. From the calibrate menu select conductivity and then SpCond. Enter the calibration valueof the standard (mS/cm at 25°C) and press enter. The current values of all enabled sensorswill appear on the screen.5. Once the specific conductivity value becomes stable press enter. The screen will indicatethat the calibration has been accepted. When prompted, press enter again to return to thecalibrate menu.6. Return to the 650 main menu by pressing escape 3 times and select sonde run. Allow tostabilize.7. Record the conductivity value in the equipment logbook.8. Rinse the sonde in tap or purified water and dry the sonde.1.4.3.3 pH1. Rinse the pH probe and calibration cup with pH 7 buffer and discard solution.2. Fill the calibration cup just above the pH probe with pH 7 buffer.3. From the calibrate menu, select ISE1 pH to access the pH calibration choices and thenpress 2 Point. Enter the value of the buffer solution (7.0) and press Enter.4. The current values of all enabled sensors will appear on the screen and change with time asthey stabilize in the solution. Allow the pH value to stabilize and press enter to calibrate.5. After the pH 7 calibration is complete, press enter again, as instructed on the screen, tocontinue.6. Rinse the probe with pH 10 buffer and then fill the calibration cup above the probe withpH 10 buffer.7. Enter the value of the second pH solution (10.0) and press enter. Allow to stabilize.8. The current values of all enabled sensors will appear on the screen and change with time asthey stabilize in the solution. Allow the pH value to stabilize and press enter to calibrate.REVISED SEPTEMBER 2012 8
STANDARD OPERATING PROCEDURES FOR SURFACE WATER QUALITY SAMPLING9. After the second calibration point is complete, press enter again, as instructed on thescreen, to return to the Calibrate menu.10. Return to the 650 main menu by pressing escape 3 times and select sonde run. Allow tostabilize.11. Record the pH 10 value in the equipment logbook.12. Rinse the pH probe and calibration cub with pH 7 solution and discard rinse. Fill thecalibration cup above the probe with pH 7 buffer and let the value stabilize. Record pH 7value in the equipment logbook.13. Rinse the sonde and calibration cup in water and cap the cup with 1/8 inch of water <strong>for</strong>storage.The majority of environmental water of all types has a pH between 7 and 10. If a sitewill have a low pH then use the pH 4 and 7 buffer solutions to calibrate.1.4.4 MULTI-PARAMETER TROLL 90001.4.4.1 General Calibration <strong>Procedures</strong>The Multi-Parameter Troll (MPT) can be used to measure pH, specific conductivity, and dissolvedoxygen (DO). The following sections describe the procedures <strong>for</strong> calibrating each of theseparameters. Complete records including the date, pre- and post- calibration values, calibrationstandard lot numbers and expiration dates, any maintenance per<strong>for</strong>med (e.g. change DOmembrane), and any problems encountered during calibration should be recorded in the fieldbook associated with each probe.Each field case should contain the MPT probe, pH, conductivity, and DO sensors, sensormaintenance kits, a calibration cup (Cal Cup), flow restrictor, stirrer, sensor insertion tool, sensorextraction tool, field book, and computer connection cable.Maintenance kits <strong>for</strong> each of the sensors should contain the following:1. DO Kita. Extra Membranesb. DO Polishing Stripsc. Silicon Greased. 10% NH3 Cleaning Solutione. DO Electrode Filling Solutionf. Cleaning Brushg. Storage Bottle2. Conductivitya. Silicon Grease3. pHa. Silicon Greaseb. Storage BottleREVISED SEPTEMBER 2012 9
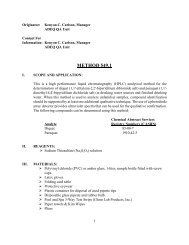
STANDARD OPERATING PROCEDURES FOR SURFACE WATER QUALITY SAMPLINGMaintenance work on the units is normally done on a quarterly basis; equipment that is not beingregularly used should be maintained every six months. A computer with Win-Situ 4.0 softwareinstalled is required <strong>for</strong> calibration; the MPT should be calibrated prior to the start of field work,recalibrated as conditions dictate (i.e. changes in barometric pressure) and the calibration checkedat the completion of field work.1.4.4.2 ConductivityConductivity should be calibrated first to avoid carry-over from other standards (e.g. pH buffers arehighly conductive). Prior to calibration make sure that the conductivity sensor is installed andclean. To install the sensor:1. Remove any moisture or dirt and use the sensor removal tool to remove the plug or sensorfrom port 4 (FIGURE 1.5). Retain the plug <strong>for</strong> future use. The sensor can be cleaned byrinsing it with tap water, then with deionized water, followed by a rinse with the solutionto be used <strong>for</strong> calibration.FIGURE 1.5. Sensor Port Configuration (left). Troll 9000 (right).2. Check lubrication of the sensor o-rings.3. Handle the sensor by the sides, not the tip and align the mark on the side of the sensorwith the mark on the port.4. Use the sensor insertion tool to press the sensor into the port until it docks with theconnector at the bottom. When properly inserted a small gap (width of the sensor removaltool) remains between the widest part of the sensor and the instrument body, <strong>for</strong> ease ofremoval.ADEQ purchases with 0.1 M, 0.01 M and 0.001 M potassium chloride (KCl) solutions that havebeen prepared, tested and assigned an acceptable range and usually a tested lab value. Thesestandards are typically sufficient <strong>for</strong> most conditions encountered in the field. If a site hasunusually high conductivity readings, it may be necessary to have the lab prepare a standard thatREVISED SEPTEMBER 2012 10
STANDARD OPERATING PROCEDURES FOR SURFACE WATER QUALITY SAMPLINGmore closely resembles the site conditions. The ranges and values assigned to the standards are inmost cases given in microSiemens per centimeter (μS/cm).As a general rule, a mid-range solution (0.01M; 1,434 μS/cm) should be used to calibrate the MPTunless site conditions dictate use of a different solution. When calibrating with the KCl standards,insure that the solutions have not exceeded the expiration date. <strong>Standard</strong> solutions can bedisposed of in the lab sink, using tap water to dilute and rinse equipment. The following steps willbe followed to calibrate the conductivity probe on the MPT:1. With the conductivity sensor installed and plugs or sensors in the other sensor ports, rinsethe front end of the MPT with tap water.2. Insure the PVC base is attached to the Cal Cup, triple rinse and fill the Cal Cup to the fillline with the selected calibration solution. If all the sensors are installed use the lower fillline as a guide (about half full), otherwise fill to the upper line.3. Insert the front end of the MPT into the open end of the Cal Cup. Thread the Cal Cuponto the body until seated against the o-ring, then back off slightly to avoid over tightening.Ensure that the conductivity probe is completely immersed in standard. The hole in theside of the probe MUST be under the surface of the solution and NOT have any trappedbubbles in the openings.4. Connect the MPT to a PC with the computer connection cable and establish a connectionin Win-Situ 4.0.5. Select the MPT in the Navigation tree. The software will automatically detect and displaythe installed sensors. If one or more sensors are installed in the wrong port, an errormessage will be displayed. Simply remove the sensor and install it in the correct position,then “refresh” the device be<strong>for</strong>e continuing.6. Select conductivity in the Parameters list. The sensor serial number (SN), type, and recentcalibration in<strong>for</strong>mation is shown. Select Calibrate. The Conductivity Calibration Wizardstarts.7. Select the calibration solution the sensor is soaking in and select Next to continue.8. In the next screen, select Run to begin the stabilization. The display will continuouslyupdate as readings are taken and compared against the stabilization criteria. Statusindicators:a. NOT TESTED is displayed until the calibration is selected by pressing Run.b. UNSTABLE indicates the sensor response does not meet the criteria <strong>for</strong> a validcalibration point.c. NOMINAL indicates the sensor deviation meets early stabilization criteria.The Accept button becomes available when nominal stability is achieved, wait untilSTABLE appears be<strong>for</strong>e selecting the Accept button. Calibration proceeds automatically tothe next screen. Temperature at the time of calibration is displayed <strong>for</strong> your in<strong>for</strong>mation.Most sensors stabilize within 1-3 minutes if the sensor is properly hydrated be<strong>for</strong>ecalibration. To minimize stabilization times, do not handle the instrument during thetime the sensor is taking readings in the calibration solution.REVISED SEPTEMBER 2012 11
STANDARD OPERATING PROCEDURES FOR SURFACE WATER QUALITY SAMPLING9. The final screen shows the new cell constant (Kcell) calculated <strong>for</strong> the selected range duringthe calibration process. The cell constant should range between 0.34 – 0.4.10. Select Finish in order to program the sensor with the displayed cell constant. Theconductivity sensor is now calibrated and ready to use in the range <strong>for</strong> which it wascalibrated.1.4.4.3 pHPrior to calibration make sure that the pH sensor is installed and clean. To install the sensor:1. Remove any moisture or dirt and use the sensor removal tool to remove the plug or sensorfrom port 1 (FIGURE 1.5). Retain the plug <strong>for</strong> future use. The sensor can be cleaned byrinsing it with tap water, then with deionized water, followed by a rinse with the solutionto be used <strong>for</strong> calibration.2. Check lubrication of the sensor o-rings.3. Handle the sensor by the sides not the tip and align the mark on the side of the sensorwith the mark on the port.4. Use the sensor insertion tool to press the sensor into the port until it docks with theconnector at the bottom. When properly inserted a small gap (width of the sensor removaltool) remains between the widest part of the sensor and the instrument body, <strong>for</strong> ease ofremoval.The following steps will be followed to calibrate the pH probe on the MPT:1. With the pH sensor installed and plugs or sensors in the other sensor ports, rinse the frontend of the MPT.2. Insure the black PVC base is attached to the Cal Cup. Triple rinse the Cal Cup and fill tothe fill line with the selected calibration solution. Begin with the lowest buffer value whenper<strong>for</strong>ming a multi-point calibration. If all the sensors are installed use the lower fill line asa guide (about half full), otherwise fill to the upper line.3. Insert the front end of the MPT into the open end of the Cal Cup. Thread the Cal Cuponto the body until seated against the o-ring, then back off slightly to avoid over-tightening.4. Connect the MPT to a PC and establish a connection in Win-Situ 4.0.5. Select the MPT in the Navigation tree. The software will automatically detect and displaythe installed sensors. If one or more sensors are installed in the wrong port, an errormessage will be displayed. Simply remove the sensor and install it in the correct position,then “refresh” the device be<strong>for</strong>e continuing.6. Click to select pH in the Parameters list. The sensor serial number (SN) and recentcalibration in<strong>for</strong>mation is displayed. Select Calibrate.7. Select the number of calibration points <strong>for</strong> this calibration and the pH value of thecalibration solution <strong>for</strong> each point. Cal point 1 is the solution the sensor is soaking in now.Select Next to continue.8. In the next screen, select Run to begin the stabilization. The display will continuouslyupdate as readings are taken and compared against the stabilization criteria. Statusindicators:a. NOT TESTED is displayed until the calibration is selected by pressing Run.REVISED SEPTEMBER 2012 12
STANDARD OPERATING PROCEDURES FOR SURFACE WATER QUALITY SAMPLINGb. UNSTABLE indicates the sensor response does not meet the criteria <strong>for</strong> a validcalibration point.c. NOMINAL indicates the sensor deviation meets early stabilization criteria.The Accept button becomes available when nominal stability is achieved; don’tpress the Accept button until a STABLE indicator is displayed.9. If doing a one-point calibration, go to step 12.10. For a multi-point calibration, remove the Cal Cup, discard the first solution, triple rinseand refill the Cal Cup with the second solution.11. Select Run to begin the stabilization <strong>for</strong> the second calibration point. Status indicators andcontrols are the same as <strong>for</strong> the first calibration point (Step 8).12. The final screen shows the sensor slope and offset calculated during the calibrationprocess. For a three point calibration, two sets of calculated coefficients will be shown. Theslope should range between -50 mV/ph and -62 mV/ph. A value outside this range mayindicate a bad sensor and a replacement should be obtained.13. Select Finish in order to program the sensor with the newly calculated calibrationcoefficients. The pH sensor is now calibrated and ready to use.1.4.4.4 Dissolved OxygenThe D.O. sensor per<strong>for</strong>ms best in clean water. In environments with high organic content, themembrane can become fouled. Rips, tears, and other damage will also affect membraneper<strong>for</strong>mance. For best results, replace the membrane when the slope and offset calculated duringcalibration change dramatically, and also after a long-term deployment. Whenever the membraneis changed, the sensor must be filled and conditioned <strong>for</strong> 24 hours prior to calibration. Becausethe amount of oxygen that can be dissolved in water changes with changing barometric pressure,DO should be recalibrated whenever there is a change in elevation or weather induced pressurefluctuations.The procedure <strong>for</strong> filling and changing the membrane is as follows:1. Remove the soft protective caps from the membrane end and the connector end of thesensor.2. Remove the membrane module from the sensor body and fill with electrolyte as follows:a. Holding the membrane module open-end up, position the electrolyte dispenseragainst the side of the module without touching the membrane and fill slowly.To eliminate air bubbles, tap the side of the module briskly with your fingernail orsmall tool.3. Insert the sensor into the open end of the membrane module. To minimize air, some ofthe electrolyte should overflow from the open end as the sensor is inserted.4. Thread the membrane module to the D.O. sensor.Install and condition the probe as follows:1. Remove any moisture or dirt and use the sensor removal tool to remove the plug or sensorfrom port 2 (FIGURE 1.5). Retain the plug <strong>for</strong> future use.REVISED SEPTEMBER 2012 13
STANDARD OPERATING PROCEDURES FOR SURFACE WATER QUALITY SAMPLING2. Check lubrication of the sensor o-rings.3. Handle the sensor by the sides, not the tip and align the mark on the side of the sensorwith the mark on the port.4. Use the sensor insertion tool to press the sensor into the port until it docks with theconnector at the bottom. When properly inserted a small gap (width of the sensor removaltool) remains between the widest part of the sensor and the instrument body, <strong>for</strong> ease ofremoval.5. Put a small amount of clean water in the clean Cal Cup and attach it loosely to theinstrument. Do not seal the Cal Cup; it should be at ambient pressure. The sensormembrane can be submerged or above the water level.6. Connect the MPT to a PC and establish a connection in Win-Situ 4.0.7. Select the MP TROLL 9000 in the Navigation tree. All installed sensors will be displayed.Powering of the D.O. sensor begins as soon as the software recognizes the D.O. sensor anddisplays it in the Navigation tree. This starts the conditioning process.It is not necessary to maintain the computer connection; conditioning continues aslong as the sensor is installed. Be sure the membrane does not leak. There should nobe any drops on the surface or visible air bubbles under the membrane. Condition thesensor <strong>for</strong> 24 hours be<strong>for</strong>e calibrating.The following steps will be followed to calibrate the DO probe on the MPT:1. With the D.O. sensor installed, conditioned and plugs or sensors in the other sensor ports,rinse the front end of the MPT thoroughly in clean water to remove contaminants andtraces of fluids used <strong>for</strong> earlier calibrations.2. Dry the D.O. sensor membrane by shaking the probe and/or gently wiping with a soft swabor the corner of a tissue. Be careful not to damage the membrane.3. Triple rinse the Cal Cup with tap water and attach it to the MPT. Thread the Cal Cuponto the body until seated against the o-ring, then back off slightly to avoid over tightening.4. Invert the Troll with Cal Cup attached and remove the black end cap.5. Gently fill the Cal Cup with clean water until the temperature sensor is completely coveredand the membrane at the tip of the D.O. sensor is in air. If any water splashes onto themembrane, gently dry it again.6. Loosely attach the end cap to the Cal Cup. For proper venting, a small hole in the threadsof the cap should be at least partly visible. A clamp or other support may be used tomaintain the TROLL 9000 in this inverted position.7. Connect the MPT to a PC and establish a connection in Win-Situ 4.0.8. Select MP TROLL 9000 in the Navigation tree. The software will automatically detect anddisplay the installed sensors.9. Select Dissolved Oxygen in the Parameters list. The sensor serial number (SN) and recentcalibration in<strong>for</strong>mation is displayed.10. Select Calibrate. The D.O. Calibration Wizard starts.11. Select the number of calibration points; in general a one-point calibration in air will yieldsatisfactory results. Refer to the MPT operator's manual <strong>for</strong> a two-point calibration inwater.REVISED SEPTEMBER 2012 14
STANDARD OPERATING PROCEDURES FOR SURFACE WATER QUALITY SAMPLING12. Select the membrane type (the thickness is stamped on membrane module; if not marked,it’s a 1-mil Teflon). Be sure the correct membrane type is selected.13. Select air <strong>for</strong> first calibration point.14. Select the default stimulus at saturation. This value is calculated by the software at thecurrent temperature and barometric pressure. Click Next to continue15. Select Run to begin stabilization <strong>for</strong> the first calibration point. The display willcontinuously update as readings are taken and compared against the stabilization criteria.Status indicators:NOT TESTED is displayed until the calibration is selected by pressing Run.UNSTABLE indicates the sensor response does not meet the criteria <strong>for</strong> a valid calibration point.NOMINAL indicates the sensor deviation meets early stabilization criteria.The Accept button becomes available when nominal stability is achieved; don’t press the Acceptbutton until a STABLE indicator is displayed. The calibration proceeds automatically to the nextscreen. The calculated sensor slope and offset are shown.A properly functioning sensor with a 1-mil membrane will have a slope in a range of 30-67 nA/(mg/l). Anything outside this range suggests a problem with either the membrane or the sensor.Install a new membrane; if problems persist, a new sensor may be needed. Additionally, the defaultoffset should read 2nA.16. Select Finish in order to program the sensor with the new calibration coefficients.1.4.4.5 StorageIf the instrument will be deployed in a day or so, leave all the sensors installed in the MPT. Thesensors can be stored <strong>for</strong> up to two weeks in the instrument with a moist sponge in the bottom ofthe Cal Cup to provide a moist environment. For long-term storage, the water quality sensorsshould be returned to their original packaging and the lubricated o-rings should be protected fromdust and dirt. The conductivity sensor should be removed, rinsed and stored dry. The pH cannotbe stored dry, in order to preserve the sensor’s reference solution, store the sensor in the electrodestorage bottle in a strong potassium chloride (KCl) solution. Ensure the bulb is immersed to keepit hydrated. The DO sensor should be rinsed with deionized water, capped, and stored dry.1.5 CLEANING EQUIPMENT1.5.1 CHURN SPLITTER, DH 81 AND SAMPLE BOTTLE CLEANINGPrior to field use, the churn splitter must be cleaned as follows.1. Wash outside and inside surfaces of the equipment (Chrun, DH81 & sample bottle)thoroughly with tap water and a non-phosphate (e.g., Liquinox) detergent using a nonmetallicstiff long-handled brush and let soak <strong>for</strong> thirty minutes. Be<strong>for</strong>e emptyingcontainer, run about 100 milliliters of the soap solution through the spigot.2. Rinse all surfaces thoroughly with tap water.3. Rinse inside surfaces thoroughly with 500 milliliters of 5% hydrochloric acid (HCl). Runsome of the HCl solution through the spigot; however, if the churn splitter contains aREVISED SEPTEMBER 2012 15
STANDARD OPERATING PROCEDURES FOR SURFACE WATER QUALITY SAMPLINGmetal spring in the spigot, do not open the spigot.For field cleaning, discard acid in a bucket withenough limestone or suitable material to neutralizethe acid until it can be disposed of properly at thelaboratory. For laboratory cleaning, discard usedacid in a waste container labeled “HCl waste” orflush down sink with a copious amount of runningwater.4. Rinse all surfaces thoroughly (at least twice) with deionizedwater.FIGURE 1.6. DH-81nozzle and bottle.5. After the second rinse, pour approximately 2 liters of de-ionized water into the churn.Swirl the water in the churn; then check the pH with test strip paper. If less than 5.5 SU,discard rinse water and rinse again with de-ionized water.6. Set cleaned equipment on a suitable drying rack in a contaminant free environment.7. Double wrap the churn with clean heavy-duty trash bags to protect from contaminantsduring storage and transportation. Place cleaned DH-81 parts in heavy duty sandwich bagsto protect from contaminants.1.6 FILTRATION AND TUBINGSilicon tubing is needed if dissolved metals are to be collected. The silicon-based tube should becut to length in the lab be<strong>for</strong>e going into the field. While cutting the tubing, wear a pair of cleanlab gloves and make the cut with a ceramic knife on a clean surface to prevent contamination ofthe tubing. After cutting the pieces to length (one tubing per site, plus any extra needed <strong>for</strong>QA/QC samples), place them in a clean, sealable plastic bag <strong>for</strong> transport to the monitoring sites.Do not allow tube ends to come in contact with any surfaces either in the lab or in thefield.1.7 SITE RECONNAISSANCESite reconnaissance a vital part of preparing <strong>for</strong> a sampling run. The reconnaissance may be assimple as looking up the in<strong>for</strong>mation on the database to see how to get there and determining whoowns the property or it may require a special visit to determine if the site is accessible.At a minimum the following questions should be considered be<strong>for</strong>e heading to a site. Who owns the land? If it is a private owner, did they grant access just <strong>for</strong> one trip or <strong>for</strong> multiple trips? Do theywant to be notified be<strong>for</strong>e you come? Are the directions adequate? Do you need to rewrite them? Will the sampling crew need a DH81 or churn splitter? Is the site perennial, intermittent or ephemeral?REVISED SEPTEMBER 2012 16
STANDARD OPERATING PROCEDURES FOR SURFACE WATER QUALITY SAMPLINGThe Monitoring Unit uses a random design <strong>for</strong> a portion of their sites. These sites typically needto be visited because ADEQ may not have an established site located nearby. The MonitoringUnit uses the Stream Reconnaissance Form to identify potential random sites (FIGURE 1.7).REVISED SEPTEMBER 2012 17
STANDARD OPERATING PROCEDURES FOR SURFACE WATER QUALITY SAMPLING1.8 SAMPLING PREPARATION FOR STREAM ECOSYSTEM MONITORINGChapter 7 covers how to conduct Stream Ecosystem Monitoring (SEM). SEM requires looking upthe following in<strong>for</strong>mation be<strong>for</strong>e going into the field (See Section 7.4). Flow regime Flow regime category The fields listed under the stream type identification (<strong>Water</strong>shed Area, Valley Type) Sinuosity and Slope Elevation (<strong>for</strong> riparian association)This in<strong>for</strong>mation will enable the samplers to determine the stream type in the field and verify thatthe measured bankfull width corrilates with the bankfull widths predicted by the regional curves.REVISED SEPTEMBER 2012 19
STANDARD OPERATING PROCEDURES FOR SURFACE WATER QUALITY SAMPLINGCHAPTER 2GENERAL FIELD PROCEDURESThis chapter covers general sampling in<strong>for</strong>mation including field <strong>for</strong>ms, decontaminationprocedures in the field and site safety.2.1 FIELD DATA SHEETSThere are several different versions of field data sheets <strong>for</strong> the Monitoring or TMDL Unit basedon the particular waterbody or study of interest. The Monitoring Unit typically uses the <strong>for</strong>mlisted in FIGURE 2.1. The Lake Program's field data sheets also must take into account depth andother lake specific parameters such as water clarity. TMDL's field datasheets are site specific.FIGURE 2.1. Field data sheet <strong>for</strong> ambient stream monitoring.REVISED SEPTEMBER 2012 20
STANDARD OPERATING PROCEDURES FOR SURFACE WATER QUALITY SAMPLINGFIGURE 2.1. Field data sheet <strong>for</strong> ambient stream monitoring.REVISED SEPTEMBER 2012 21
STANDARD OPERATING PROCEDURES FOR SURFACE WATER QUALITY SAMPLINGFIGURE 2.1. Field data sheet <strong>for</strong> ambient stream monitoring.REVISED SEPTEMBER 2012 22
STANDARD OPERATING PROCEDURES FOR SURFACE WATER QUALITY SAMPLING2.1.1 FILLING OUT DATA SHEETSThe purpose of field data sheets is to document field data, how water samples were collected andother important observations. It is essential that staff write legibly and document in<strong>for</strong>mation insuch a way to enable future samplers and possibly the public to understand the observations andmeasurements collected in the field (FIGURE 2.2).An important quality control check is to have the second field person (i.e. a personother than the one who filled out the <strong>for</strong>m) check over the <strong>for</strong>m be<strong>for</strong>e leaving thesite.2.1.1.1 Instructions <strong>for</strong> filling out Reach Observations on the Ambient Stream FormNarrative observations aboutthe general stream conditioncan be helpful in diagnosingpotential problems. Theobservations consist ofgeneral appearance of thestream reach and streambank, water appearance andodor, presence of fish,especially sunfish and crayfishas well as hydrologicalin<strong>for</strong>mation about flood ordrought evidence, flow regimeand water source (FIGURE2.3). Biotic interactions byexotic species such as crayfishand sunfish are an importantsource of impairment of the FIGURE 2.2. Staff filling out a site sketch in the field.macro-invertebrate community. Hydrological in<strong>for</strong>mation is important <strong>for</strong> identifying flood ordrought impacts, and ensuring that the stream is perennial prior to macroinvertebrate samplecollection.REVISED SEPTEMBER 2012 23
STANDARD OPERATING PROCEDURES FOR SURFACE WATER QUALITY SAMPLINGFIGURE 2.3. Reach Observations on the Ambient Stream Monitoring Field Form.Procedure <strong>for</strong> Filling Out Reach ObservationsThe observations take place 10 meters upstream and downstreamof the sample point (FIGURE 2.4). Some observations arerestricted to the wetted width of the stream and some involvelooking at the banks. % Algae refers to filamentous algae (not diatoms) andconsists of green and blue-green algae that can <strong>for</strong>m smalltufts to large beards attached to substrates or are floatingat or near the stream surface. This visual estimate is onlywithin the wetted width of the stream. % Macrophytes refers to aquatic vascular plants. Do notcount the plants that are found along the edge of water.Estimate the percent of the wetted width of the streamthat is covered by the macrophytes 10 meters upstreamand downstream of the sample point. Percent cover isvisually estimated and is generally a low number unlessthere is nutrient enrichment.10 MetersSample Point10 MetersFIGURE 2.4. Plan view of astream. Look 10 meters up anddownstream of the sample pointto fill out the reach observations.REVISED SEPTEMBER 2012 24
STANDARD OPERATING PROCEDURES FOR SURFACE WATER QUALITY SAMPLING2.1.2 PHOTO MONITORINGPhotos are taken at each visit to a sampling site. Based on the desired objectives, the photo shouldprovide a representative view of that site. Ideally, the photo should be taken at a fixed point ofreference to enable comparison of photos over time.For streams, the minimum number of photos is two: looking upstream from below the samplepoint and looking downstream from above the sample point.For lakes, photos should be taken to support any observations. Ideally with some recognizablelandmark in the background.Taking additional photos is encouraged. Document the sampling event, any changes from the lastvisit, outgrowths of filamentous algae on the stream bed, channel obstructions, man-made channelalterations or disturbances, floodplain debris, trash, sediment deposition features, point bars, bankerosion, head cuts, streambed particles, riparian community, wetlands community, bank particlecomposition, etc. The objective is to fully document the condition of the site and photos are ideal<strong>for</strong> this purpose.Photos should be taken to include the sample point with a person framed within the photo toshow scale. If the stream channel has been altered since the last site visit, additional photos shouldbe taken. Site alteration may include recent flood evidence, channel scour, sediment deposition,construction or man-made alterations in the floodplain or channel, or other biological orecological changes that warrant documentation. All photos taken at a site should have the photonumber recorded on the Field Data Sheet <strong>for</strong>m with the description of the photo (e.g. lookingupstream, looking downstream, dam site).Any photos taken at a site whether print film or digital, should immediately be printed and labeledupon return to the office.2.1.2.1 Labeling PhotosEach photo should be labeled with the following in<strong>for</strong>mation. Site ID The date the photo was taken Description (e.g. looking downstream, erosion along right bank, cottonwood-willowcommunity), and Any applicable notes.Photos should be placed in holders and placed into the respective site file.2.1.2.2 Digital PhotosRepresentative digital photos should be downloaded to S:\common\photos\water. Create a newsite folder on the “S” drive using the site ID, if a site folder does not yet exist. LCCOY002.34 andSRROO-A are examples of a correctly <strong>for</strong>matted site IDs. Do not add any extra spaces. File namesshould be in a yyyymmdd <strong>for</strong>mat followed by a one word photo description (ex. 20070930up). BeREVISED SEPTEMBER 2012 25
STANDARD OPERATING PROCEDURES FOR SURFACE WATER QUALITY SAMPLINGselective with as to how many photos you add to the "s" drive. It is helpful to have multipleseasons and multiple years. Do not include 20 different pictures of the same sampling event.Extra pictures should be stored on your hard drive.2.2 EQUIPMENT AND PERSONNEL DECONTAMINATION PROCEDURESThe purpose of this procedure is to provide a description of methods <strong>for</strong> preventing or reducingcross-contamination and a description of methods that will protect the health and safety of sitepersonnel.2.2.1 FIELD EQUIPMENT DECONTAMINATIONAll reusable sampling equipment should be properly cleaned be<strong>for</strong>e going into the field. Whensampling and field activities are completed, sampling equipment that has come in contact withcontaminated or suspect water should be decontaminated be<strong>for</strong>e leaving the site. The purpose ofthe field decontamination procedures is to remove any impurities that might bias the analyticalresults. The field decontamination procedure should provide a quick method of removing mostsample residues from the equipment.2.2.2 SAMPLING EQUIPMENT AND CONTAINERS<strong>Surface</strong> water with known or suspected contamination by biological organisms such as bacteria,viruses, or parasites should be decontaminated with a mixture of bleach and water. A specifiedtechnique is not specified, but two suggestions <strong>for</strong> decontaminating equipment are presented. The bleach/water mixture is contained in a bucket (usually 10%). Equipment is placedinto the bucket and thoroughly brushed with a long handle bottle brush and then rinsedwith either tap or distilled water. For equipment that is too large to fit into the bucket,hold the piece over the bucket and proceed as described above. For churn splitters, poursome of the bleach/water mixture into the container and proceed as described above. A bleach/water mixture is contained in a spray can. The piece of equipment is held over abucket while it is being sprayed with the mixture. The bucket collects the drippings fromthe equipment and disposed of properly. The decontaminated equipment is then rinsedwith either tap or distilled water. The outside and inside surface of churn splitters issprayed and rinsed with either tap or distilled water. The bleach/water residue is collectedin the disposal bucket <strong>for</strong> later disposal.2.3 SAFETY PROCEDURESPersonal safety of staff engaged in any field work activity (e.g., in transit, walking or hiking, and anyfield activities while at the sample site) is of primary importance. Staff should never placethemselves in dangerous or risky situations. Any hazards that are known by field personnel shouldbe communicated to other members of the field crew.Field work should be postponed if there is indication that engagement in the field activity couldcause bodily harm other than the normal risks associated with field work. All field work has riskof personal injury which is stated in the job classifications <strong>for</strong> field work employment; this isnormal risk. Working during lightening storms, at night, during flash flood conditions, or duringREVISED SEPTEMBER 2012 26
STANDARD OPERATING PROCEDURES FOR SURFACE WATER QUALITY SAMPLINGsnowy weather is not considered "normal risk". If any member of the field crew is uncom<strong>for</strong>tablewith a reasonable self-determined hazardous field condition, it is that person’s responsibility tobring this to the attention of the project lead and that person is not required to complete the workassignment. A “reasonable self-determined hazardous field condition” is defined as other thannormal risk. The project lead shall not dismiss any person’s spoken concerns that field conditionsare too hazardous to complete the work assignment.The following sub-sections provide specific guidelines regarding safety while fulfilling field workassignments.2.3.1 FIELD TRIP ROUTING AND TELEPHONE CHECK-IN PROCEDUREBe<strong>for</strong>e any field trip is conducted, a Routing Form or "Float Plan" (FIGURE 2.5) must becompleted. Copies should be given to other staff members assisting on the trip and to the UnitManager or substitute supervisor.REVISED SEPTEMBER 2012 27
STANDARD OPERATING PROCEDURES FOR SURFACE WATER QUALITY SAMPLINGFIGURE 2.5. Monitoring Unit Routing Form2.3.2 SAFETY GUIDELINESSafety guidelines are divided into general, streams and lake safety.2.3.2.1 General Site SafetyThe following guidelines apply to all field work by staff employed in the <strong>Surface</strong> <strong>Water</strong> Section. No sample or measurement is worth the risk of injury. Field sampling crews should consist of at least two members unless otherwise approved bythe supervisor. A copy of the Site Safety Plan shall be provided to all on-site staff. Every sampling projectshall have an approved Site Safety Plan. Minimum requirements <strong>for</strong> the Plan are:o Personal Protective Equipment requirementsREVISED SEPTEMBER 2012 28
STANDARD OPERATING PROCEDURES FOR SURFACE WATER QUALITY SAMPLINGo Required training qualifications (OSHA, MSHA, etc.)o Known and potential hazards and precautionso Directions and map to nearest hospitalo Emergency phone numbers <strong>for</strong> Law en<strong>for</strong>cement, medical emergencies, and privateand public land ownersA Sample Site List indicating hazard awareness and work prohibitions, such as excessiveflash flood risk, excessive night hazards, etc.Be conscious of the whereabouts of rattlesnakes, mountain lions, and other dangerousanimals.Open body wounds are entry sites <strong>for</strong> infection; take the necessary precautions <strong>for</strong> selfprotection.If there is storm activity in the work area, wait <strong>for</strong> safer conditions to develop or postponethe work assignment.Do not sample at night without approval from the supervisor. If night sampling isapproved see Section 2.3.4.Do not trespass on private property, Indian reservations, orposted restricted public lands without prior permission andwritten approval from property owner or administrator.If strange or suspicious looking people are in the work area,either wait <strong>for</strong> them to leave or postpone the work to a latertime. Do not <strong>for</strong>ce confrontations with strangers and backaway from imposed confrontations.Take the necessary precautions against exposure to harmfulweather conditions (e.g. heat, cold, snow, wind).FIGURE 2.6. Pay attention toThe project lead is responsible <strong>for</strong> providing water at the work and respect signs. They aresite <strong>for</strong> drinking and washing. However, it is each person’s there <strong>for</strong> a reason.responsibility to provide enough drinking water <strong>for</strong> their own use on any work assignment.Do not rely upon others <strong>for</strong> water needs. Recommended amounts of water <strong>for</strong> summerwork is two gallons per person in the field vehicle and at least one quart per person awayfrom the vehicle.It is each person’s responsibility to wear proper clothing <strong>for</strong> the type of work to beper<strong>for</strong>med and the expected weather conditions at the work site.A field routing <strong>for</strong>m must be completed be<strong>for</strong>e departure into the field. At a minimum,the field routing <strong>for</strong>m should contain the name of each person on the trip with anemergency contact and the emergency contact's phone number, satellite phone number orcell phone number of field crew, site routing in<strong>for</strong>mation <strong>for</strong> each day with hotel nameand phone numbers, and the name of the person with whom field personnel will check indaily.Carefully evaluate a given on-site situation to determine if the task can be per<strong>for</strong>med safely.Consider potential hazards to avoid and prepare <strong>for</strong> worst-case scenarios.Always look <strong>for</strong> escape routes in case of flash floods.Always respect the on-site opinions of co-workers regarding safety issues.Use a personal flotation device when working around swift or deep waters.Consider bringing a weather radio to get the latest weather in<strong>for</strong>mation.REVISED SEPTEMBER 2012 29
STANDARD OPERATING PROCEDURES FOR SURFACE WATER QUALITY SAMPLING2.3.2.2 Stream Site Safety Wear protective foot wear when entering streams. Do not enter the stream if the water is flowing too fast.o Walking in streams and along stream banks are slip-and-fall conditions and it is theobserver’s responsibility to take appropriate precautions against sustaining personalinjury. When <strong>for</strong>ding a stream, the following requirements are necessary <strong>for</strong> evaluating a safepassage; the depth and velocity of the water at the crossing, the vehicle limitations, andadequate experience and driving skills of the operator. Consider what the depth of waterunder worst conditions could be if a return crossing is necessary. Use extreme cautionwhen entering water deeper than the truck’s axle or where the water is higher than thebottom of the truck.2.3.2.3 Lake Site SafetyA safe trip will depend on bringing all the necessary equipment (see Appendix A) and goodcommunication between team members, especially when launching or trailering the boat.A “safety meeting” should be held be<strong>for</strong>e going out on the lake. The trip lead should brieflydescribe the weather conditions expected <strong>for</strong> the day and provide the crew with in<strong>for</strong>mation aboutthe day’s objectives and safety considerations (ex. drive slowly at the north end of the lake becauseit’s shallow). Make sure everyone knows where the first aid kit or other safety equipment islocated. A life jacket is required on-board <strong>for</strong> each person. Give the crew a chance to askquestions or bring up any other concernsSlipping hazards can be avoided by wearing a shoe with a gripping sole (don’t wear flip flops).2.3.3 SAFETY TRAININGThe following training/monitoring are required <strong>for</strong> all monitoring personnel.1. First aid2. OSHA - Awareness3. Boat safety (Lakes personnel)4. CPR2.3.4 STORMWATER NIGHTTIME SAMPLING FIELD SAFETY GUIDELINESAll daytime safety guidelines apply to nighttime sampling. Additional guidelines <strong>for</strong>nighttime sampling are listed.Participation in nighttime stormwater sampling is voluntary.Fording a stream at night under stormy conditions is dangerous and extreme cautionshould be exercised when doing so.Wear a personal flotation device when entering a stream.Use a headlamp.Do not hike more than 500-feet from the field vehicle.REVISED SEPTEMBER 2012 30
STANDARD OPERATING PROCEDURES FOR SURFACE WATER QUALITY SAMPLINGTake either a satellite phone or cell phone. A cell phone is sufficient if excellent cell phonecoverage is available at the site. If cell phone coverage is insufficient, a satellite phone isrequired.Call or leave a message with the supervisor be<strong>for</strong>e leaving after normal work hours and callinno later than 0900 hours by the next day.For sites considered too hazardous to sample at night, reevaluate those sites the nextmorning be<strong>for</strong>e proceeding to take samples.Use a weather radio to get the latest weather in<strong>for</strong>mation.2.3.5 BOAT SAFETYADEQ currently uses a pontoon boat, an aluminumboat and a raft to complete lake work.The pontoon boat’s gas tank holds approximately 20gallons and needs to be filled with unleaded gas 87octane or higher quality. The pontoon is startedwith a key ignition (FIGURE 2.7).The aluminum boat has a gas tank on board. Re-fillit as necessary with high-per<strong>for</strong>mance unleaded gas.Prep the motor with the hand pump and make surethe motor is set to “start” on the throttle. Pull thecord (like a lawnmower) several times to get themotor started.Life vests are legally required to be on-board <strong>for</strong> eachpassenger. The crew should have taken the 8-hourBoating Safety course provided by the Coast Guardin order to become familiar with proper boatingprocedures.FIGURE 2.7. Backing the pontoon into the lake.2.3.5.1 Pre-trip checklist Bring boat license aboard Remove cover, fold up and store under console Visually inspect <strong>for</strong> obvious damage on boat and trailer including breaks, cracks, loosebolts Bearings are greased Motor mountings are secure Rails are secured to the frame No oil leaks Check power on battery, navigation lights and horn Check that power steering fluid level is full Tires (including spare) have no cracks or wear and have adequate pressure Tie-downs on bow (hand crank) and stern (straps) are not worn and are secureREVISED SEPTEMBER 2012 31
STANDARD OPERATING PROCEDURES FOR SURFACE WATER QUALITY SAMPLINGMotor oil levels are adequate (dipstick is accessed by removing the hard plastic cover overthe motor)Fuel level is adequate (considering trip duration and access to gasoline)Safety chains and electrical adaptor are connectedHitch is secured with cotter pinTest electrical <strong>for</strong> signals, brake lights, and taillightsRemove tire chocksAs you are pulling away from the parking space listen <strong>for</strong> any strange noises coming fromthe trailer2.3.5.2 Launching the boat Disconnect stern straps and unhook bow clip on crankDisconnect trailer lights from truck electrical power point (otherwise it will blow afuse)Turn on batteriesLoad the boat with equipmentSet up the bimini cover if necessaryCommunicate with others about where the person who is responsible <strong>for</strong> parking the truckand trailer will be picked upCheck the boat ramp <strong>for</strong> hazards (swimmers, debris, parked vehicles, etc.)Slowly back boat into the water until you see the stern floatStart boat and slowly back off the trailerLet the boat warm up a couple minutes be<strong>for</strong>e idling out of no wake zone (get away fromthe ramp and do not impede boat traffic at ramp)2.3.5.3 Returning from a trip2.3.5.3.1 Putting the boat back on the trailer Assist the driver of the truck in backing into the water but don’t let him/her immerse thetailpipe Observe the water depth and raise the motor if necessary (without taking the intake out ofthe water) Slowly drive the boat back up onto the trailer rails Hook up bow clip, crank tight, and put in lock position Drive boat out of water. While still on the ramp, remove plugs from pontoons and drainout water if necessary. Replace plugs after pontoons drain. Pull boat up to parking lot Replace stern straps Turn off the batteries Reconnect electrical trailer/vehicle connections Remove anything from boat deck that is not secure <strong>for</strong> highway travel Take out key and store it with you in truckREVISED SEPTEMBER 2012 32
STANDARD OPERATING PROCEDURES FOR SURFACE WATER QUALITY SAMPLING2.3.5.3.2 Returning equipment and decontaminationReturn all equipment to its previous location. Clean field equipment as needed. If anywork/maintenance is needed on the boat, log it in the logbook and work with the lab coordinatorto get the necessary supplies or repairs.De-contamination prevents the spread of invasive aquatic plants and animals. After every trip,remove any aquatic plants from the anchors, boat and trailer.Decontaminate the boat after each trip. To decontaminate, spray the boat and trailer withquaternary ammonia (recommended by Game and Fish as of February 2008) or with a 10% bleachsolution or use the decontamination method prescribed by Game and Fish. Be sure todecontaminate any surfaces that were in the water including the trailer, the hull, anchors, anchorropes and other equipment.Be<strong>for</strong>e leaving the boat parked, turn off batteries, cover the boat and place tire chocks so that theboat cannot roll <strong>for</strong>ward or backward.2.3.6 BORDER SAFETYThe following procedures are to be followed when working in remote areas located within 20 milesof the Mexican Border. Increased border activity has resulted in more frequent encounters, thefts,break-ins, and resource destruction. Encounters with illegal immigrants and drug smugglers arepotentially dangerous and special precautions need to be taken to ensure employee safety. Projectsthat are located near populated areas (within city limits) may follow modified border safetyprocedures but prior approval will be needed from the Section Manager.The following requirements are necessary <strong>for</strong> any employee to work near the border.2.3.6.1 Physical abilities: Able to hike over rugged terrain and caring 40lbs; and Have no physical limitations that would prevent prolonged exposure to inclement weather.2.3.6.2 Training: First Aid and CPR; Wilderness First Aid; Familiarity with USFS Border Safety Documents; and Review Border Safety DVD.2.3.6.3 Pre-trip ActivitiesPrior to starting fieldwork (the day be<strong>for</strong>e or on the way, as time permits) the project managershould contact the local Border Patrol Station, USFS District Office, and/or County Sheriff todetermine if the area where fieldwork is being conducted is experiencing any activity that is out ofthe ordinary or is overtly dangerous at the moment and to in<strong>for</strong>m them of our plans, see AppendixK <strong>for</strong> a list of local agency contacts. You should provide the local agencies with a description of theREVISED SEPTEMBER 2012 33
STANDARD OPERATING PROCEDURES FOR SURFACE WATER QUALITY SAMPLINGvehicle, number of people working in the field, along with the location and duration of the fieldactivities. If the project manager receives in<strong>for</strong>mation that the area should not be entered then thetrip will need to be rescheduled.The routine ADEQ contact evening check-in policy is not adequate <strong>for</strong> fieldwork near the border.The project manager, in consultation with their Unit Manager, will determine the appropriate callininterval <strong>for</strong> the project. It is recommended that <strong>for</strong> work in remote areas that an initial call-inshould be made as the field crew enters the area and then every 1-2 hours (maximum, butdependent on field conditions) while in the area followed by a check-out call as they leave the area.It is the responsibility of the project manager to ensure that the call-in schedule is followed. Ifthere are multiple teams involved in the sampling ef<strong>for</strong>t each team must have and follow a call-inschedule. The designated ADEQ contact must be available by phone <strong>for</strong> the entire period thatemployees are in the field, the ADEQ should provide work, home, and cell phone numbers.There will a 30 minute maximum grace period <strong>for</strong> the field team to call in be<strong>for</strong>e the ADEQcontact will begin trying to contact the employees in the field, if after another 30 minutes nocontact is made, the ADEQ contact will in<strong>for</strong>m the local agencies of the situation and ask <strong>for</strong>assistance. For example if the call-in time is 1300 and no message is received by 1330 the ADEQcontact will begin calling all of the available numbers (ADEQ and personal) on the routing <strong>for</strong>m, ifby 1400 no contact is made the ADEQ contact will then call the local contacts to seek assistance.It is imperative that both the project manager and ADEQ contact follow the call-in proceduresoutlined to ensure that help is sent when necessary but also that false alarms do not happen.2.3.6.4 Develop routing slip Know the area and your route- ensure you have accurate maps; If you are sampling established sites include directions to sites and include the latitude andlongitude (include datum), if conducting recon provide a description of the area you willbe working in (specify area on a map); Include specific check-in/check-out procedures; Include local contacts (county sheriff, USFS, Border Patrol, and other active agencies inthe area) on the routing <strong>for</strong>m- each field person must have a copy along with the ADEQcontact; Do not alter your route/timing until you have in<strong>for</strong>med the ADEQ contact of the changein plans; Include all phone numbers that will be taken in the field- ADEQ satellite and cell phonesalong with employee personal cell phone numbers;2.3.6.5 Field ActivitiesOnce you are in the project area continually assess your surroundings and stay alert- expect theunexpected. Look <strong>for</strong> indications of recent activity (voices, foot prints, water bottles, food,clothing, etc). While conducting fieldwork make your presence known. Talk to coworkers whileworking, honk the horn when arriving at a site, blow your safety whistle periodically this will alertanyone in the area that you are there and cause them to avoid you if that is their intention.REVISED SEPTEMBER 2012 34
STANDARD OPERATING PROCEDURES FOR SURFACE WATER QUALITY SAMPLING2.3.6.6 In-field safety protocols- Review the project Health and Safety Plan and routing <strong>for</strong>m details with all coworkersbe<strong>for</strong>e arriving at first site; Follow call-in protocols; Be sure to lock vehicle (doors and shell), take water, phones, and personal items) with youwhen leaving vehicle; Park nose out; Stay alert; Avoid confrontation; If you encounter someone play dumb- ask them if they have seen any water in the stream;make it clear you are not there looking <strong>for</strong> them; Work in pairs- at no time should employees be alone while conducting fieldwork.2.3.6.7 Post-trip ActivitiesUpon completion of field activities and after leaving the area, check-out with the ADEQ contact toensure that they know you are no longer in the area thus completing the predetermined call-inschedule. Any suspicious activity should be reported to the appropriate Border Patrol Station afterleaving the area. The project manager must in<strong>for</strong>m the ADEQ contact when the field crew hasreturned the office or hotel <strong>for</strong> the evening. The project safety procedures should be reviewed bythe project manager after each sampling event and adjusted as warranted.2.3.6.8 Additional safety precautions that may be taken: Deploy bilingual signs (on automated equipment, placed in stream when working, etc); Provide/learn common Spanish phrases (cheat sheet style); Determine if any local agencies will loan out a radio to ADEQ when in the area <strong>for</strong>emergency use only; Most illegal crossers want to avoid contact or confrontation, diffuse any situation by beingnon confrontational (back away from encounters, raise hands, etc); Stay together, no solo wonderings; Do not attempt to render aid to unknown persons (it may be a decoy/ploy) to get you outof the vehicle. Call <strong>for</strong> aid after leaving the area; If you fell uncom<strong>for</strong>table about the situation or something just does not seem right- leave; Ask local agency <strong>for</strong> an escort; Avoid handling trash and unknown substances.REVISED SEPTEMBER 2012 35
STANDARD OPERATING PROCEDURES FOR SURFACE WATER QUALITY SAMPLINGCHAPTER 3CHEMISTRY PROCEDURESThis chapter describes how to collect chemistry data <strong>for</strong> lakes and streams. The chapter beginswith field measurements and then goes over how to collect water samples in streams and lakes thatwill be sent to a laboratory.3.1 FIELD MEASUREMENTS3.1.1 DISSOLVED OXYGEN, CONDUCTIVITY, PH, TEMPERATURE, AND DEPTHThe following sections provide general instructions that cover both the YSI and Hydrolabmultiprobes <strong>for</strong> lakes and streams. Additional detail regarding such topics as data logging can befound in the applicable Multimeter manual.For streams, the stirrer on the Hydrolab should be turned on when flow velocity is lessthan 1 ft./sec.3.1.1.1 Dissolved OxygenDissolved oxygen concentrations fluctuate throughout the day. Concentrations are typicallyhighest a little after noon and are lowest at night just be<strong>for</strong>e dawn. At the sample site, thedissolved oxygen probe must be calibrated be<strong>for</strong>e immersion into a lake or stream. Record allparameter readings on the field data sheet.1. Fill the calibration cup with water to below the DO probe (do not cover the membranewith water).2. If there is any moisture on the DO membrane, blot it gently with a lintfreeabsorbent cloth or tissue such as a chem wipe to remove any waterdroplets. Use a material that is non-abrasive.3. Invert the cap and slide it over the top of the calibration cup, and thenlet the unit sit <strong>for</strong> about 5 minutes to allow the conditions inside thecup to stabilize. Do not screw the cap back on as this will increasepressure inside the calibration cup.4. Determine ambient air pressure.5. Be<strong>for</strong>e calibrating the DO, record the pre-calibration percent saturationvalue after the unit has stabilized.6. Using the calibration menu <strong>for</strong> % saturation, enter the current airpressure when prompted.7. Record the new DO percent saturation reading, which should be at ornear 100%. The percent saturation reading should not drift <strong>for</strong> about20 to 30 seconds after the calibration procedure.8. After calibrating the DO probe, ensure that the cables are securelyattached to both the sonde (or minisonde) unit and the read-out unit.9. Attach the probe guard (this is a part of the stirrer unit on the olderFIGURE 3.1.Proper capposition.sonde units) be<strong>for</strong>e placing the unit in the stream or lake to avoid damage to the probes.10. Place the sonde in the water body.11. Allow a few minutes <strong>for</strong> the meter to stabilize and then record the DO readings.REVISED SEPTEMBER 2012 36
STANDARD OPERATING PROCEDURES FOR SURFACE WATER QUALITY SAMPLING3.1.1.2 Depth (Lakes)For lakes the multiprobe must also be calibrated <strong>for</strong> depth.1. Place the probe in the water at a depth of 10 cm.2. Calibrate the depth to 0.1 m.3.1.1.3 Specific Electrical Conductivity, pH, and TemperatureWith stirrer or probe guard attached, allow meter to stabilize and take reading.3.1.2 MULTIPROBE PLACEMENT3.1.2.1 Stream Multiprobe PlacementPlace the Multiprobe at the base of a riffle or other areas where the water is moving swiftly(FIGURE 3.2).FIGURE 3.2. Field parameter collection in a stream.3.1.2.2 Lake Multiprobe Placement / Determining Lake StratificationSee Section 3.4.REVISED SEPTEMBER 2012 37
STANDARD OPERATING PROCEDURES FOR SURFACE WATER QUALITY SAMPLING3.1.3 TURBIDITYPrecise measurements <strong>for</strong> very low turbidity samples require optically calibratedsample vials. Refer to the Hach Turbidity Manual <strong>for</strong> this procedure.For the battery voltage check, press the Diagnostic key identified as DIAG. Thenumber displayed is the battery voltage.1. It is recommended that the Hach Turbidity meter beplaced on a flat surface <strong>for</strong> taking measurements. Choosea Gelex Secondary Reference <strong>Standard</strong> that has a turbidityvalue close to that of the stream or lake (Hach Company,1993). Thoroughly clean the outer surface of theReference <strong>Standard</strong> vial of fingerprints, water spots, andevaporate by applying a thin coat of silicone oil and wipewith velvet cloth.2. Insert the selected Reference <strong>Standard</strong> into the instrumentcell compartment with the white triangle on the vialaligned to the raised orientation mark on the instrumentand take the measurement. The displayed value should bewithin 5% of the calibration value. If the differencebetween the measurement and the Reference <strong>Standard</strong>calibration value is greater than 5%, re-clean and re-oil theFIGURE 3.4. Hach TurbidityGelex Reference <strong>Standard</strong> vial, and take another Meter.measurement. If the problem persists, record the valueson the Field Data Sheet together with a description of the problem.The turbidity value should be qualified if the percent difference between the actualresult and the Reference <strong>Standard</strong> is between 5 and 10 percent. Anything greater than11 percent should not be entered into the database at all.3. Rinse an empty sample vial several times with stream water. Fill the vial with stream water,replace the cap and wipe the outside surface clean and dry with a soft cotton cloth. Forgrab samples, the location of the sample should be representative of the entire flow. Forcomposite samples, go through the rinsing process and take the water from the agitatedchurn splitter to ensure complete mixing of the suspended matter.If there is any delay between when the vial is filled with stream or composite water andthe measurement, invert the vial several times be<strong>for</strong>e placing it into the instrumentcell compartment.4. Take at least three turbidity readings. This can be accomplished with two methods; by themeter default or by use of the Signal Average Key. The default setting (Signal Average off)will internally average three measurements and display the result. The signal averagingREVISED SEPTEMBER 2012 38
STANDARD OPERATING PROCEDURES FOR SURFACE WATER QUALITY SAMPLING(Signal Average on) mode averages 10 measurements every 1.2 seconds which compensates<strong>for</strong> measurement fluctuations caused by the drifting of sample particles through the lightpath. After 22 seconds, the average of the 10 measurements is displayed.5. Record the displayed reading and measurement type onto the Field Data Sheet.6. For very turbid waters, the meter may display a flashing "1,000" value or E-3 error message.This indicates that the turbidity value is greater than 1,000 NTUs. There are two optionswith this condition: 1) per<strong>for</strong>m a dilution, or record the results as >1,000 NTU. Note thison the field data sheet. Per<strong>for</strong>ming the dilution will give a more accurate turbidity value.7. Add deionized water to the sample vile when sampling is complete.3.1.3.1 Per<strong>for</strong>ming a Dilution <strong>for</strong> Turbidity1. It is recommended that a dilution factor (DF) of 10 be used <strong>for</strong> the turbidity calculation.The DF is the multiplier <strong>for</strong> the meter reading. For example, if the operator were todispense 9 mL of deionized water into a 10 mL graduated cylinder and 1 mL of samplewater, <strong>for</strong> a total of 10 mL, the DF is 10 (a ratio of 9:1); there<strong>for</strong>e, the turbidity value is themeter reading times 10.2. For samples that are extremely turbid, it may be necessary to make more than one dilutionto obtain a meter reading less than 1,000. For multiple dilutions, the procedure is thesame as described above; however, <strong>for</strong> the second dilution, the 9:1 diluted sample becomesthe sample to be diluted. If this is the case, and a 9:1 dilution is per<strong>for</strong>med a second time,the DF is 100 (DF of 10 <strong>for</strong> the first dilution and DF of 10 <strong>for</strong> the second dilution). Theturbidity value is simply the meter reading times 100.3.1.4 HACH DR/700 COLORIMETER FOR CHLORINE ANALYSISThis procedure describes how to measure free and total chlorine with the Hach DR / 700Colorimeter (Hach Company 1993).3.1.4.1 Field Procedure <strong>for</strong> Measuring Free Available Chlorine1. After powering on the instrument, a six digit number, such as 52.05.01, will appear at thebottom of the display window. This is the number of one of several filter modules that arefactory installed. The filter module number required <strong>for</strong> the free chlorine analysis is52.07.1. If a number other than the free chlorine module is displayed, press the up arrowkey, in the edit box, until the correct number appears.2. Inspect the sample vials provided with the meter <strong>for</strong> any discoloration of the glass surfaceor any evaporate remaining from the last analysis. The vials should have been thoroughlywashed with a chlorine free detergent and rinsed with deionized water be<strong>for</strong>e field use.3. Triple rinse the vials with sample water and fill a 25 mL vial with sample. Check sampleacidity with pH paper. pH needs to be between 6 and 7. If pH >7, add one drop ofsulfuric acid solution and measure pH again. Repeat until pH is between 6 and 7.4. Pour 10 ml of solution into 2-10 ml vials. Place one vial into the cell holder and pressZERO (display will count down). Add the contents of one DPD Free Chlorine PowderPillow into other vial and shake <strong>for</strong> 20 seconds. Immediately place vial into cell holder andpress READ. Display will count down then show result. Record result.REVISED SEPTEMBER 2012 39
STANDARD OPERATING PROCEDURES FOR SURFACE WATER QUALITY SAMPLING5. Next, determine any result interferences. This is done by filling a 25 ml vial with sample.Next, Check sample acidity with ph paper. pH needs to be between 6 and 7. If pH > 7,add one drop of sulfuric acid solution and measure pH again. Repeat until pH is between6 and 7.6. Add 3 drops of Potassium Iodide Solution to 25 ml vial, mix and wait 1 minute. Add 3drops of Sodium Arsenite and mix.7. Pour 10 ml of solution into a 10 ml vial. Add the contents of one DPD Free ChlorinePowder Pillow into vial and shake <strong>for</strong> 20 seconds. Immediately place vial into cell holderand press READ. Display will count down then show result. Record result. Subtract thisresult from original result (obtained in #4) to obtain the accurate chlorine result.3.1.4.2 Field Procedure <strong>for</strong> Measuring Total ChlorineFollow the procedures <strong>for</strong> measuring Free Chlorine above except use the Total Chlorine PowderPillows and wait 3 minutes be<strong>for</strong>e placing the vial into the cell holder.3.1.5 AIR TEMPERATUREA variety of thermometers are used to collect air temperature readings.When taking a reading do not place the thermometer in direct sunlight andavoid letting the probe come in contact with the ground.Figure3.5. Thermometer.3.2 COLLECTING WATER CHEMISTRY SAMPLES3.2.1 GENERAL INFORMATION3.2.1.1 <strong>Sampling</strong> OrderThe order of sample collection, processing, and preservation <strong>for</strong> specific analytes should bedetermined be<strong>for</strong>e beginning field work and adhered to consistently. TABLE 3.1 describes theorder of sample collection (USGS Field Manual, 2004).Order Parameter1 Organic compounds. Do not field rinse bottles.2 Total, dissolved, and suspended organic carbon3 Inorganic constituents, nutrients, radiochemicals, isotopes: Collect raw samples first,followed by filtered samples. (Field rinse each bottle, as required.)a. Trace metals.b. Separate-treatment constituents (such as mercury, arsenic, selenium) andmajor cations.c. Major anions, alkalinity, and nutrients. Chill nutrients immediately.d. Radiochemicals and isotopes.4 MicroorganismsTABLE 3.1. <strong>Sampling</strong> order <strong>for</strong> surface water samples.For composite samples, Suspended Sediment Concentration should be collected fromthe churn splitter first.REVISED SEPTEMBER 2012 40
STANDARD OPERATING PROCEDURES FOR SURFACE WATER QUALITY SAMPLING3.2.1.2 Sample Bottle LabelingEach water sample bottle must be labeled with a site code, a site location description, samplecollection time and date, analysis, the initials of the observer collecting the water sample, and theagency name. Label the bottle with the appropriate acid sticker if preservative is added. Use ablack or blue permanent marking pen, such as a Sharpie or other similar product, to label drybottles. Handwriting must be precise and legible. Bottles are labeled in the order presented below(FIGURE 3.6). Use clear tape to affix the label.It is important that the bottle label in<strong>for</strong>mation matches the in<strong>for</strong>mation on the Chainof Custody exactly. If an abbreviation is used on the bottle then use the sameabbreviation on the Chain of Custody.Sample site identification codeA sample site is given a code based on the water basin, name of the stream or lake, and the rivermiles or lake monitoring site. Each code is unique <strong>for</strong> a given sample site. Section 10.5.1 explainshow sites are named.Site location description (optional, except when a site code has not been assigned)This is a brief generalized description that attempts to convey the location of the sampling point.The description will normally reference a permanent physical feature of some type. An example ofthis would be “Spring Creek below confluence with Dry Creek,” or “Cienega Creek above MarshStation Road Bridge.” If a permanent physical feature is unavailable, the description may be asnon-specific as “Trout Creek near Wikieup.” Avoid using descriptions that are similar to other sitedescriptions.Sample collection time and dateMark sample bottles with the collection time and date that appears on the field data sheet.Collection times are reported as sidereal (military) time (e.g., 2:30 p.m. = 1430 hours).Agency nameThe placement of the agency name on the bottle in<strong>for</strong>ms the receiving lab of the billing entity. Ifsamples have been collected and submitted <strong>for</strong> another agency or program that has interest in thesample site, label the bottle as “ADEQ <strong>for</strong> AGFD (or TMDL, etc.).”AnalysisIndicate what type of analysis the lab should run (ex. Total metals, nutrients, SSC, dissolvedmetals, or inorganics)Sampler’s initialsThe sampler's initials indicate the person responsible <strong>for</strong> collecting and submitting the watersample. Initials of other field personnel may be applied to the bottle.REVISED SEPTEMBER 2012 41
STANDARD OPERATING PROCEDURES FOR SURFACE WATER QUALITY SAMPLINGCLGLR010.53Gila River nearDome143004/24/08Total MetalsADEQDM / LLNitricAcidHNO 3QC1Total MetalsADEQDM / LLNitricAcidHNO 3FIGURE 3.6. Properly labeled bottle (left) and a properly labeled QC bottle (right).Miscellaneous Labeling Requirements <strong>Water</strong> samples that are field filtered must be labeled as “FieldFiltered.” When field filtering cannot be per<strong>for</strong>med because offiltering equipment malfunctions, label the bottle “To Be Filtered”and make note on the laboratory submittal <strong>for</strong>m. <strong>Water</strong> samples that are collected <strong>for</strong> suspended sedimentconcentration analysis are labeled prominently as “SSC.” Dissolved and total metal samples should be acidified and labeledwith a nitric acid sticker. Nutrient samples should be acidified andlabeled with a sulfuric acid sticker. If problems arise with the acidpreservative labels or there is a possibility of them wearing or fallingoff the bottles during transport, mark the bottles as either “sulfuricacid” or “nitric acid.” Quality control samples should not be identified so as not to bias the lab. QC samplesshould be labeled as in FIGURE 3.6. Be sure to write on field <strong>for</strong>m exactly how youidentified the QC sample.3.2.2 COLLECTION BOTTLESThe laboratory will specify the types of collection bottles they would like samples submitted in.The bottle must have been decontaminated by either the lab supplying the bottle or by ADEQpersonnel. The lab currently uses 500 mL bottles <strong>for</strong> the dissolved metals, total metals andnutrients. They use 1 L bottles <strong>for</strong> SSC and inorganics.REVISED SEPTEMBER 2012 42
STANDARD OPERATING PROCEDURES FOR SURFACE WATER QUALITY SAMPLINGThe number of bottles required per site will be dependent on the parameters being analyzed.FIGURE 3.7 illustrates a typical bottle set used in ambient stream monitoring.filterHNO3HNO3H2SO4SuspendedSedimentConcentrationCollectionJarDissolvedMetalsTotalMetalsNutrients(ex. N &P)Inorganics(ex. cations& anions)FIGURE 3.7. A typical bottle set <strong>for</strong> ambient stream monitoring.FIGURE 3.8. A typical bottle set <strong>for</strong> ambient lake monitoring.If the sample plan calls <strong>for</strong> the analysis of total cyanide, a sample bottle prepared with a solution ofsodium hydroxide is required. When total sulfides are to be analyzed, a sample bottle that hasbeen prepared with a solution of zinc acetate and sodium hydroxide is required. The laboratorycan supply the preserved bottles upon request.When sampling a water body that receives discharges of treated effluent, or iscomposed primarily of treated effluent discharges, a sample <strong>for</strong> biochemical oxygendemand (BOD) analysis may be required. A BOD sample bottle is typically blackplastic or amber glass with an air-tight cap.Bottles containing acids or bases as preservatives must always be handled with care.Nitrile gloves and eye protection should be worn <strong>for</strong> safety. Ensure that sample bottlecaps are tight be<strong>for</strong>e transporting. Acid spilt on skin or clothes must be rinsed andREVISED SEPTEMBER 2012 43
STANDARD OPERATING PROCEDURES FOR SURFACE WATER QUALITY SAMPLINGdiluted immediately with clean water. When transporting acid vials or lab preservedsample bottles, keep them separated by preservative type. Some sample preservativescan be chemically incompatible and may react violently when mixed.3.2.3 FILTERING DISSOLVED METALSThe analysis of dissolved metals requires filtration of the watersample prior to preserving the sample with nitric acid. The Code ofFederal Regulations (Title 40, Part 122, Section 136, Table II)requires that samples be filtered within 15 minutes of collection.This is not always possible.Data should be qualified if filtration occurs after the 15minute limit.An unpreserved water sample consists of two analytical componentsof interest: suspended metals and dissolved metals. Suspendedmetals are defined as the portion of a water sample that is unable topass through a membrane filter with a 0.45 micrometer pore size.Dissolved metals are those in solution which are able to passthrough the same membrane filter.FIGURE 3.9. Groundwatersampling capsuleADEQ currently uses peristaltic pumps thatoperate from any external 12 volt DC or 120volt AC power source, thus allowing thesample to be filtered in either the laboratory orthe field. Typically the pumps are equippedwith easy-load pump heads, but some pumpsmay be equipped with the factory suppliedstandard pump head design.The groundwater sampling capsule currentlyutilized by ADEQ (FIGURE 3.9) is able tofilter waters with high suspended sedimentconcentrations. However, a smaller lessexpensive filter is available when filtering waterwith low sediment concentration.Transparent water can usually be filtered with asmaller filter. All filters should be qualitycertified by the supplier. Filters are designed<strong>for</strong> a single use and should be disposed of aftereach filtration.Steps to filter a dissolved metal sample1. Two clean sample bottles are required;FIGURE 3.10. Filtering set-up. Note the peristalticpump, tubing, collection bottle, receiving bottle, filterand nitrile gloves.REVISED SEPTEMBER 2012 44
STANDARD OPERATING PROCEDURES FOR SURFACE WATER QUALITY SAMPLINGone in which to collect the water, and the second to contain the filtered water. The secondbottle should be labeled “Dissolved Metals.” or "Field Filtered".2. Place the pump on a hard, flat surface (e.g. a table or the pickup tailgate). Position it suchthat the pump head of the mechanism extends over the edge of the stationary surface(FIGURE 3.10). Remove a section of the clean, pre-cut tubing from the re-sealable plasticbag. Always handle the tubing near the middle to prevent the tube ends from beingcontaminated.3. Insert the tubing into the pump mechanism such that both ends are hanging loosely, butnot in contact with any surface. Remove the filter from its packaging, taking care to notcontaminate the nipple ends of the capsule. Securely attach the tubing to the filter.4. Check the pump controls to ensure the flow direction of the pump is congruent with theflow direction of the capsule filter. Place the end of the tubing without the filter intoeither the bottle or the churn splitter.5. Turn the pump on and allow the filter to fill with water be<strong>for</strong>e filling the sample bottle.Allow about twenty five to fifty milliliters of the sample to run out of the out-flow openingto flush the filter. Place the out-flow end of the tubing into the open mouth of the prelabeledfiltrate bottle and fill to nearly full. If the bottle is pre-preserved with acid, do notoverfill the bottle. If nitric acid is to be added after filtering, leave some space in the bottle<strong>for</strong> the addition of the preservative.6. After placing the acid-preserved sample into the ice-chest <strong>for</strong> transport, properly dispose ofthe filter and tubing.3.2.4 ACIDIFYING OR PRESERVING METAL AND NUTRIENT SAMPLESThe Code of Federal Regulations (Title 40, Part 122, Section 136, Table II) requires that metaland nutrient samples be preserved within 15 minutes of collection. Samples that are not preservedwithin 15 minutes should be qualified.Bottle Preservative Amount of AcidNutrients Sulfuric Acid 1 vial (2 mL)Total Metals Nitric Acid 1 vial (5 mL)Dissolved Metals Nitric Acid 1 vial (5 mL)TABLE 3.2. List of preservative amounts to add to nutrients,total metals, and dissolved metals.TABLE 3.2 indicated the correct preservative andquantity <strong>for</strong> each type of analysis. Proper gloves and eyeprotection should be used be<strong>for</strong>e adding acid orfiltering. The acid vials that are currently used areillustrated in FIGURE 3.11.FIGURE 3.11. Acid vialsPrior to adding the preservative, make sure that the bottle is either marked with the type ofpreservative used, or has a color-coded label that corresponds with the preservative vial beingadded. After adding the preservative vial to the sample bottle, replace the cap on the sample bottletightly, and invert the sample bottle several times to mix the sample and preservative.REVISED SEPTEMBER 2012 45
STANDARD OPERATING PROCEDURES FOR SURFACE WATER QUALITY SAMPLINGpH test strips can be used to identify sample bottles that, <strong>for</strong> some reason, may nothave been preserved. Invert the bottle several times to make sure it is well mixed.Pour a small amount over the test strip. Do not place the strip into the bottle. Thetest strip should read a pH of less than 2.To dispose of the emptied acid preservation vials place them into separate double-bagged zip-lockbags. Upon returning to ADEQ headquarters, flush the vials and caps with tap water and placethem in the proper disposal area. Flush the receiving sink of any acid residues with tap water.3.2.5 COLLECTING FIELD WATER CHEMISTRY QUALITY CONTROL SAMPLESThe <strong>Surface</strong> <strong>Water</strong> Section has a draft Quality Assurance Program Plan (QAPP) that addressesquality assurance and control in detail. This section will cover how to collect a quality controlsample, which is just one small part of the <strong>Surface</strong> <strong>Water</strong> Sections overall QAPP. Please refer tothe QAPP <strong>for</strong> additional detail. TABLE 3.3 summarizes how many quality control samples shouldbe taken <strong>for</strong> a given trip. Section 10.6.2 describes the "acceptable limits" <strong>for</strong> contamination inblank samples and differences between duplicates or splits.There are a variety of laboratory quality control samples. This manual will only dealwith field quality assurance and quality control. Read the case narrative of thelaboratory report to determine if there was any quality assurance or quality controlproblems from the lab.3.2.5.1 Quality Control <strong>Sampling</strong> FrequencyParameter Field Splits or Duplicates Equipment / Churn BlanksSSC10 % of Total Number of SamplesD Metals10 % of Total Number of SamplesT Metals10 % of Total Number of SamplesNutrients10 % of Total Number of SamplesInorganics10 % of Total Number of SamplesRadiochemistry 10 % of Total Number of SamplesBacteria (Membrane 100 % of Total Number of Samples (see SOP <strong>for</strong> details)Filter Technique)Clean Metals 1 per dayPesticides10 % of Total Number of SamplesBiocriteria 10 % of Total Number of Samples NoneFish Tissue 5 % of Total Number of Samples NoneAlgae 5 % of Total Number of Samples NoneTABLE 3.3. Number of quality control samples to be collected by parameter.3.2.5.2 BlanksBlank samples are a check <strong>for</strong> cross-contamination during sample collection and shipment, and inthe laboratory. There are three basic types of quality control blanks: trip, field, andequipment/churn. De-ionized water should be used <strong>for</strong> metal parameters. Blanks should beREVISED SEPTEMBER 2012 46
STANDARD OPERATING PROCEDURES FOR SURFACE WATER QUALITY SAMPLINGprepared by the laboratory that supplies the sample containers. The blank should be numbered,packaged, and sealed in the same manner as other samples in the set. Field Blank. A field blank is a water sample that travels with the sample set and is openedand exposed at the sampling point to detect contamination from air exposure. The fieldblank, usually deionized water, may be poured into appropriate containers to simulateactual sampling conditions. Contamination of the sample can be from air exposure duringthe collection process and during storage and transport. Procedure: In the laboratory, fill aclean sample bottle(s) with certified deionized water and transport it to the field. Blanksare typically done <strong>for</strong> total metals, inorganics and nutrients, but not <strong>for</strong> dissolved metals orsuspended sediment concentration. Place the bottle(s) in the processing area (e.g., trucktail gate) in which the environmental sample(s) are being processed. Open the blanksample bottle to expose the blank sample to the atmosphere <strong>for</strong> approximately the sameperiod of time to which an individual environmental sample(s) is exposed during sampleprocessing. Store and transport the blank(s) in the same container as the environmentalsamples.Blanks can be placed throughout the field process to determine where unintendedsources of contamination are coming from. For example, you may put a blank be<strong>for</strong>eand after the field filtration step <strong>for</strong> dissolved metals if you suspected the filter to bethe source of contamination. This process would involve filling the "be<strong>for</strong>e sample"with DI water and capping it. The "after sample" would involve filling the bottle withDI water and then filtering it into another clean bottle.Equipment/Churn Blank. A blank sample is collected <strong>for</strong>m the precleaned samplingequipment in the field prior to collecting the actual field sample. An equipment blank isused to detect contamination introduced by the sampling equipment either directly orthrough improper cleaning. Blank water is used to fill the sampling equipment and thenpoured into appropriate containers. Procedure: While working in the sample site area (e.g.,truck tail gate) in which the environmental sample(s) is being collected and processed, pourthe certified deionized water directly into the precleaned churn sample splitter be<strong>for</strong>enative water has been introduced into the churn splitter. Run some water through thespigot and fill the sample bottle(s). If a churn splitter is not being used, pour the deionizedwater from its container directly into the sample bottle(s). Cap the bottle immediately andlabel. Store and transport the blank(s) in the same container as the environmentalsamples.Trip Blank (not common). A trip blank is a water sample that remains with collectedsamples during transportation and is analyzed along with field samples to check residualcontamination. A trip blank should not be opened by either the sample collector or samplehandlers. Procedure: Store the trip blank in a container or plastic bag such that the blankbottle is not exposed to ambient conditions during transport to the sample site. At thesample site, remove the trip blank from its container and place in the same cooler as thecollected samples during transport to the analyzing laboratory.REVISED SEPTEMBER 2012 47
STANDARD OPERATING PROCEDURES FOR SURFACE WATER QUALITY SAMPLING3.2.5.3 Duplicate and Split SamplesA split sample is one sample that is divided equally into two or more sample containers and thenanalyzed by different analysts or laboratories. Splits samples are taken from a churn splitter thathas been filled with sub-samples and homogenized. Split samples may be equated to “identicaltwins” in that they contain the same chemical composition as each other. Laboratory analyses ofsplit samples ideally produce identical results.Duplicate samples are a set of similar samples collected from the same site, at about the same time,and analyzed in the same manner. Duplicate samples may be equated to “fraternal twins” in thatthey originate from one source but each sample may contain a slightly different chemicalcomposition. Duplicate samples are usually taken when it is not possible to use a churn splitter tocollect sub-samples and produce split samples (i.e., grab samples are collected). Also, some types ofanalyses preclude the use of a plastic churn splitter (e.g., volatile organic chemicals). Duplicate andsplit samples are typically done <strong>for</strong> total metals, inorganics and nutrients, but not <strong>for</strong> dissolvedmetals or suspended sediment concentration.Collection Method1. Splits are taken from a large sample compositor (churn splitter) that has been filled withnumerous subsamples from the source. A 14-liter churn splitter should be used <strong>for</strong> splitsamples. Duplicates may be grab or composite samples.2. The composited split sample is thoroughly mixed be<strong>for</strong>e withdrawing subsamples into twodistinct chemsets of sample bottles <strong>for</strong> laboratory analysis.3. Label appropriately, store and transport the splits in the same container as theenvironmental samples.3.2.6 CHAIN OF CUSTODY AND LABORATORY SAMPLE SUBMITTAL FORMSADEQ has contracts with several laboratories <strong>for</strong> sample analyses. Each has their own set of <strong>for</strong>msto use when submitting samples. An example Chain of Custody is included in FIGURE 3.123.2.6.1 General Chain of Custody Guidelines1. As few people as possible should handle the sample.2. Prior to delivery to the lab, the container holding the samples may be sealed (e.g., evidencetape) <strong>for</strong> security especially if the container is shipped <strong>for</strong> analysis.3. When the samples transfer possession, both parties involved in the transfer (e.g., samplerand lab) must sign, date and note the time on the chain of custody record.REVISED SEPTEMBER 2012 48
STANDARD OPERATING PROCEDURES FOR SURFACE WATER QUALITY SAMPLINGFIGURE 3.12. Completed example of a Chain of Custody3.2.7 CLEAN SAMPLING OF NATURAL WATERS FOR TRACE METALSThis <strong>Standard</strong> <strong>Operating</strong> Procedure is derived from EPA Method 1669. The original methodshould be consulted <strong>for</strong> additional in<strong>for</strong>mation regarding trace metal sampling. However, if thelaboratory providing the sampling equipment provides a methodology <strong>for</strong> clean sampling, thismethodology should be followed. The following clean sampling techniques are a combination ofEPA Method 1669 and the laboratory’s clean sampling methodology.Trace metals are analyzed <strong>for</strong> minute concentrations of metals in dissolved waters. The slightestsample contamination will affect the analytical results. The following in<strong>for</strong>mation is an overviewof the clean sampling protocol: Utilizes commercially acid pre-cleaned bottles (high density polyethylene is acceptable) andfiltering equipment Acid cleaned bottles and filtering equipment must be stored and transported in doublebags Must follow clean hands/dirty hands procedures (Section 3.2.7.1) <strong>Water</strong> samples must be field filtered unless they are received by the lab within 48 hours ofcollection. Laboratory filtering is acceptable. If field filtered, a deionized water (DIW)REVISED SEPTEMBER 2012 49
STANDARD OPERATING PROCEDURES FOR SURFACE WATER QUALITY SAMPLINGblank and a filter blank are required and all sample handling, filtering, etc. must becompleted inside a clean box.A field blank or duplicate sample is required3.2.7.1 Clean Hands/Dirty Hands Pre-<strong>Sampling</strong> PrecautionsThe SOP describes field sampling procedures commonly referred to as "clean hands/dirty hands"techniques. Upon arrival at the sampling site, one member of the two person sampling team isdesignated as "dirty hands" and a second member is designated as "clean hands." All operationsinvolving contact with the sample bottle and transfer of the sample from the sample collectiondevice to the sample bottle are handled by the individual designated as clean hands. Dirty hands isresponsible <strong>for</strong> preparation of the sample (except the sample container itself), operation of anymachinery; e.g., pump, and <strong>for</strong> all other activities that do not involve direct contact with thesample.Personnel may wear an unlined, long sleeved wind suit consisting of pants and jacket andconstructed of nylon or other synthetic fiber to prevent mercury adsorbed onto cotton or otherclothing materials from contaminating samples.When sampling <strong>for</strong> mercury on a lake, a fiberglass boat with an electric motor and wooden orfiberglass oars is preferred. The boat should be washed and stored in an area that minimizesexposure to dust and atmospheric particles. If an internal combustion engine is required, itshould be shut off at a distance far enough from the sampling point to avoid contamination, thenthe sampling team should manually propel the boat to the sampling point.3.2.7.2 Manual Grab <strong>Sampling</strong>All sampling personnel must don clean gloves be<strong>for</strong>e commencing sample collection activity. It isimportant to minimize the amount of time that the collection container, filtering equipment, andsample are exposed to ambient air. This is because the analyses can detect trace amounts of metaland mercury from the air can potentially contaminate the sample. To minimize air bornecontamination, the following clean hands/dirty hands technique is used.1. Dirty hands opens the cooler or storage container, removes the double bagged samplebottle from storage, and unzips the outer bag.2. Clean hands opens the inside bag containing the sample collection bottle, removes thebottle, and reseals the inside bag. Dirty hands then reseals the outer bag.3. Clean hands moves to the collection location and submerges the sample bottle underwaterfacing upstream and removes the cap allowing the bottle to fill completely. Recap thebottle underwater (Clean hands must ensure that the sample water does not come intocontact with the air).4. Dirty hands reopens the outer plastic bag, and clean hands opens the inside bag, places thebottle inside, and seals the inner bag.5. Dirty hands seals the outer bag.6. If the sample is to be analyzed <strong>for</strong> dissolved metals, it is filtered in accordance with theprocedure described in Section 3.2.7.5.7. Record the bottle number or other in<strong>for</strong>mation on the Field Data Sheets or field notes.REVISED SEPTEMBER 2012 50
STANDARD OPERATING PROCEDURES FOR SURFACE WATER QUALITY SAMPLING3.2.7.3 Grab <strong>Sampling</strong> with a <strong>Sampling</strong> DeviceThe following details the sampling technique with a suspended grab sampling device; e.g., DH-81grab sampler or peristaltic pump (Lakes).All sampling personnel must don clean gloves be<strong>for</strong>e commencing sample collection activity. If itis necessary to attach a bottle to the device in the field, clean hands per<strong>for</strong>ms this operation insidethe field portable clean bag or box.1. Dirty hands remove the sampling device from its storage container and opens the outerpolyethylene bag.2. Clean hands opens the second polyethylene bag and removes the sampling device. Onthose occasions where it may be possible to pre-attach a sample bottle to the samplingdevice in the laboratory, then the entire assembly, bottle and device, is handled as thebottle alone is in the instructions below.3. Dirty hands open the cooler or storage container, removes the double bagged sample bottlefrom storage, and unzips the outer bag.4. Clean hands open the inside bag containing the sample bottle, removes the bottle, andreseals the inside bag. Dirty hands then reseals the outer bag.5. Clean hands change gloves.6. Dirty hands submerges the sampling device to the desired depth.7. When the bottle is full, dirty hands removes the sampling device from the water.8. Dirty hands returns the sampling device to its large inner plastic bag; clean hands pulls thebottle out of the collar, unscrews the bottle from the sampling device, and caps the bottle.Clean hands and dirty hands then return the bottle to its double bagged storage. If thesampling device is to be re-used, it must be decontaminated in accordance with Section3.2.7.6.3.2.7.4 <strong>Sampling</strong> with a Continuous Flow <strong>Sampling</strong> DeviceBe<strong>for</strong>e putting on wind suits and/or gloves, the sampling team removes the bags containing thepump, tubing, batteries, gloves, plastic wrap, wind suits, and, if samples are to be filtered, thefiltration apparatus from the coolers or storage containers in which they are packed. This sectionapplies primarily to lakes.All sampling personnel must don clean gloves be<strong>for</strong>e commencing sample collection activity.1. Dirty hands removes the pump from its storage bag, and opens the bag containing the newtubing.2. Clean hands installs the tubing while dirty hands holds the pump. Clean hands immersesthe inlet end of the tubing into the sample stream.3. Both clean hands and dirty hands change gloves.4. For lakes, place your pumping device (Geopump) on a stable place near the edge of theboat. Dirty hands stabilize the pump and place tubing between the cogs. Dirty handschange gloves and attach a plastic-coated lead weight to the end of the tubing with a zip tie(approximately 6 inches from the tip). Clean hands lower the tubing off the side of theboat to the desired depth without touching the edge of the boat. Dirty hands turns theREVISED SEPTEMBER 2012 51
STANDARD OPERATING PROCEDURES FOR SURFACE WATER QUALITY SAMPLINGpump on and allows the pump to run <strong>for</strong> 5 to 10 minutes or longer to purge the pump andtubing.5. If the sample is to be filtered, clean hands installs a new cartridge filter at the end of thetubing.6. The sample is collected by rinsing the sample bottle (with the water from the pump) asdictated by the tier being followed and collecting the sample from the pump. The pumptubing and the filter are discarded after use.If sampling <strong>for</strong> mercury, you will collect total mercury, dissolved mercury and methylmercury. Fill your Dissolved bottle first, then remove the filter and continue using thesame tubing to collect the Total Hg and Methyl Hg samples. Have the lab filter thesamples if methyl mercury's 48 hour holding time can be met.Filter blanks should be collected just be<strong>for</strong>e placing the sampling train in the water tocollect a sample from depth. After the filter blank is collected place the tubing at theappropriate depth and purge the line and filter (same filter as used in blank) be<strong>for</strong>ecollecting the dissolved mercury sample. After the dissolved sample is collected removethe filter and collect the total and methyl samples.3.2.7.5 Field FilteringThe sampling procedures described in Sections 3.2.7.2 and 3.2.7.3 are used <strong>for</strong> samples collectedusing manual collection systems which require a separate filtering step. Clean sampling filteringapparatus and instructions <strong>for</strong> use are provided with the sampling bottles from the laboratory.The procedures below are used <strong>for</strong> sampling with Albion equipment.If samples are not field filtered then the samples must be shipped to the lab andfiltered within 48 hours of sample collection.3.2.7.5.1 Processing Field Blank and Dissolved Lead and Copper Samples:Wearing clean gloves and working inside the clean bag (each site needs a new clean bag):1. Take the syringe filled with blank water and remove from double bags.2. Remove the end cap from the syringe and turn the syringe outlet end up. Push plunger toexpel the air and a small amount of water.3. Install the syringe filter and turn syringe outlet down. Purge approximately 5 mL throughthe filter and discard the rinse water.4. Place the syringe filter flush against the 60 mL bottle rim and apply steady, even pressure,and filter the entire contents of the syringe into the sample bottle.5. Remove the syringe filter and place it in its original bag.6. Remove syringe plunger and place it in its original bag.7. Reinstall filter on syringe and fill with sample water from syringe grab bottle up to stop ring(55 mL). Make sure to shake up sample.8. Reinstall plunger, turn syringe upright, remove filter, and purge air and small amount ofwater.9. Reinstall filter and purge 5 mL of rinse water.REVISED SEPTEMBER 2012 52
STANDARD OPERATING PROCEDURES FOR SURFACE WATER QUALITY SAMPLING10. Place syringe filter flush against the 60 mL bottle rim and apply steady even pressure. Itmay take 2-3 min. to filter contents. Only 50-55 mL of sample water needs to be filteredfrom syringe grab bottle.11. Recap sample bottle and put into original double bags and record bottle identificationnumber.3.2.7.5.2 Processing Field Blank <strong>for</strong> Mercury Sample (red dot equipment):Wearing clean gloves and working inside the clean bag:1. Take the Hg-free blank water andremove from double bags.2. Remove the syringe filter from itsdouble bags, remove the protectiveend caps. Restore the open filter inits original bag.3. Remove the syringe plungercompletely from the syringe bodyand place it in the original doublebag.4. Reinstall filter on syringe and fillwith Hg-free blank water up to stopring (55 mL). Recap the blankwater bottle.5. Remove filter from the syringe andturn the syringe outlet end up.Push plunger to expel the air and asmall amount of water.FIGURE 3.13. Field filtering of clean metals.6. Install the syringe filter and turn syringe outlet down. Purge approximately 5 mL throughthe filter and discard the rinse water.7. Place the syringe filter flush against the 250 mL syringe field blank bottle rim and applysteady, even pressure, and filter the entire contents of the syringe into the sample bottle.8. Repeat steps 2 to 7 until 100 mL of blank water is obtained in the syringe field blankbottle.9. Recap sample bottle and put into original double bags and record bottle identificationnumber.Process the mercury sample from the 250 mL syringe grab bottle into the 250 mL composite bottle(Hg) using the above method until 100 mL is obtained. Make sure to shake sample thoroughly.Field duplicates are processed using the above methodology.3.2.7.6 Field Decontamination of Equipment<strong>Sampling</strong> activity can be planned such that sufficient equipment is brought to the field that fielddecontamination of the sampling equipment between samples in unnecessary. If it is not possibleREVISED SEPTEMBER 2012 53
STANDARD OPERATING PROCEDURES FOR SURFACE WATER QUALITY SAMPLINGto plan sampling activity in this manner, dedicated sampling equipment should be provided <strong>for</strong>each sampling event.If samples are collected from adjacent sites of the same source water (e.g., immediately upstream ordownstream), rinsing of the sampling apparatus (i.e. tubing) with water that is to be sampledshould be sufficient.If it is necessary to cross a gradient (i.e., going from a high concentration sample to a lowconcentration sample), such as might occur when collecting at a second site, the followingprocedure may be used to clean the sampling equipment between samples.1. Inside the clean box, use the "clean hands/dirty hands" procedure to process the dilutenitric acid solution through the apparatus. Dispose of the spent dilute acid in accordancewith the project plan.2. Process 1 L of reagent water through the apparatus to rinse the equipment and discard thespent water.3. Collect a field blank as described in Section 3.2.7.7.4. Rinse the apparatus with copious amounts of the ambient water sample and proceed withsample collection.3.2.7.7 Quality Assurance/Quality ControlThe sampling team shall employ a strict quality assurance/ quality control (QA/QC) program. Theteam must collect equipment blanks, duplicates, and field blanks as described below.The sampling team is permitted to modify the sampling techniques described in this method toimprove per<strong>for</strong>mance or reduce sampling costs, provided that reliable analyses of samples areobtained and that samples and blanks are not contaminated. Each time a modification is made tothe procedures, the sampling team is required to demonstrate that the modification does not resultin contamination of field and equipment blanks.3.2.7.7.1 Field BlankTo demonstrate that sample contamination has not occurred during field sampling and sampleprocessing, at least one field blank or duplicate must be generated <strong>for</strong> every 10 samples that arecollected, but no less than one per day.3.2.7.7.2 Field DuplicateTo assess the precision of the field sampling and analytical processes, at least one field split samplemust be collected <strong>for</strong> every 10 samples that are collected during a given event. At least one fieldduplicate or blank must be collected per day.Field blanks are typically done in the beginning and end of a sampling run to identifyproblems with techniques and field duplicates in the middle of a sampling run toidentify problems with the laboratory.REVISED SEPTEMBER 2012 54
STANDARD OPERATING PROCEDURES FOR SURFACE WATER QUALITY SAMPLINGThe field split is collected by splitting a larger volume (a single container which is filled followingclean hands/dirty hands procedures) into two aliquots in the clean box or bag. Using a churnsplitter inside a clean bag is normally not practical and will be avoided.3.3 STREAM COLLECTION TECHNIQUES3.3.1 COLLECTING A REPRESENTATIVE STREAM SAMPLEADEQ employs four techniques <strong>for</strong> collecting water samples from rivers and streams: grab, equalwidth increment, modified equal width increment and equal discharge increment. TABLE 3.4describes when each method should be used. The equal width increment, modified equal widthincrement and equal discharge increment are composite sampling techniques.MethodWhen to UseGrab SampleDepth < 1 foot, velocity < 1.5 ft/s, homogeneous water in streamEqual Width Increment (EWI) Depth ≥ 1 foot, velocity ≥ 1.5 ft/s, heterogeneous water in streamModified EWIDepth < 1 foot, velocity < 1.5 ft/s, heterogeneous water in streamEqual Discharge Increment Not commonly used. Same requirements as EWI, but provides aslightly more representative sample <strong>for</strong> SSC. Use if sand presentin 250 micron sieve.TABLE 3.4. Stream collection method matrix.All water samples must be collected upstream of any activity that has occurred within the samplereach during field work. This refers primarily to those sampling techniques that involve physicaldisturbance to the stream bed (e.g. instantaneous flow measurement, pebble counts,macroinvertebrate collection, walking across the channel points in the reach, etc.).<strong>Water</strong> samples should be collected after completion of field measurements. In those cases wherethe water sample cannot be practically taken at the end of the sample visit, it is important to notallow the temperature of the samples to rise significantly above the ambient temperature of thewater body being sampled. If an ice chest is not readily available, place the sample bottles in ashaded location in the stream.For composite samples, the sample <strong>for</strong> SSC analysis should be withdrawn from thechurn splitter first.A 250 micron sieve may be used to make a visual determination as to whether sand-sized particlesare suspended in the water column. Using a 1-liter sample collection bottle, the field personcollects a grab sample at the deepest, fastest point in the stream channel. The sampler should takecare not to sample any bed material. Slowly empty the water in the sample collection bottle intothe sieve and visually inspect the sieve <strong>for</strong> sand-sized particles. If sand sized particles are not in thesieve, then the observer may collect a grab sample or use the Equal-Width-Increment (EWI)method to obtain a composite sample using a churn splitter. If sand-sized particles are in the sieve,then the sampler may collect a grab sample or use the equal-discharge-increment (EDI) method toobtain multiple sample bottles <strong>for</strong> SSC analysis. SSC protocol should be collected in wadeable,REVISED SEPTEMBER 2012 55
STANDARD OPERATING PROCEDURES FOR SURFACE WATER QUALITY SAMPLINGperennial streams during normal flows. The SSC field protocol has been adapted from FieldMethods <strong>for</strong> Measurement of Fluvial Sediment (Edwards and Glysson, 1999). The equipment andfield methods described in this protocol are designed to yield a representative sample of awater/sediment mixture moving in a stream. Tests per<strong>for</strong>med by the U.S. Geological Surveydemonstrate that a composite sample from a churn splitter can provide unbiased and acceptablyprecise (generally within 10% of the known value) SSC values as large as 1,000 mg/L when themean diameter of sediment particles is less than about 0.25 mm. At SSC values of 10,000 mg/Lor more, the bias and precision of SSC values in churn splitter sub-samples are consideredunacceptable (Gray, et al., 2000).3.3.1.1 Grab Sample Method1. Determine a representative spot to sample that is well mixed and meets the guidelines inTABLE 3.4. Rinse the bottle with stream water three times to flush out any contaminantsthat might be present. Dispose of rinsate downstream of your collection point. Collect thesample by inverting the bottle open end down, and lower to half the water column depthtaking care not to disturb any sediments on the stream bottom. Turn the bottle so that itis parallel to the stream bed, allowing the air to escape and the bottle to fill.Label the bottle when it is dry be<strong>for</strong>e immersing it into the water.2. Fill the individual sample bottles leaving space <strong>for</strong> the introduction of the acid preservative.Secure sample bottle caps tightly.3. Filter the dissolved metal sample (see Section 3.2.3).4. Add preservatives (see Section 3.2.4).5. Place the samples in an ice-chest in an upright position.3.3.1.2 Equal Width Increment Sample MethodEqual-Width Increment (EWI) sample collection and Equal-Discharge Increment (EDI) samplecollection methods were developed and refined by the United States Geologic Survey (USGS).Both techniques utilize an isokinetic depthintegratingsampler (DH-81) that is designed toaccumulate a representative water sample bothcontinuously and isokinetically, meaning thatthe water approaching and entering the samplerintake does not change in velocity. EWI andEDI sampling techniques are commonly used inlarger flowing systems which cannot beadequately characterized with a grab sample.The purpose <strong>for</strong> collecting a EWI sample is toobtain a series of sub-samples, each representinga volume of water taken at equal vertical transitrates and at equal widths apart from each other FIGURE 3.14. 14 liter churn splitter.at various intervals across the channel. ThisREVISED SEPTEMBER 2012 56
STANDARD OPERATING PROCEDURES FOR SURFACE WATER QUALITY SAMPLINGensures obtaining a discharge weighted representative water sample from the entire flow passingthrough the channel.Instantaneous discharge of the water body is determined with the Marsh McBirney flow meter andtop-setting wading rod (see Chapter 5 <strong>for</strong> an explanation on how to take instantaneous discharge).Samples are collected using a Isokinetic Depth-Integrating Sampler(US DH-81 hand-held sampler, FIGURE 3.15) which consists offour distinct parts: a three foot long metal rod with a plastic-vinylhandle on one end and machined threading on the opposite end; aUS DH-81A molded Teflon adaptor which attaches to the threadedend of the wading rod; a US D-77 molded Teflon cap which has aninternally molded air-vent tube; a machined Teflon US D-77 Nozzlewith a 5/16 inch sample intake opening; and a 1-liter collectingbottle. ADEQ primarily uses the 1/4 inch nozzle, which is <strong>for</strong> flowvelocities between 1.5 and 7.6 ft/sec.EWI <strong>Sampling</strong> Procedure1. Upon arrival at the sample site, remove the churn splitterfrom its protective plastic bag and rinse it well two to threetimes with water from the stream. Fill to about 1/2 to 3/4full and place the capped container in a shaded location inthe stream. This will allow the churn splitter and ambientstream water to equilibrate prior to sampling. When readyto collect the sample, remove the cover and empty the churnsplitter. Place the cover in the plastic bag to preventcontamination of the water sample when replacing the coverafter the sample has been collected (or just keep the coveron).2. Extend a measuring tape transect across the stream channel,perpendicular to the flow at a sampling location notinfluenced by side-channel eddies.3. Measure the instantaneous flow discharge. This preliminarymeasurement is required in order to per<strong>for</strong>m the EWI.Take note of the location of the fastest flow once thedischarge measurement has been completed.4. The EWI requires multiple sampling points across thetransect. The number of sampling points (vertical intervals) FIGURE 3.15. DH-81 Sampler.to be sampled is based on the following variables:o Volume of sample needed <strong>for</strong> analysis (number of sample bottles to be filled)o Size of the churn splittero The depth and velocity distribution in the cross section at time of sampling.REVISED SEPTEMBER 2012 57
STANDARD OPERATING PROCEDURES FOR SURFACE WATER QUALITY SAMPLINGIt may take several tries to get the right sample volume <strong>for</strong> a particular stream. Adjustthe number of verticals to get the appropriate volume of sample <strong>for</strong> the churn splitter.http://fisp.wes.army.mil/Instructions%20US_DH-81_010612.pdf has additionalin<strong>for</strong>mation regarding the DH-81 sampler.FIGURE 3.16. Depth-integrated samples collected using the equal width increment method.5. The sampler should pick a reference point on the body (such as a belt buckle) to use as astarting reference point when initiating a vertical transect. All vertical transits across thechannel should begin at the same reference point regardless of water depth.6. Establish the vertical transit rate by determining the location of maximum velocity in thechannel obtained from the discharge measurement. In most cases this will be the deepest,fastest point identified along the transect line. The sampler is positioned at the fastestpoint in the stream. The sampler positions the DH-81 bottle at the predeterminedreference point (e.g., belt buckle) and begins lowering the DH-81 with a constant motionto the streambed and then back again to the reference point. During this period thesampler should be counting time from beginning to end of transit. If the first transitattempt did not fill the bottle, empty the bottle, repeat the process and adjust the transitrate until the DH-81 bottle is filled to just below the neck of the bottle. The sampler mustrepeat the transit if the DH-81 collection bottle is overfilled or underfilled. Once thecorrect transit rate has been determined, discard the collected water. Do not use this wateras part of the final water sample.7. Using the transit rate established in Step 6, move to either bank and prepare to collect thesub-samples at the established intervals and transit rate. The number of intervals iscalculated based on the volume of water to be collected and the size of the churn splitterbeing used. For example, if four liters of water are needed and a six liter churn splitter isREVISED SEPTEMBER 2012 58
STANDARD OPERATING PROCEDURES FOR SURFACE WATER QUALITY SAMPLINGused, a minimum of five liters of sample water is needed. Once the sample water has beenwithdrawn from the churn splitter to fill the sample bottles, a minimum of one liter mustremain in the churn splitter. To calculate the number of intervals, it is known that a fullliter will be collected at the fastest flow location and decreasing amounts will be collectedon either side of that location. FIGURE 3.16 illustrates this process. There is no <strong>for</strong>mulato determine the number of required transit intervals; an estimate must be made takinginto account the width of the channel, the depth of water, and the flow rate through thechannel cross-section.8. Once the number of sub-samples has been estimated, the interval width is calculated. Forexample, if the stream width is 20-feet, and the number of sub-samples is estimated to be10, then the width of each sample interval would be 2 feet. The actual sampling stationwithin each interval is located at the center of the interval. Beginning at a location of 1foot from the bank, the intervals are then spaced 2 feet apart, resulting in sample stationsat 1, 3, 5, 7, 9, 11, 13, 15, 17 and 19 feet along the 20-foot width.9. Collect the sample in the first interval with the DH-81 at the predetermined transit rate(Step 6). It is important to remember to begin and end at an established reference point(belt buckle) and maintain a constant rate. A second observer should accompany thesampler carrying the churn splitter to receive the samples.It is often possible to composite samples at two or more verticals near the bankswithout having to empty the sample collection bottle into the churn splitter to savetime. However, if the collection bottle is over filled during the sample collectionprocess, the bottle must be emptied of its contents and all verticals, which contributedto that particular sub-sample must be recollected.10. After all the sub-samples have been deposited into the churn splitter, the individual prelabeledsample bottles can be filled.Bacteria samples should not be collected from the churn splitter. Plastic churnsplitters cannot be autoclaved and thus may already be contaminated be<strong>for</strong>e thecomposite sample is taken.Churn the sample at a uni<strong>for</strong>m rate of about 9 inches per second. The mixing disc shouldtouch the bottom of the churn on the down stroke but should not be allowed to break thewater surface on the up stroke. A minimum of 10 strokes is required be<strong>for</strong>e withdrawingthe first subsample. Be<strong>for</strong>e withdrawing the sample water, run a small quantity of waterthrough the spigot as rinse to remove any contaminants that may have adhered to theinside of the spigot body. If the disk breaks the water surface while a subsample bottle isbeing filled, momentarily stop the filling process and stroke 10 times be<strong>for</strong>e continuing tofill the subsample bottle.3.3.1.3 Modified Equal Width Increment Sample CollectionThe Modified EWI method is often used in small wide streams where depths are less than onefoot, and horizontal mixing is insufficient <strong>for</strong> capturing a representative sample. It is also used inREVISED SEPTEMBER 2012 59
STANDARD OPERATING PROCEDURES FOR SURFACE WATER QUALITY SAMPLINGshallow streams where tributary inflows are not well mixed with the dominant mainstream flow.The procedure is designed to produce a sample that is more representative than a grab sample, butnot discharge weighted as with the EDI collection method. The sub-samples are collected by handwith the wide-mouth 1-liter collecting bottle at the determined vertical intervals.Modified EWI <strong>Sampling</strong> Procedure1. The procedure <strong>for</strong> the modified EWI is the same as the EWI in Section 3.3.1.2 with theexception that the no rod is used. The sampler uses their hand instead of the rod.For streams of shallow depth where the use of a 1-liter bottle and a churn splitter may beimpractical, use a clean 250 milliliter bottle to collect the sample. Establish four samplingpoints along the transect that are approximately equal in distance from each other. Collecta sub-sample from each point, using a transit rate that fills the bottle completely and evenlyat each point along the transect. Cap and invert the bottle several times to mix the sample.3.3.1.4 Equal Discharge Increment Sample CollectionEqual discharge increment sampling is used when sieving indicates that sand-sized particles areentrained in the water column and the stream is 10-feet wide or wider. If sand-sized particles areentrained in the water column and the stream is less than 10-feet wide, a grab sample may be takenfrom a single vertical in the deepest, fastest location in the channel.The Equal Discharge Increment (EDI) method produces a discharge-weighted sample thatrepresents all the flow passing through the cross section by collecting a number of sub-samples,each representing equal volumes of discharge. The flow in the cross section is divided intoincrements of equal discharge and then equal-volume. Depth-integrated samples are collected atthe centroid of each increment along the transect. The term centroid refers to the location in thechannel transect where discharge is equal on both sides. EDI sample collection is used by ADEQprincipally <strong>for</strong> the collection of suspended sediment concentration samples.Equal Discharge Increment ProcedureThe objective of the EDI is to collect a discharge-weighted sample that represents the entire flowpassing through the cross-section by obtaining a series of samples, each representing equal volumesof stream discharge.1. Place measuring tape across stream channel perpendicular to flow at the sampling site.Determine the stream width from the edges of water.2. Take discharge measurements using Marsh McBirney flow meter to determine the totaldischarge and the flow distribution across the channel at the cross section. Whenrecording discharge measurements on the field <strong>for</strong>m, the recorder should include acumulative discharge column and keep a running total of the cumulative discharge fromthe LEW.Use the "EDI Flow Template" excel spreadsheet on a laptop or pocket PC (FIGURE3.17) to determine the cumulative Q, centroid locations and sample station locations.REVISED SEPTEMBER 2012 60
STANDARD OPERATING PROCEDURES FOR SURFACE WATER QUALITY SAMPLINGFIGURE 3.17. Flow EDI Template.3. Calculate the EDI. The EDI is determined by dividing the total cumulative discharge bythe number of verticals to be sampled. For example, if the total cumulative discharge ofthe stream is 84 cfs and 5 verticals are to be sampled, then the EDI method is 16.8 cfs.The number of verticals is determined by the sample volume that is needed. If 4 liters ofsample are needed then 5 verticals should be used. This will leave 1 liter in the churn.4. The location of the centroids of the equal discharge increment is determined from thecumulative discharge calculations. The first vertical is located at a point where thecumulative discharge from the LEW is half of the EDI. In the previous example, if theEDI is 16.8 cfs, then the first vertical is located at the point where the cumulative discharge= 8.4 cfs. Subsequent centroids are located by adding the EDI to the cumulative dischargeat the first vertical. In our example the second vertical would be located at the pointwhere cumulative discharge = 8.4 + 16.8 = 25.2 cfs relative to the LEW. Use the sameapproach to determine the centroid discharge amounts <strong>for</strong> the 3rd to 5th centroids. Thespreadsheet will calculate these automatically. Adjust the spreadsheet if the number ofverticals need to be adjusted.5. Use the Cumulative Discharge Curve (FIGURE 3.17 and FIGURE 3.18) to determine thelocations of the five sampling stations.REVISED SEPTEMBER 2012 61
STANDARD OPERATING PROCEDURES FOR SURFACE WATER QUALITY SAMPLINGFIGURE 3.18. Close-up view of the Cumulative Discharge Curve from the "Flow EDI Template". Dotted linesrepresent the 5 cumulative Q centroid locations and the corresponding sample points across the transect.6. A depth-integrated sample is collected at each sampling station using a DH-81 sampler.The transit rate used to collect a sample must be constant in one direction. However, it isnot necessary to maintain equal transit rates of ascent and descent within a vertical. Alsotransit rates can vary at different verticals in the cross-section. A single sample bottle isfilled at each vertical (FIGURE 3.19).It is important that all sample bottles be of equal sample volume.REVISED SEPTEMBER 2012 62
STANDARD OPERATING PROCEDURES FOR SURFACE WATER QUALITY SAMPLINGLEW8.4 ft 11.5 ft 14.6 ft18.3 ft23.5 ft36.8 ftFIGURE 3.19. Cross-section showing the 5 sample locations.3.4 LAKE SAMPLING TECHNIQUESThe number of samples collected <strong>for</strong> a particular site will depend on whether or not the lake isstratified. To determine stratification, a multimeter probe will need to be extended to the bottomof the lake.1. Be<strong>for</strong>e using the probe you will need to calibrate it <strong>for</strong> the local barometric pressure and<strong>for</strong> depth (see Section 3.1.1 <strong>for</strong> additional detail). When you get to the lake, attach thecable, face and probe.2. Screw on the probe cover that allows water to pass through. Place the probe in the water ata depth of approximately 10 cm. Record field parameters on field data sheet (percent DO,pH, etc.).3. Slowly lower the probe to 1m <strong>for</strong> the second reading. Continue at 1 m intervals until youreach the bottom of the lake. Allow the probe reading to stabilize be<strong>for</strong>e recording. Takethe last reading at 0.5 m above the suspected bottom of the lake. If the site is extremelydeep, consider reading the probe at every 2-5 m. Just be sure to capture at least 3 equallydistancedreadings within the epilimnion and the hypolimnion and to identify thethermocline (FIGURE 3.20).A lake is thermally stratified when there is a change of more than ONE degree Celsiusper meter. This depth is called the thermocline.REVISED SEPTEMBER 2012 63
STANDARD OPERATING PROCEDURES FOR SURFACE WATER QUALITY SAMPLING0 M1 MEpilimnion2 M3 MThermocline4 M5 MHypolimnionFIGURE 3.20. Red dots represent depths where multiprobe readings are taken.6 M7 M8 MRepeat any suspect measurements and make notes on the field sheet and in the instrument’slogbook if the DO membrane had to be replaced.The DO membrane will dry out if left exposed to air so, as soon as possible, cover itwith the cap including about 5mL of water. When sampling is complete, return theprobe to the case and be sure the cap is tight so that the water won’t leak out. If thereis dirt on the probe, be sure to clean it (gently wash with water) and do any necessarymaintenance be<strong>for</strong>e returning it to the storage area.3.4.1 COLLECTING A REPRESENTATIVE LAKES SAMPLEA representative sample is a collection of grab samples that represent the vertical and spatialcomponents within the main body of the lake. Samples are generally not taken in shallow,stagnant portions of the lake. Instead, lake sampling focuses on the mid-lake sample withingeomorphologically distinct subunits of the lake. Examples of subunits may include the <strong>for</strong>ebay,mid-lake and inlet. The morphology of each lake is unique and may require a different number ofsamples in order to characterize the condition of the lake. A sample is always taken near the damsite as a reference.A small (
STANDARD OPERATING PROCEDURES FOR SURFACE WATER QUALITY SAMPLINGA minimum of three sampling locations should be taken across a lake unless the lake issmall (
STANDARD OPERATING PROCEDURES FOR SURFACE WATER QUALITY SAMPLING1020 30102010FIGURE 3.21. Complex lake with 3 sites. Dashed lines represent lake depth. Dam is represented by a solid blackrectangle. The sites are represented by the "x's". The dam site is the red "x"3.4.2 WATER SAMPLE COLLECTION3.4.2.1 Secchi DepthOne sample is always collected in the photic zone of the lake. Asecchi disc is used to determine the depth of the photic zone. Thephotic zone is where visible light penetrates to allow primaryproduction.1. Attach the secchi disc to a marked rope or to a meter tape(FIGURE 3.22). Lower the disc off the shady side of theboat and remove sunglasses or other visual obstructions.Slowly lower the secchi disc into the water until itdisappears. Estimate the depth to the nearest 0.1 m.Record the depth at which it disappears. Lower the disc alittle more and then slowly bring it back until it reappears.Record this depth as well. The average of these two valuesis the secchi depth. Record the secchi depth.2. Multiply the secchi depth by a correction factor of 1.5.This identifies the depth of the photic zone.FIGURE 3.22. Secchi disc andmarked chain.REVISED SEPTEMBER 2012 66
STANDARD OPERATING PROCEDURES FOR SURFACE WATER QUALITY SAMPLING3.4.2.2 Beta BottlePrior to collecting a beta bottle sample you should have identified if the lake is stratified or notaccording to Section 3.1.2.2.3.4.2.2.1 Beta Bottle Collection Point in an Unstratified LakeOnly one sampling depth is needed <strong>for</strong> unstratified lakes. Thesampling depth is 1/2 the depth of the photic zone (FIGURE 3.23).Sample Depth =½ Photic ZonePhotic ZoneSecchi Depth1.5 x SecchiDepthFIGURE 3.24. Beta bottle.FIGURE 3.23. <strong>Sampling</strong> location <strong>for</strong> an unstratified lake.The beta bottle should be rinsed in the lake water be<strong>for</strong>e sampling (FIGURE 3.24). Swish it backand <strong>for</strong>th slowly with the side lids open.The beta bottle rope is marked in 1 meter units. Lower the beta bottle to the desired depth.Swish the bottle horizontally back and <strong>for</strong>th and let it sit <strong>for</strong> approximately 30 seconds. Thendeploy the messenger to collapse the lids. Slowly raise the beta bottle out of the water and use thepour spout to empty its contents into sample bottles. Gently swirl the beta bottle between fillingup sample bottles. When pressure is low, it may help to loosen the yellow valve or to placesomething between the lid and the bottle to keep the lid open.The beta bottle should not be cleaned with detergents or bleach. Use tapwater and a clean brush to wash the inside and outside of the beta bottle.Keep the lids open while it dries. When dry, collapse the lids as soon aspossible so that the cords do not become loose. Store the beta bottle in theplastic suitcase along with the rope and messenger.Use the spigot to fill up the sample bottles.3.4.2.2.2 Beta Bottle Collection Points in an Stratified LakeAt least two samples depths should be sampled <strong>for</strong> a stratified lake(FIGURE 3.25). One sample point will be collected in the epilimnionFIGURE 3.25. Stratified LakeSample PointsREVISED SEPTEMBER 2012 67
STANDARD OPERATING PROCEDURES FOR SURFACE WATER QUALITY SAMPLINGat the midpoint of the photic zone (see Section 3.4.2.2.1 <strong>for</strong> additional detail).The other sampling point is located within the hypolimnion 2 meters below the thermocline.3.4.2.3 Sediment Sample CollectionA sediment sample is collected <strong>for</strong> the purpose of determining recent deposition quantities ofnutrients and metals. There are two main types of sediment samplers that could be used: Eckmandredge and a Wildco corer.The Eckman dredge is best to use in shallow, loose soils.The Wildco corer should be used in rocky substrates orat deep sites.Eckman dredgeOpen arms on the Eckman dredge (FIGURE 3.26). Swish it in thewater to rinse, and then slowly lower it to the sediment. When youreach the sediment, let it sink in, then send the messenger down tocollapse the arms. Slowly raise the dredge out of the water. Openthe top to scoop out a sample. Release the unused sediment intothe lake.FIGURE 3.26. Ekman dredge.Wildco corers: pounder methodWildco corers are meant to collect a core of water by pounding a heavy metal rod into thesediment. With the pounder, you can insert a plastic tube into the metal tube, and then close itoff with a black sediment catcher and a white nose piece (FIGURE3.27).After assembling the corer, make room <strong>for</strong> the three ropes anddecide who will handle each rope. The ropes include the mainhandle <strong>for</strong> the corer, the rope <strong>for</strong> the lever than activates suction,and the rope to raise and drop the pounder. Slowly lower the coreruntil it touches the sediment. Then, raise the corer approximately 1m from the bottom and let it free fall. Pound repeatedly (about 3times), using the ropes to gage how well the pounding is working.When you think the corer is solidly in the soil, raise the lever ropeto create suction. Now with all three ropes being pulled, bring thecorer to the surface.Bring the corer to a horizontal position in the boat. Carefullyremove the nose piece and catcher and scoop out the sample.FIGURE 3.27. Wildco sedimentcorer.When you have collected the desired sample volume, return the corer to the lake water <strong>for</strong> rinsing.Do not expect to remove all the mud. A thorough cleaning should be done in the lab using soapywater.REVISED SEPTEMBER 2012 68
STANDARD OPERATING PROCEDURES FOR SURFACE WATER QUALITY SAMPLINGWildco corers: Modified KB corerThe Modified KB corer relies on a plunger to provide suction. The sample is collected within adetachable hard plastic tube. This corer is heavier and longer than the pounder and may losesuction more easily. However, because of the weight, it may be easier to identify when you havestuck the corer in the mud. You can avoid losing suction by reaching as far into the water aspossible to plug the bottom end.Insert the core tube into the housing sampling apparatus and tighten the hose clamps with a nutdriver. Set up the plunger so that it will drop when the messenger is deployed. Use grease ifnecessary to ensure a tight seal between the plunger and the metal surface.Lower the corer keeping the line taut until you reach bottom. Then pull up the corer toapproximately 2 m above the bottom. Let the line slip through the hands until it hits bottom.Then, keep the line taut so that the corer doesn’t tilt. Unless you are in rocky substrate, the <strong>for</strong>ceof the corer should have been enough to stick into the sediment. Trip the messenger to create thesuction.Very slowly raise the corer until the top part reaches the surface of the lake. At this point it is veryeasy to lose suction and lose the sample. With one person holding onto and stabilizing the corerand the other holding onto the rubber plug and ready to place it on the end of the tube, slowlyraise the corer out of the water until the tube is plugged. Then raise the corer completely out ofthe water and set it vertically on the boat (in a tub or bucket reduces the mess). Loosen the clampsusing a nut driver and separate the metal piece from the plastic piece.Collect a sample from the top of the plastic tube which reflects the most recent deposition in thelake. Using the PVC extruder, push the sediment up toward the top of the tube. Place the stageover the opening and secure it with the built in screw. When the water has been extruded so thatthe soil is almost to the stage, remove excess water with a siphon.Now place a plastic column with 1cm marked on top of the stage. Continue pushing the sedimentup till it reaches the 1 cm level. Push the column towards the flat part of the stage. This cleavesoff the top 1 cm of soil. Use a plastic spatula to push the soil into the collection jar. Repeat thecleaving process <strong>for</strong> additional soil volume.Release any unused soil back into the lake and rinse the corer and associated parts in the lake.The sediment sampler should be washed with soap and water between lake surveys or after asampling run.3.4.2.4 Zooplankton <strong>Sampling</strong>1. Lower 80 m net in an upright position until the mouth of the net is 0.5 meters above thelake bottom (FIGURE 3.28).2. Pull the net to surface at a steady rate without stopping (1 ft /sec).REVISED SEPTEMBER 2012 69
STANDARD OPERATING PROCEDURES FOR SURFACE WATER QUALITY SAMPLING3. At surface, move net up and down without submersing the mouth to rinse contents intocollection bucket.4. Rinse again by spraying water against the outside of net.5. Remove bucket from net and concentrate contents by swirling bucket to remove excess lakewater.6. Repeat steps 1-5 on opposite side of boat using 243 m net.Vertical Tow(Fine Mesh)Vertical Tow(Coarse Mesh)NarcotizationPreservationFIGURE 3.28. Coarse and Fine Zooplankton Tow s. Each are lowered 0.5 meters above the lake bottom and thenraised to the surface. Samples are then narcotized and preserved.Set collection bucket in a small container and narcotize zooplankton using water containing a CO 2tablet (alternatively, Alka-Seltzer or club soda may be used). Wait until zooplankton movementhas stopped (usually about 1 minute). Rinse contents of bucket into 125 ml jar using smallvolumes of DI water. Preserve sample with ethanol by filling sample jar to the 80 mL mark or alittle more than half full.REVISED SEPTEMBER 2012 70
STANDARD OPERATING PROCEDURES FOR SURFACE WATER QUALITY SAMPLINGCHAPTER 4BACTERIA COLLECTION4.1 MEMBRANE FILTER TECHNIQUEThis section describes the procedure <strong>for</strong> examining water samples <strong>for</strong> sanitary quality. Themethods are intended to indicate the degree of microbiological contamination. E. coli is theindicator organism <strong>for</strong> the community of pathogens commonly found in water contaminated byintestinal microorganisms.FIGURE 4.1. Required processing equipment <strong>for</strong> membrane filtration of bacteria. See Appendix A <strong>for</strong> a list ofspecific bacteria items needed <strong>for</strong> the membrane filtration technique.REVISED SEPTEMBER 2012 71
STANDARD OPERATING PROCEDURES FOR SURFACE WATER QUALITY SAMPLING4.1.1 MEMBRANE FILTER SAMPLE COLLECTION PROCEDURETwo six-ounce sterilized NASCO WHIRL-PAK© bags (or other similar product) are used to collectbacteria samples from the source water. Each bag contains a dechlorinating (sodium thiosulfate)tablet to neutralize chlorinated water. Two duplicate samples are taken at each site.Depending on the severity of pollution of the sample waters, it may be necessary towear gloves and eye protection while collecting the sample.1. Label the WHIRL-PAK bags with the site identification using an indelible pen.2. Tear off the tab at the top of the bag at the per<strong>for</strong>ation line. Do nottouch the inside of the bag.3. Grasp the two small paper tabs on each side of the center of the bag.4. With the bag still closed, submerge the bag to a depth which isapproximately half the water column. With the open end of the bagfacing upstream, move the bag in an upstream motion whilesimultaneously opening it with the paper tabs. This should be donein one continuous motion.5. If the collected water is above the “fill line,” dispense the overflowback into the stream.FIGURE 4.2.Whirlpak bag.6. Using both hands, grasp the wire tabs on the sides of the bag and whirl the bag so that itwinds around the wire tabs 1 to 3 times (face away from the sample while whirling the bagto avoid contaminating the face with stream water). Twist the wire tabs around each otherwith the tab ends pointed away from the bag to prevent bag puncture and leakage while instorage and transport.7. Place the two samples in a wide mouth collection bottle to ensure their safety duringtransport. The collection bottle should be kept on ice until filtration is per<strong>for</strong>med. Theideal temperature <strong>for</strong> preservation is 4 C. Exposure of bacteria to direct sunlight shouldbe minimized. If samples are to be processed within one hour of collection, chilling themis unnecessary, however, it is still important to keep them out of direct light.Bacteria samples should be processed within a six hour holding time. If the holdingtime is violated, note this on the Field Data Sheet and flag it in the water qualitydatabase.4.1.2 EQUIPMENT SETUPThere are four parts to the filter apparatus; filter base, filter, middle adapter, and funnel (FIGURE4.3. The filter base collects the filtered water. The middle adapter fits onto the base opening andreceives the screw-on funnel. The filter is placed onto the porous openings of the middle adaptor.The funnel is the receptacle <strong>for</strong> the sample water and sterile buffer water. Place a sterilizedMillipore filter top and middle adapter on the filter base. The adapter and the funnel come as oneunit in a sterilized package from the laboratory. Do not touch the top surface of the middleadapter, or the inside of the funnel top. There are two spouts on the side of the base, 180 degreesapart; one is covered with a soft plastic cap and the second is uncapped. Connect the siliconeREVISED SEPTEMBER 2012 72
STANDARD OPERATING PROCEDURES FOR SURFACE WATER QUALITY SAMPLINGtubing to the pump and the uncapped spout. The appropriate length of tubing is three to fourfeet.FunnelFilterMiddle AdaptorFilter BaseFIGURE 4.3. Membrane filter apparatus parts.4.1.3 FILTRATION AND PLATING PROCEDUREAlways wear powder-free Latex or Nitrile gloves while filtering and processing the samples.1. Label the bottom of three plates of the snap lid container with an indelible pen indicatingthe site ID and the volume (usually 10, 25, and 50 mL) of filtered sample water. Also labelone plate with the Site ID and "Be<strong>for</strong>e" and another plate site Site ID and "After". Thebe<strong>for</strong>e is an equipment blank. The after is a technique blank.2. The three volumes of sample water to be filtered should have been pre-determined.Typically, the volumes are 10, 25, and 50 mL. The target volume is one that will yield 20to 60 colonies per membrane filter. At sites with a sampling history, refer to historic FieldData Sheets at that site <strong>for</strong> filter volumes that have yielded ideal colony counts.3 Dip stainless steel <strong>for</strong>ceps in alcohol and pass them through a flame. Let <strong>for</strong>ceps cool <strong>for</strong>10 seconds.Be careful not to place hot <strong>for</strong>ceps into the beaker of alcohol. Hot <strong>for</strong>ceps plus alcoholequals fire. If you do start a fire, stay calm and try to smother it with something thatisn't flammable such as a ceramic plate or glass.4. Pour 10 to 20 milliliters of buffer solution into the graduated funnel.5. Unscrew the funnel from the middle adapter and hold it in one hand above the worksurface. With the free hand, place the membrane, grid side up, on the exposed middleadapter. Screw the filter top back in place.6. For the "be<strong>for</strong>e" dilution, pour 10 to 20 milliliters of buffer solution into the graduatedfunnel. Use the pump to suck the buffer water through the filter.7. Using sterilized <strong>for</strong>ceps, remove the membrane filter and carefully apply it to the "be<strong>for</strong>e"mTec plate. Be sure that the plate is a "modified mTec" plate.8. Repeat step 5 after sterilizing the <strong>for</strong>ceps.REVISED SEPTEMBER 2012 73
STANDARD OPERATING PROCEDURES FOR SURFACE WATER QUALITY SAMPLING9. For the "10 mL" dilution pour 10 to 20 mL of buffer solution into the graduated funnel.Use the pump to suck the water through the filter.10. Vigorously shake the sample to be filtered 20 times in a large arcing motion with the elbowas the pivot point.It is easy to <strong>for</strong>get to shake the sample. Shaking the sample ensures that the bacteria inthe sample are evenly distributed through the whirlpack bag.11. Starting with the smallest predetermined volume (e.g. 10 ml) aspirate the sample water intoa 10 milliliter serological pipette and dispense to the filter funnel. For volumes greaterthan 10 milliliters, use the 50 milliliter syringe.Dilutions should be done <strong>for</strong> waters with known severe bacterial contamination orwhere a 10 milliliter sample will likely generate a count that is to-numerous-to-count(such as a turbid sample). For a 1:100 dilution add 1 mL of sample water to 99 mL ofbuffer water in a sterile container. Continue thru the procedural steps but use 1, 2.5and 5 mL of the diluted sample water. This is just an example; different dilutions canbe used to fit specific needs.12. Use the hand pump to filter under partial vacuum.13. Rinse funnel walls 1 to 3 times, with 20 to 30 milliliters of buffer water. Filter each rinseseparately under partial vacuum until the filter membrane appears dry. Remove the capfrom the capped spout on the filter base to relieve air pressure on the filter. This willprevent the filter from tearing when the funnel top is unscrewed.14. Unscrew filter top and hold in one hand above the work surface. Grasp the edge of thefilter membrane with the sterilized <strong>for</strong>ceps and place the filter in the "10 mL" dilutionmTec plate.15. Replace the filter top on the middle adapter.16. Replace the top of the snap lid plate and record the time of incubation on the bottom ofthe plate and on the field notes. The snap lid plate must be placed in the incubator within30 minutes after filtering.17. Incubate E. coli plates lid down <strong>for</strong> 2 hours at 35.0 ± 0.5 C, then transfer the plates to thewarmer incubator (44.5 ± 0.2 C) <strong>for</strong> 23 ± 2 hours.18. Repeat steps 9 through 17 the filtering process <strong>for</strong> the remaining predetermined dilutionvolumes. Record all in<strong>for</strong>mation on the field <strong>for</strong>m (FIGURE 4.4).REVISED SEPTEMBER 2012 74
STANDARD OPERATING PROCEDURES FOR SURFACE WATER QUALITY SAMPLINGFIGURE 4.4. Field <strong>for</strong>m <strong>for</strong> the membrane filtration procedure.Place used funnel, middle adaptor, syringes, and empty buffered dilution water bottles into a bag<strong>for</strong> sterilization.4.1.4 COUNTING BACTERIA COLONIESBacteria colonies <strong>for</strong> modified mTEC plates can be counted after the incubationperiod is over. Regular mTEC plates require an additional procedure involving anutropad and urea broth (See USGS field manual Chapter 7). Be sure that you areusing the modified mTEC plates.Count colonies in each Petri dish using the grid squares on the membrane filter. Recount allcolonies on a given membrane until replicate counts agree within 5% and record the results on theField Data Sheets.4.1.4.1 Computing Bacterial DensitiesResults of bacterial analyses of water samples are reported in colonies <strong>for</strong>ming units/100 milliliterssample. This is referred to as the "bacterial density". For bacterial analyses the ideal range is 20and 60 "target colonies" per filter membrane.The following seven conditions describe how to calculate the number of colony <strong>for</strong>ming unitsbased on the number of colonies found on each plate. Record all results on the Field Data Sheets.Condition #1: Colonies on one filter membrane within the ideal rangeREVISED SEPTEMBER 2012 75
STANDARD OPERATING PROCEDURES FOR SURFACE WATER QUALITY SAMPLINGIf one of the three filter membranes contains a count within the ideal range (20 to 60), density iscomputed as:Colony Count x 100Volume, mLIf the following results were obtained,mL FilteredNumber colonies10 22 (within the ideal range of 20 to 60)25 150 022mL100then, 220 E. coli colony <strong>for</strong>ming units/100mL.10mLCondition #2: Colonies on two filter membranes within the ideal rangeIf two or more filter membranes reveal counts in the ideal range, the density is calculated as:If the following results were obtained,mL FilteredNumber colonies10 23 (within the ideal range of 20 to 60)25 28 (within the ideal range of 20 to 60)50 2then,(23 28) 10010 25510035 148 E. coli colony <strong>for</strong>ming units/100mLCondition #3: Colonies present on more than one filter membrane and all counts are out ofthe ideal rangeIf all filter membranes have colony counts outside the ideal range (20 to 60), but within the 1 to200 range, calculate as:If the following results were obtained,mL FilteredNumber colonies10 86REVISED SEPTEMBER 2012 76
STANDARD OPERATING PROCEDURES FOR SURFACE WATER QUALITY SAMPLINGmL FilteredNumber colonies25 350 3then,(86 3 3) 100920010 25 50 85108 E. coli colonies/100mLWhen entering the data into the <strong>Water</strong> Quality Database, us the data qualifier B(Colony counts outside acceptable range {20 – 60 CFU}).Condition #4: Colonies on one or more filter membranes have a count less than the ideal rangeFilters having a zero count are not included in the calculation. Compute the density as inExample #3.If the following results were obtained,mL FilteredNumber colonies10 025 250 11then,(2 11)10025 501300 17 E. coli colony <strong>for</strong>ming units/100mL75Do not count the plate with "0" colonies on it or include the filtered volume in thedenominator of the equation. When entering the data into the <strong>Water</strong> QualityDatabase, us the data qualifier B (Colony counts outside acceptable range {20 – 60CFU}).Condition #5: All filter membranes contain more than 200 coloniesWhen entering the data into the <strong>Water</strong> Quality Database, us the data qualifier A1(TNTC; too numerous to count). Consider collecting a follow-up sample and decreasethe dilution.REVISED SEPTEMBER 2012 77
STANDARD OPERATING PROCEDURES FOR SURFACE WATER QUALITY SAMPLINGCounting large numbers of colonies must be done systematically. Begin in the upperleft hand column and work down. Only count the colonies that have more than 50 %of their area within the column that you are counting. Keep working across eachcolumn until all colonies are counted. Count the colonies that are merged together(the Mickey Mouse shaped colonies) as one colony. Count the colonies again. Therecount should be within 5% of the original count.Condition #6: There are no colonies on any filter membranesReporting results are determined by the largest volume dilution used <strong>for</strong> the analysis. If thevolumes used <strong>for</strong> the analysis were 10 mL, 25 mL, and 50 mL and no colonies were observed, thecalculation is completed as follows:A count of one is assigned to the 50 mL dilution and the calculation is1100 2 E. coli colonies/100mL.50If the dilution volumes are 1 mL, 5 mL, and 10 mL then the reporting limit is1100 10 E. coli colonies/100mL.10When entering the results in the <strong>Water</strong> Quality Database, the data qualifier ND(Nondetect) is used and 2 cfu is entered <strong>for</strong> the reporting limit (<strong>for</strong> a 10/25/50 mLdilution).4.2 COLILERT ® SYSTEMThe Colilert system utilizes prepackaged reagents which include additives to support the growth ofcoli<strong>for</strong>m bacteria in addition to specific compounds that react with coli<strong>for</strong>ms in general and E. colispecifically. Colilert-18 is used <strong>for</strong> the simultaneous detection and confirmation of total coli<strong>for</strong>msand E. coli in fresh waters. When total coli<strong>for</strong>ms metabolize Colilert-18’s nutrient indicatorreagent, ONPG (O-Nitrophenyl--d-galacotpyranoside), the reaction produces an easily recognizedyellow color. When E. coli metabolizes Colilert-18 nutrient-indicator, MUG (4-Methumbelliferyl-d-glucoronide)the sample fluoresces. Colilert-18 can simultaneously detect these bacteria at 1cfu/100 ml within 18 to 22 hours. The test is effective and free of interference in waters withREVISED SEPTEMBER 2012 78
STANDARD OPERATING PROCEDURES FOR SURFACE WATER QUALITY SAMPLINGpopulation densities of other heterotrophic bacteria up to 10,000 cfu/100 ml. Non-coli<strong>for</strong>mbacteria that also have these enzymes are suppressed, <strong>for</strong> the incubation period, by other reagentsin the media.EPA refers to Colilert ® as MMO-MUG while <strong>Standard</strong> Methods <strong>for</strong> the Examinationof <strong>Water</strong> and Wastewater refers to Colilert ® as a chromogenic substrate.Catalog #WP020-18 and WP200-18 contain 20 and 200 Snap Packs respectively, eachcontaining sufficient Colilert-18 reagent <strong>for</strong> a 100 ml water sample. The reagentsshould be stored at 4-25C away from light.Samples are collected wearing gloves and using a sealed, sterile 100ml bottle submerged in thestream while facing upstream. The bottle should be opened and recapped under water duringsampling so that surface contaminants are not sampled. Samples must be chilled and processedwithin six hours of sample collection.4.2.1 QUANTI-TRAY/2000 ENUMERATION PROCEDUREThe TMDL Unit currently has the ability to process bacteria samples in the laboratory or in thefield. The procedures outlined below are applicable to both settings. Gloves must be worn duringall bacteria sampling, handling, and processing.1. Turn on sealer. It will take approximately 15 minutes to warm to operating temperature.2. Verify that the incubator is operating at 35 +/- 0.5C.FIGURE 4.5. Colilert Sealer (left) and incubator (right).3. Check level of water in bottle against 100ml line, if too much water is present, decant tothe 100ml line.4. Pour the contents of one reagent packet into each sample bottle. When opening thereagent packets, avoid inhaling the media.5. Cap vessel and shake gently until dissolved and allow the foam at the top the bottle tosettle. Chilled samples will take longer to dissolve the reagent. A hot water bath can beused to warm chilled samples prior to adding reagent.REVISED SEPTEMBER 2012 79
STANDARD OPERATING PROCEDURES FOR SURFACE WATER QUALITY SAMPLING6. Use a permanent marker to label the foil side of the Quanti-Tray with the sampleidentification, date and time of collection.7. Use one hand to hold a Quanti-Tray upright with the well side facing the palm. Gentlypull foil tab to separate the foil from the tray. Avoid touching the inside of the foil or tray.8. Squeeze the upper part of the Quanti-Tray so that the Quanti-Tray bends towards thepalm.9. Pour the reagent/sample mixture directly into the Quanti-Tray avoiding contact with thefoil tab. Tap the small wells 2-3 times to release any air bubbles.10. Place the sample-filled Quanti-Tray onto the Quanti-Tray/2000 rubber insert of theQuanti-Tray Sealer with the well side (plastic) of the Quanti-Tray facing down.11. Once all samples have been processed note the “time in the incubator” on the back of theQuanti-Tray and place the samples in the incubator.12. Remove samples from the incubator after 18-22 hours <strong>for</strong> Colilert 18.13. Wells that are yellow under plain light are positive <strong>for</strong> total coli<strong>for</strong>ms. Wells that areyellow and then fluoresce under a black light are positive <strong>for</strong> E. coli. Sample results areobtained by counting and recording the number of large and small yellow, fluorescingwells. Once the number of large and small wells is obtained the “most probable number”(MPN) is recorded from the MPN table (TABLE 4.3).14. Results must be noted on the field sheets, field notebook, or some other type of record.Dilutions can be done if the results are expected to be greater than 2419 cfu/100ml. High cfucounts may be experienced during storm run-off events, high recreational periods, anddownstream of known fecal pollution sources. When per<strong>for</strong>ming dilutions two sample bottles arecollected <strong>for</strong> each site (FIGURE 4.6).The first bottle is processed following the standard processing procedures outlined above;Using the second sample bottle, pipette 10ml of the sample into an empty IDEXX bottle.Then repeat using a 1ml and 0.1ml pipette into separate IDEXX bottles. Add deionizedwater to each bottle filling them to the 100ml line; Prepare samples following the procedures outlined above. Multiply the dilution ratio by the result <strong>for</strong> each sample (TABLE 4.2) Enter the result from the dilution bottle with the greatest amount of sample that is not toonumerous to count and add the dilution flag.(See Section 10.4.4). In the example given inTABLE 4.2, the value of 25,040 CFU/100 mL would be entered into the database.Dilution MPN Value Multiplier Result100% Too numerous to count 1 Too numerous to count10% Too numerous to count 10 Too numerous to count1% 250.4 100 25,040 CFU/100 mL0.1% 47 1000 47,000 CFU/100mLTABLE 4.1. Example of dilution results using Colilert.REVISED SEPTEMBER 2012 80
STANDARD OPERATING PROCEDURES FOR SURFACE WATER QUALITY SAMPLING10 ml1 ml0.1 mlDI DI DI100% 10% 1% 0.1%FIGURE 4.6. Bacteria dilutions of 100%, 10%, 1% and 0.1% <strong>for</strong> sites with bacteria that are expected tobe greater than 2419.6 CFU/100 mL The brown liquid is the sample, while the blue is deionized water.Values
STANDARD OPERATING PROCEDURES FOR SURFACE WATER QUALITY SAMPLINGNote: 1. Look <strong>for</strong> fluorescence with a 6 watt, 365 nm, UV light within 5 inches (13 cm) ofthe sample. Face light away from your eyes and towards the sample.2. Samples are negative if at any time after 18 hours there is no yellow and/orfluorescence.3. Yellow or yellow/fluorescence observed be<strong>for</strong>e 18 hours is a valid positive.However, after 22 hours from inoculation, heterotrophs may overwhelm Colilert-18’s inhibition system. There<strong>for</strong>e, yellow or yellow/fluorescence first observed after22 hours from inoculation is not a valid positive.4.2.2 PROCEDURAL NOTESA slight tinge may be observed when Colilert-18 is added to the sample.Colilert-18 can be run in any multiple tube <strong>for</strong>mat. <strong>Standard</strong> Methods <strong>for</strong> theExamination of <strong>Water</strong> and Wastewater MPN tables should be used to find Most ProbableNumber.Some water samples containing humic material may have an innate color. If a watersample has some background color, compare inoculated Colilert-18 sample to a controlblank of the same water sample.Do not dilute sample in buffered water. Colilert-18 is already buffered.Colilert-18 is a primary water test. Colilert-18 per<strong>for</strong>mance characteristics do not apply tosamples altered by any pre-enrichment or concentration.In samples with excessive chlorine, a blue flash may be seen when adding Colilert-18. Ifthis is seen, consider sample invalid and discontinue testing.Aseptic technique should be always followed when using Colilert-18. Dispose of waste inaccordance with good laboratory practices.4.2.3 QUALITY CONTROL PROCEDURESThe following quality control procedure is recommended <strong>for</strong> each lot of Colilert-18, or more oftenas regulation require.1. Inoculate 3 sterile vessels filled with 100 ml sterile water with the following:a. one with Quanti-Cult** E. coli or a sterile loop of ATCC***25922 or 11775 (E.coli)b. one with Quanti-Cult Klebsiella pneumoniae or a sterile loop of ATCC 31488(total coli<strong>for</strong>m)c. one with Quanti-Cult Pseudomonas aeruginosa or a sterile loop of ATCC 10145 or27853 (non-coli<strong>for</strong>m).2. Follow the P/A Procedure or Quanti-Tray Enumeration Procedure above.3. Results should match the Result Interpretation.4.3 LAKE SAMPLING LOCATIONS FOR BACTERIABacteria concentrations can be monitored at any location on the lake. Typically, there arenegligible quantities of bacteria at deep-water sampling sites. In order to determine the threat of E.coli to public health, the samplers should consider taking several samples at beaches or docks.There is a 6 hour maximum holding time between the time of sampling and the time the bacteriaare placed in the incubator.REVISED SEPTEMBER 2012 82
STANDARD OPERATING PROCEDURES FOR SURFACE WATER QUALITY SAMPLINGTABLE 4.3 IDEXX Quanti-Tray/2000 MPN TABLEREVISED SEPTEMBER 2012 83
STANDARD OPERATING PROCEDURES FOR SURFACE WATER QUALITY SAMPLINGTABLE 4.3 IDEXX Quanti-Tray/2000 MPN TABLEREVISED SEPTEMBER 2012 84
STANDARD OPERATING PROCEDURES FOR SURFACE WATER QUALITY SAMPLINGCHAPTER 5MEASURING FLOWStream discharge is the volume of water passing through a cross-sectional area per unit of time. Assuch, discharge is expressed in terms of volume per unit of time; examples might include cubic feetper second, gallons per minute, millions of gallons per day, cubic meters per second, etc. Differenttypes of discharge measurement methods may require the use or application of different units ofmeasurement. Flows measured by gauging a cross-section are typically reported in cubic feet persecond; flows measured volumetrically are recorded in units of gallons per minute or gallons persecond. All such measurements, however, are converted to cubic feet per second (CFS) <strong>for</strong>consistency.5.1 INSTANTANEOUS DISCHARGE WITH FLOW METERInstantaneous discharge with a flow meter is calculatedas the velocity (V) in feet per second multiplied bycross-sectional area (A) in square feet. For meteredmeasurements, cross-sectional area is determined bystringing a graduated tape (1/10 ft. increments) acrossthe channel to measure distance at cross-sectionstations where depth and velocity are measured.Depth of water is measured with a top setting rodhaving 1/10 foot increments. Area is depth multipliedby width in small increments (Harrelson et al., 1994).A Marsh-McBirney Flow Meter is used to measurevelocity and depth at a pre-determined position in thechannel (Marsh McBirney Inc., 1999) (FIGURE 5.1).Select a location in the stream channel that willprovide a representative measurement of the entireflow.Do not select a location with a split channel, on a meander, or one with an obstructionimmediately upstream from the measurement location.Ponded water (flow = 0 ft/sec) is not typically sampled.FIGURE 5.1. Flo-Mate meter. Sensor on right.Add the event "STREAM DRY AT TIME OF SITE VISIT" to the <strong>Water</strong> QualityDatabase (WQDB) if the stream is dry. This data is important even if there are nottest results associated with the visit. See Section 10.4.3 <strong>for</strong> details on how to enterevent in<strong>for</strong>mation to the WQDB.5.1.1 FIELD PROCEDURE1. Extend the tape across the channel from bank-to-bank and perpendicular to the flow. Eachend of the tape should be tied to a tent peg or other firmly secured structure. After the tapehas been tied to the tent pegs, the tape should be taut with as little sag as possible.REVISED SEPTEMBER 2012 85
STANDARD OPERATING PROCEDURES FOR SURFACE WATER QUALITY SAMPLINGIf the channel is wide and the wind is blowing, tie strips of flagging on the tape to keepit from whipping.2. Attach the meter sensor to the top-setting wading rod, place the sensor in the flow, turnthe meter on, and check the reporting units. The meter should be set <strong>for</strong> reading flow infeet per second. Press down on the ON/C and OFF keys simultaneously to cycle betweenfeet per second and meters per second.The meter can be set to averageflows over a set period of time. Toset the fixed point average, press the and keys simultaneously untilthe display shows the letters FixedPoint Averaging (FPA). Press or keys until the FPA increment isset to 10 seconds. Wait until thedisplay automatically switches backto velocity.3. The observer taking the measurementsshould move to one edge of thechannel, <strong>for</strong> example the right edge ofwater (REW), as determined by facingdownstream. Position one eye directlyabove the tape at the exact locationwhere the water and the bank interface,and call out the measurement to theRecorder, <strong>for</strong> example the reading is0.8 feet. This number should berecorded under "Distance from InitialPoint" together with the abbreviationREW (right edge of water).4. The observer should move toward theLEW, and read the measurement offthe tape at the water-bank interface andcalculate the width of channel. Dividethe width by 20 and round to thenearest whole number. USGSFIGURE 5.2. Top set wading rod.recommends that no more than 5% ofthe stream discharge be represented in each sub-sectional area of the cross-section; inpractice, this usually equates to 20 to 25 measurements across the width of the stream. Forexample, if the channel is 58 feet wide, 58 / 20 = 2.5; round up to 3.0. Take flowmeasurements every 3 feet.REVISED SEPTEMBER 2012 86
STANDARD OPERATING PROCEDURES FOR SURFACE WATER QUALITY SAMPLINGObserver w/Flow MeterLEWWading RodMeasuring Tape w/20 incrementsREWFlow DirectionFIGURE 5.3. Plan view of observer and measuring tape with respect the stream.For narrow channels the minimum spacing is 0.3 feet.5a. For depths ≤ 2.5 feet. The observer positions the wading rod vertically with the sensorpointed upstream into the flow. Determine the depth of water from the rod depth gaugeto the nearest 10 th of a foot. If the waterlevel is at the half way mark between 0.4feet and 0.5 feet on the depth gauge(hexagonal rod); in this case the reading is0.45 feet. If the water level is between 0.4and 0.45 or between 0.45 and 0.5, roundoff to the nearest 1/10 foot increment.The depth measurement is recorded under"Depth". Depress the unlocking lever andmove the round rod up to depth you justrecorded. This is 0.6 of the depth. Recordthe velocity <strong>for</strong> that station after the meterstabilizes.FIGURE 5.4. Discharge measurement.5b. For depths > 2.5 feet. Use the two-point method <strong>for</strong> measuring flow. The one-point methodmeasures flow at 0.6D (Depth), while the two-point method requires an average of flowmeasurements taken at 0.2D and 0.8D (Corbett, 1962). If the depth is 2 feet, the singlepointmethod requires a measurement at 1.2 feet (2 ft. x 0.6). If the depth is 3.5 feet, thetwo-point method requires readings at 0.7 feet. (3.5 ft. x 0.2) and 2.8 feet (3.5 ft. x 0.8).Record the average of the two velocities <strong>for</strong> that station after the meter stabilizes.6. Repeat steps 3-5 until the left edge of water is reached. Record the LEW distance under"Distance from Initial Point" with the abbreviation LEW next to it.REVISED SEPTEMBER 2012 87
STANDARD OPERATING PROCEDURES FOR SURFACE WATER QUALITY SAMPLING7. Use the excel sheet to calculate discharge (See Chapter 9 - Post-Trip <strong>Procedures</strong>).5.1.2 METER ERROR MESSAGESThe displaying of errors alerts the user of possible problems with either the meter or the process.Errors can be displayed as messages or numerical codes. There are three error messages and fivenumerical codes.With the exception of Err 2, error codes freeze the display. Turn the unit OFF, and then backON to clear the display. If the error message persists, return the meter to the manufacturer <strong>for</strong>maintenance.Low Bat - Indicates low battery voltage. Replace the batteries with two D cells. This operation willrequire a screwdriver or coin to open the battery compartment.Noise - Indicates electrical noise is present in the flow. The noise flag usually comes on <strong>for</strong> a fewseconds right after the sensor is placed in the water. This is normal. If the noise level is too highto get accurate readings, the screen will blank out.Con Lost - Indicates sensor electrodes are out of the water or have become coated with oil orgrease. After a few minutes, the unit will turn itself off. If the electrodes are coated, clean thesensor with a mild soap and a soft cloth.Numbered Error Messages Error #1 - Problem with sensor drive circuit. Check sensor disconnect. Error #2 - Memory full error. Memory must be cleared be<strong>for</strong>e another reading can bestored. Error #3 - Incorrect zero adjust start sequence. Reinitiate zero start sequence. Error #4 - Zero offset is greater than the zero adjust range. Repeat the zero adjustprocedure. If error is still displayed, unit needs servicing. Error #5 - Electroconductivity lost or noises detected during zero adjust. Usually caused bythe sensor being out of the water.5.1.3 KEY SUMMARYThe function keys can be operated as single key functions or two-key functions.One Key Function ON/C - Turns Unit ON. Clears the display and restarts the meter. OFF - Turns Unit OFF. Increments FPA (fixed point averaging), TC (Time Constant), and Memory Location. Decrements FPA, TC, and Memory Location. RCL - Alternates between Recall and Real-Time <strong>Operating</strong> Modes. STO - Stores Values in Memory.Two Key FunctionREVISED SEPTEMBER 2012 88
STANDARD OPERATING PROCEDURES FOR SURFACE WATER QUALITY SAMPLINGON/C + OFF - Change Units, Turns Beeper ON/OFF.+ - Alternates between FPA (fixed point averaging) and rC (Time Constant) Filtering.ON/C + STO – Memory may be cleared from either the real-time or recall mode bypressing ON/C and STO simultaneously.RCL + STO - Initiates zero adjust sequence. Zero stability is ± 0.05 ft/sec.5.2 FLOAT METHODThe float method is a simple means of estimating discharge in low or high flow streams where theMarsh McBirney flow meter will not operate or is not safe to operate.5.2.1 FLOAT METHOD PROCEDURE1. Measure and mark two points along the length of the channel, at least two to three channelwidths apart, at the channel cross-section. Record this value on the field <strong>for</strong>m.2. Measure three depths across at the channel cross-section. Average the 3 depths and recordthe value on the field <strong>for</strong>m.3. Two observers are best. One tosses the float into the channel above the marker and callsout when it crosses the upstream point. The float should be something that will partiallysubmerge in the water such as an apple or stick. Toss each float a different distance fromthe bank to obtain an average of velocities.4. The downstream observer starts the timer, sighting across the stream from the lower point.When the float passes, stop the watch and record the time. Repeat the procedure 5 to 10times. Determine the mean surface velocity. A coefficient of 0.85 is commonly used toconvert the velocity of a surface float to mean velocity in the vertical (USGS Field Manual,2004).5. Using the previously measured cross-sectional area (A), multiply velocity (V) times area tofind discharge (Q= VA). Record it on a data sheet with date, time, etc. If the crosssectionalarea cannot be obtained because of unsafe wading conditions, record the velocity.If it is possible to return to the site under favorable conditions, measure the cross-sectionalarea and compute the estimated Q (Harrelson et al, 1994).5.3 U.S.G.S. STAFF GAGEAt sites located near or next to a U.S.G.S. gauging station, a discharge measurement can be madeby recording the time of day and the staff gauge height. On the U.S.G.S. web pagehttp://waterdata.usgs.gov/nwis/, find the appropriate gauging station and determine the dischargefrom the table provided and record on the field data sheet <strong>for</strong> that site.5.4 VOLUMETRIC MEASUREMENTThe volumetric measurement of discharge is only applicable to small discharges, but it is the mostaccurate method of measuring such flows. In this method the hydrographer observes the timerequired to fill a container of known capacity, or the time required to partly fill a calibratedcontainer to a known volume.REVISED SEPTEMBER 2012 89
STANDARD OPERATING PROCEDURES FOR SURFACE WATER QUALITY SAMPLINGVolumetric measurements are usually made where the flow is concentrated in a narrow stream, orcan be so concentrated, so that all the flow may be diverted into a container (Examples or possiblelocations include: V-notch weir, artificial control where all the flow is confined to a notch or to anarrow width of catenary-shaped weir crest, and a cross section of natural channel where atemporary earth dam can be built over a pipe of small diameter, through which the entire flow isdiverted).Volumetric measurements have also been made when no other type of measurement is feasible, as<strong>for</strong> example on small streams composed of a series of pools behind broad-crested weirs. At lowflows the depth of water on the weir crest is too shallow to be measured by current meter, and thevelocity in the pools is too slow <strong>for</strong> such measurement. Discharge is measured by taking timedsamples of flow sufficient to fill a container of known volume held along the downstream face of acontrol.REVISED SEPTEMBER 2012 90
STANDARD OPERATING PROCEDURES FOR SURFACE WATER QUALITY SAMPLINGCHAPTER 6AUTOMATED FIELD EQUIPMENTThe TMDL Unit utilizes a wide variety of automated equipment to collect water quality, streamstage, and meteorological data. A list of materials potentially required to install equipment islisted in Appendix A. Each installation is unique and should be well thought out to ensure allnecessary items are available. Specific installation requirements <strong>for</strong> each instrument are discussedbelow in the appropriate section.6.1 RAIN GAGEPrecipitation data is often needed to calibrate hydrologic models. If no precipitation data isavailable <strong>for</strong> a particular watershed a rain gage can be deployed to collect data <strong>for</strong> use in any futuremodeling needs. The TMDL Unit uses Texas Electronics 8” Rain Gages. The rain gage consists ofa tipping bucket mechanism and a HOBO Event Data Logger. The buckets tip in response toevery 1/100 inch of precipitation, which is recorded as an event on the HOBO Event Data Logger.Prior to deployment the logger should be connected to a computer and “named” <strong>for</strong> the site whereit will be deployed. This will place the site name in the header of the data when it is downloaded.The logger is connected to the tipping buckets relay output via two wires and has a red light thatblinks every two seconds while it’s logging and blinks rapidly four times as it stores an event.It is important that the serial numbers associated with the gage and the location of thedeployment is recorded on the TMDL equipment inventory list and any changes arenoted promptly.6.1.1 PLACEMENTThe rain gage should be mounted in a relatively level spot, which is representative of thesurrounding native area (do not place on paved surfaces). The lip of the funnel should behorizontal and at least 30 cm above the ground. Consideration should be given to average snowdepth if the gage is placed in an area that receives sufficient snowfall to bury the gage. The gageshould be placed away from objects that could obstruct wind or rain. The distance should be 2-4times the height of the obstruction. Potential mounting options include a fence post <strong>for</strong> tallerinstallation needs or attached to a typical garden paver. The bucket should be secured to ananchored object via a lock and cable.6.1.2 PRE-TRIP ACTIVITIESBe<strong>for</strong>e leaving to retrieve data sign out a “Rain Gage Bag”. The bag contains all the necessary tools<strong>for</strong> maintaining and downloading data <strong>for</strong> the rain gages. The project manager should insure thatthe bag contains the following:1. HOBO Shuttle;2. Enough batteries to replace each HOBO Event Data Logger serviced and two additional<strong>for</strong> the shuttle;3. Cleaning supplies (paper towels and filled water bottle);4. Tools (screwdrivers, wrench, and level);5. Communication cables (shuttle and PC); and6. Equipment manuals.REVISED SEPTEMBER 2012 91
STANDARD OPERATING PROCEDURES FOR SURFACE WATER QUALITY SAMPLINGThe HOBO Shuttle’s clock should be checked be<strong>for</strong>e leaving <strong>for</strong> the field. Launching the shuttlewhile it is connected to a host computer will synchronize the shuttle’s clock to the computer’sclock. This will ensure that the event loggers are relaunched with an accurate time and datesettings. To launch the shuttle, connect to the host computer with the cable provided (serial portcable). Open the Boxcar Pro software and select launch from the logger menu. Boxcar Pro willautomatically synchronize the shuttle clock and the battery status. Replace the shuttle batteries ifnecessary. The shuttle must be relaunched after changing its batteries.It is recommended that a laptop, with Boxcar software loaded, be brought in the fieldas a backup to the HOBO Shuttle. If problems are encountered while downloadingthe data the laptop may be needed.6.1.3 MAINTENANCE AND CALIBRATIONThe funnel, screen, tipping buckets, and tipping mechanism must be kept clean. Routinemaintenance should be scheduled to remove any accumulation of dirt, dust, and <strong>for</strong>eign material.A general 1-3 month maintenance schedule should be followed and include:1. Clean funnel, screen, and tipping buckets;2. Inspect tipping buckets <strong>for</strong> proper operation (i.e. test tips);3. Check to make sure HOBO Event Logger is logging the events as they occur (during a testtip the LED should blink quickly four times as it logs the event4. Insure gage is level; and5. Replace HOBO Event Logger battery (CR2032) annually.The rain gages should be calibrated annually. Calibration can be accomplished using a graduatedcylinder. The event logger should be downloaded be<strong>for</strong>e calibrating and relaunched aftercalibration if the gage is being calibrated during deployment. If deployed, a laptop computershould be brought to download and display the test data. Clean and wet the gage thoroughlyallowing water to flow through the gage be<strong>for</strong>e beginning the test, this reduces the chance of wateradhering to portions of the gage and causing errors in the calibration. Allow 824 mL of water toflow through the funnel at the rate of 1mL per second. The number of tips can be countedmanually and verified by displaying the logger data. Best results are obtained by running multipletests and by using multiple volumes of water. 824mL of water should yield 100 +/- 3 tips;there<strong>for</strong>e, 8.24 mL of water should cause the bucket to tip once.Should the gage need adjustment, change the heights of the two calibration post adjustmentscrews. Rotate each screw by a small amount and recheck the calibration <strong>for</strong> the new screwpositions using 8.24 mL of water. The calibration posts should be adjusted upward (counterclockwise) whenever the amount of water needed to cause the bucket to tip is more than 8.24 mL.Whenever less water is needed the posts should be adjusted downward (clockwise). Do not dry thetipping buckets during the calibration process. Carefully tighten the locking nuts on thecalibration screws after completing the adjustments.REVISED SEPTEMBER 2012 92
STANDARD OPERATING PROCEDURES FOR SURFACE WATER QUALITY SAMPLING6.1.4 DOWNLOADING DATAData can be downloaded from the event logger in the field by using the HOBO Shuttle or laptopcomputer. Connect the event logger to the shuttle by plugging the foot long cable stored insidethe shuttle cover into the event logger. Press the black button located on top of the shuttle to startoffloading the logger. The series of LED lights on the shuttle will progress through the offloadprocess starting with a blinking orange LED while offloading. Once the offloading of data iscomplete the shuttle will check the batterystatus of the logger. If the battery level isbelow 30% the red “Change Battery” LEDwill blink. Disconnect the shuttle, replacethe batteries, reconnect, and press theblack button. Once the battery test passesthe orange “Testing” LED will blink, pressthe button to proceed. Press the buttonagain to relaunch the event logger. Whenthe green LED indicating successfuldownload is blinking, press the button onemore time. If the red “Com failure” LEDblinks, check the connections and press thebutton once to clear the failure and toattempt offloading again. If the failurecontinues, replace the batteries in the eventlogger and attempt once again. RemoveFIGURE 6.1. View of rain gage with funnel and screenremoved. Note that the tipping buckets are free of anycables or wires that may hinder them from moving freely.the event logger from the rain gage if the communication failure cannot be fixed in the field andreturn to the manufacturer <strong>for</strong> repair. The event logger can also be offloaded using a laptopcomputer by connecting the serial cable, opening Boxcar Pro and selecting “readout” from thelogger menu. Once the logger has been relaunched the old data is erased. When placing the eventlogger back into the rain gage it is imperative that the wire connecting the logger to the tippingbucket mechanism does not obstruct the movement of the tipping buckets (FIGURE 6.1).It is recommended that a laptop, with Boxcar software loaded, be brought in the fieldas a backup to the HOBO Shuttle. If problems are encountered while downloadingthe data the laptop may be needed.6.1.5 POST-TRIP ACTIVITIESUpon return to the office replace consumables in the HOBO bag (batteries, towels, etc) andoffload data from the HOBO Shuttle. Data is offloaded from the shuttle by connecting it to acomputer, opening BoxCar Pro, and selecting HOBO Shuttle Readout from the logger menu.The program will offload the data from the event logger. Be sure to store each logger’s data to theuser-defined location (do not use the default location), check the shuttle’s battery and synchronizeits clock. Data will not be erased from the shuttle until it has been “offloaded” and then used tooffload another event logger. Once consumables have been replaced and the shuttle has beenoffloaded place the bag back in the cabinet <strong>for</strong> future use.REVISED SEPTEMBER 2012 93
STANDARD OPERATING PROCEDURES FOR SURFACE WATER QUALITY SAMPLING6.1.6 FILE STORAGEElectronic files should be stored on the project manager’s d-drive within the project’s file structure.Copies of data files must also be maintained on the project manager’s m-drive or on a CD. Rawdata files should also be maintained to preserve data integrity. As new data is collected it shouldbe added to a running list of compiled data.All field activities related to installation, data downloads, maintenance, calibration, etc. must bedocumented in the project field notebook. Observations noted should include, but are notlimited to date and time, cleanliness of equipment upon arrival, actions taken (cleaned funnel,checked level, etc.), destination of downloaded files, problems encountered, check serial numbers,etc.6.2 TEMPERATURE GAGESADEQ uses HOBO Pro Temperature Gages. The gages are deployed in conjunction with raingages at sites where snow is possible and in watersheds where no temperature data is available.The gages contain a HOBO Event Logger encased within a series of air baffles. Prior todeployment the event logger should be connected to a computer and “named” <strong>for</strong> the site where itwill be deployed. This will place the site name in the header of the data when it is downloaded.The temperature is logged every 15 minutes.It is important that the serial numbers associated with the gage and the location of the deploymentis recorded on the TMDL equipment inventory list and any changes are noted promptly.6.2.1 PLACEMENTThe gage should be placed away from objects that could obstruct wind or rain. The distanceshould be 2-4 times the height of the obstruction. The gage should be placed approximately threefeet above the ground to avoid saturating the gage.6.2.2 DOWNLOADING DATAData can be downloaded from the event logger in the field by using the HOBO Shuttle or laptopcomputer. Connect the logger to the shuttle by plugging the foot long cable stored inside theshuttle cover into the logger. Press the black button located on top of the shuttle to startoffloading the logger. The series of LED lights on the shuttle will progress through the offloadprocess starting with a blinking orange LED while offloading. Once the offloading of data iscomplete the shuttle will check the battery status of the logger. If the battery level is below 30%the red “Change Battery” LED will blink. Disconnect the shuttle; replace the batteries, reconnect,and press the black button. Once the battery test passes the orange “Testing” LED will blink, pressthe button to proceed. Press the button again to relaunch the event logger. When the green LEDindicating successful download is blinking, press the button one more time. If the red “Comfailure” LED blinks, check the connections and press the button once to clear the failure and toattempt offloading again. If the failure continues, replace the batteries in the event logger andattempt once again. Remove the logger from the rain gage if the communication failure cannot befixed in the field and return to manufacturer <strong>for</strong> repair. The logger can also be offloaded using aREVISED SEPTEMBER 2012 94
STANDARD OPERATING PROCEDURES FOR SURFACE WATER QUALITY SAMPLINGlaptop computer by connecting the serial cable, opening Boxcar Pro and selecting “readout” fromthe logger menu. Once the logger has been relaunched the old data is erased.6.2.3 POST-TRIP ACTIVITIESData is offloaded from the shuttle by connecting it to a computer by opening BoxCar Pro, andselecting HOBO Shuttle Readout from the logger menu. The program will offload the data fromthe logger. Be sure to store each logger’s data to the user-defined location (do not use the defaultlocation), check the shuttle’s battery and synchronize its clock. Data will not be erased from theshuttle until it has been read out and then used to offload another event logger.6.2.4 FILE STORAGEElectronic files should be stored on the project manager’s d-drive within the project’s file structure.Copies of data files must also be maintained on the project manager’s m-drive or on a CD. Rawdata files should also be maintained to preserve data integrity. As new data is collected it shouldbe added to a running list of compiled data.All field activities related to installation, data downloads, maintenance, calibration, etc. must bedocumented in the project field notebook. Observations noted should include but are not limitedto, date and time, cleanliness of equipment upon arrival, actions taken, destination of downloadedfiles, problems encountered, check serial numbers, etc.6.3 PORTABLE (AUTOMATIC) SAMPLERS6.3.1 GENERAL OVERVIEWThe TMDL Unit utilizes portable (often referred to as automatic samplers) to supplement grabsampling ef<strong>for</strong>ts. Portable samplers are deployed and programmed to start sampling as water levelsrise. The use of portable samplers allows <strong>for</strong> the sampling of storm events over a larger portion ofthe hydrograph at more locations than could be accomplished by traditional grab samplingmethods. The samplers typically are configured to hold 24 one liter bottles and can beprogrammed to collect samples over varying time frames (i.e. one bottle every hour or two bottlesevery two hours). The autosamplers are powered by a 12-volt rechargeable battery which will holdenough charge to complete a sampling program <strong>for</strong> up to five weeks. In order to continuouslycharge to the battery during deployment 5-W solar panels are available <strong>for</strong> use with the ISCOsamplers.Currently the TMDL Unit uses portable samplers manufactured by American Sigma (models 800and 900 Max; FIGURE 6.2) and Teledyne ISCO (model 6712). Both brands are constructed andoperate similarly. They consist of a base that holds the bottles, controller section, and a lid. Thecontroller section houses the electronics, pump, distributor arm, and battery. <strong>Standard</strong>configurations are battery powered but 5W solar panels can be installed to continually charge thebattery.REVISED SEPTEMBER 2012 95
STANDARD OPERATING PROCEDURES FOR SURFACE WATER QUALITY SAMPLINGFIGURE 6.2. Sigma 900 Max autosampler (left) and ISCO 6712 autosampler (right)6.3.2 QUALITY CONTROLPrior to deploying a sampler to a new location the intake, pump, and distributor tubing must bereplaced and the unit completely cleaned. Additionally, if polyethylene bottles are used they areproject and site specific and cannot be used at sites other than where they were originally deployed.Typically two sets of bottles are ordered <strong>for</strong> each site, one to replace the other after samples arecollected. Bottles are acid washed when new and after each sampling event. The bottles arecapped, bagged and placed inside a container during storage and transport. The bottle sets shouldbe labeled to indicate the site and set (e.g. “A” or “B”) once they have been deployed so that theycan be identified independently. The sample volume should be calibrated be<strong>for</strong>e each deploymentto ensure bottles will be filled properly. Volume calibration can be per<strong>for</strong>med using the volumecalibration/test-run kit developed by the TMDL Unit.Bottle and equipment blanks should be collected and analyzed <strong>for</strong> the same parameters that arebeing sampled through the autosampler prior to deployment. Equipment blanks are collectedafter the tubing has been replaced and prior to field deployment. Typically one liter bottle of DIwater is pumped through the intake, pump and distributor tubing into one of the new bottles(after acid cleaning), then poured into a regular sample bottle supplied by the analytical laboratory.Bottle blanks should be collected <strong>for</strong> each set of bottles after the initial acid wash (as part of theequipment blank) and periodically throughout the project as the bottles are cleaned prior toredeployment.Ideally several grab samples will be collected simultaneously with autosampler sample collection todetermine that the autosamplers are not biasing the results.6.3.3 PLACEMENT/DEPLOYMENTPortable samplers can be deployed <strong>for</strong> long or short terms depending on the requirements of theproject. Regardless of the length of deployment, installation should follow the same generalguidelines listed below: Place and secure sampler above potential high water line, see FIGURE 6.3 Run intake tubing and float switch wiring from autosampler to stream and secure (longtermdeployments should include anchored PVC pipe which the tubing and wire is routedthrough), see FIGURE 6.4REVISED SEPTEMBER 2012 96
STANDARD OPERATING PROCEDURES FOR SURFACE WATER QUALITY SAMPLINGThe intake strainer should be placed approximately 4” above the stream channel to avoidsampling bedload material;Secure float switch in stream and attach wiring to autosampler.The TMDL Unit utilizes simple float switches to activate the automatic samplers in response tochanges in water level, see FIGURE 6.5 <strong>for</strong> an example. When deploying autosamplers care mustbe taken to minimize vandalism, lose of equipment, and required maintenance while allowing <strong>for</strong>sample retrieval under adverse weather conditions.See Appendix A <strong>for</strong> a list of equipment needed <strong>for</strong> installation of autosamplers and Appendix H<strong>for</strong> detailed instructions <strong>for</strong> float switch construction.FIGURE 6.3. Example autosampler installation scenarios- under bridge (left) and secured to bridge support (right)REVISED SEPTEMBER 2012 97
STANDARD OPERATING PROCEDURES FOR SURFACE WATER QUALITY SAMPLINGFIGURE 6.4. Examples of intake tubing (with strainer attached) and float switch installations, note anchoring to fixobjects.In order to determine the discharge at time ofsampling the sampler should be deployed at ornear a USGS gaging station or with a levellogger. If deployed with a level logger a stage todischarge relationship will have to bedeveloped by measuring the instantaneousdischarge at several stages of flow. This task isnormally accomplished through dischargemeasurements taken when collecting grabsamples.6.3.4 PROGRAMMING OPTIONSAutosamplers have a wide range ofFIGURE 6.5. Float switch (black) connected to PVC capprogramming options. Although the differentmanufacturers have slightly different “buttonology”, each operate in a similar fashion, seeFIGURE 6.6. They can be programmed, using the keypad, to collect individual or multiplesamples at programmable time intervals.REVISED SEPTEMBER 2012 98
STANDARD OPERATING PROCEDURES FOR SURFACE WATER QUALITY SAMPLINGFIGURE 6.6. Overview of autosampler keyboards- Sigma 900 Max (left) and ISCO 6712 (right)Appendix J contains an example of a Sigma and ISCO program. It is important to keep in mindthat the number of bottles collected per sample and the sampling interval are dependent on thedata needs of the project. Additionally, the required analytical sample volume and holding timesneed to be considered.6.3.5 EQUIPMENT KEYSEquipment that is deployed in the field <strong>for</strong> any extended period of time must be secured toprevent theft. A large number of keys and locks have been used within the unit. To enable accessto equipment <strong>for</strong> sample and data collection it is the project manager’s responsibility to record thekey number and the corresponding location that the key fits. This is best recorded in the cover ofthe field notebook and in a spreadsheet.6.4 WATER LEVEL LOGGERS<strong>Water</strong> level loggers typically consist of a pressure transducer used to record water level andtemperature in a stream or lake over a period of time. <strong>Water</strong> level loggers are designed <strong>for</strong> longtermdeployment. They can be deployed and left unattended <strong>for</strong> months at a time, collecting waterlevel data at user-defined intervals and storing it digitally into logger memory. By operating in acontinuous 24/7 monitoring mode, water level loggers eliminate many of the hassles of manualdata collection approaches and facilitate monitoring of multiple locations at the same time.The logger data, in conjunction with several manually obtained stream discharge measurements(obtained at different stages), and a survey channel cross section provide the in<strong>for</strong>mation requiredto construct a stage-discharge relationship. Once this relationship is established, stream dischargecan be estimated on the basis of the stage data alone.6.4.1 GENERAL CARELoggers should be installed where the stream channel is most stable (e.g. bedrock lined channel).In most cases the logger should be placed inside a slotted PVC pipe or similar material that servesas a stilling well that will dampen water level fluctuations and protect the logger. The pipe may besecured to a permanent structure, buried in the riverbank, secured with rocks, or fastened to theREVISED SEPTEMBER 2012 99
STANDARD OPERATING PROCEDURES FOR SURFACE WATER QUALITY SAMPLINGbank with rebar or similar material, see FIGURE 6.4. Once installed a reference point should beestablished upon which future water depth measurements can be made. For example, the bottomof the stream channel if bedrock lined or the PVC cap at the end of the well screen could be usedas the reference point. It is important that the reference point be stable throughout the span ofthe project.Loggers should be cleaned and downloaded every six weeks. Depending on the model, batteriesshould be replaced/checked every six months. Most loggers come pre-calibrated from the factory,where possible real-time measurements should be taken and compared to the data recorded by thelogger. The calibration on the loggers, regardless of manufacturer, should be checked uponinstallation and every six months during deployment. The calibration can be checked by filling aknown length (e.g. three feet) 1” PVC pipe with water, placing the pressure transducer in the pipeand reading the level recorded by the logger. A “dry” (pressure transducer not submerged in water)reading should equal zero. If the measurements are off by more than two-tenths of a foot, thelogger should be sent back to the factory <strong>for</strong> calibration.Once a level logger is installed, a stream channel cross-section must be completed following theprocedures discussed in Sections 8.2 and 8.3 of the <strong>Standard</strong> <strong>Operating</strong> <strong>Procedures</strong> <strong>for</strong> <strong>Water</strong>Quality <strong>Sampling</strong>. The cross-section transect should include the position of the level logger andreference point. If large deposition or scour events occur a new cross-section will need to becompleted.The following sections describe the procedures <strong>for</strong> logger set-up, deployment, and data retrieval ofthree common water level loggers used by the ADEQ TMDL Unit. The necessary materials neededto per<strong>for</strong>m routine maintenance are included in Appendix A.6.4.2 LEVEL LOGGER FIELD OBSERVATIONSDuring each site visit several observations must be made and include: Current water level as measured from the reference point (if dry, record as “dry”); Compare actual water depth to real-time instrument reading; Changes in stream channel (material, geometry, etc) since last visit; Logger time relative to laptop, GPS, or other accurate reference time; File path where data was saved; and Serial number of logger.6.4.3 HOBO® U-20 WATER LEVEL LOGGERSThe HOBO ® U-20 <strong>Water</strong> Level Logger is a completely self-contained unit meaning there are novent tubes or desiccants to maintain, see FIGURE 6.7. This non-vented logger is compact, andrequires minimal maintenance. However, the logger depends on either a second logger, or weatherstation to correct <strong>for</strong> changing barometric pressures. The procedures <strong>for</strong> setup, deployment, dataretrieval, and barometric pressure compensation are discussed below. The HOBOware SoftwareKit loaded onto a computer and an optic USB Base Station are required <strong>for</strong> logger setup andretrieval.REVISED SEPTEMBER 2012 100
STANDARD OPERATING PROCEDURES FOR SURFACE WATER QUALITY SAMPLINGThe following steps should be taken <strong>for</strong> the deployment of the HOBO® U-20 <strong>Water</strong> Level Logger:1. Install the HOBOware Software onto computer.2. Plug the USB-Optic Base Station cable into a USB port on the computer. If the basestation has never been connected to the computer be<strong>for</strong>e, it may take a few seconds <strong>for</strong> thenew hardware to be detected by the computer. It may also be necessary to reboot thecomputer.3. Unscrew the black plastic end cap from thelogger by turning it counter-clockwise.4. Align flat areas of the logger and base station,then insert the logger. Gently twist the logger tobe sure that it is fully seated in the base station.If the logger has never been connected to thecomputer be<strong>for</strong>e, it may take a few seconds <strong>for</strong>the new hardware to be detected by thecomputer.5. Click the Launch icon on the toolbar. Thisdisplays the logger’s launch window.FIGURE 6.7. HOBO U-20 Level Logger6. Review the default launch settings and make any necessary changes. Enter a new name inthe description field and select or deselect channels to log. You must select absolutepressure and temperature. Determine the appropriate logging interval and program thelogger. Loggers are usually set to record data at 15 minute intervals. You may start loggingimmediately or choose the date/time you wish logging to start.7. Click Launch to begin logging. HOBOware displays the progress of the launch and warnsyou not to unplug the logger while it is being configured.8. Once this is complete you can unplug the logger. Make sure to screw the black plastic endcap back onto the logger be<strong>for</strong>e deployment.The logger is now ready to be installed in the stream channel or lake. At the end of the loggingperiod, the following steps should be followed in downloading the HOBO ® U-20 <strong>Water</strong> LevelLogger:1. Connect the logger to the computer (see logger deployment steps 2-3).2. Click the Readout icon on the toolbar, or choose readout from the logger menu. Amessage will ask whether you want to stop the logger; click OK.3. Wait while the data is read out from the logger.4. HOBOware prompts you to save the data. Specify the location and name of the file andclick Save.5. A Plot Setup dialog box will appear. When you have made your selections, click the plotbutton.6. From the displayed plot you can export the data to Excel; under the file menu select ExportPoints as Excel Text. This will prompt another save screen; input the file name andlocation and click save.REVISED SEPTEMBER 2012 101
STANDARD OPERATING PROCEDURES FOR SURFACE WATER QUALITY SAMPLING6.4.3.1 Barometric Pressure CompensationStorms and changes in elevation have a significant impact on barometric pressure. Stormy weathercan produce up to 25 millibars of pressure differential during a single day. Since one millibarequals one centimeter of water this equates to almost 10” of error in water level readings. TheHOBO ® U-20 <strong>Water</strong> Level Logger does not automatically correct <strong>for</strong> changing barometricpressures; instead a second water level logger, a HOBO Weather Station, or import ASCII<strong>for</strong>matted barometric data must be used to correct <strong>for</strong> barometric compensation. When a secondlogger is used it should be placed in a secure location near the logger, and should be set up torecord at the same times as the HOBO <strong>Water</strong> Level Logger. The HOBOware Software uses abarometric compensation assistant to convert water pressure data to water level or sensor depthvalues, and compensate <strong>for</strong> barometric pressure.To use the barometric compensation assistant:1. Open the HOBOware Software;2. Open the data file to be corrected;3. When the Plot Set Up dialog box opens, select the Barometric Compensation Assistantunder data assistants, and click the Process key;4. To use the barometric data file from another HOBO logger, click the Use Barometric Datafile button and browse to the .hobo file that contains a pressure series from an overlappingtime period;5. Name the new file, and click Create New Series. The new series will be displayed. The newseries file can then be exported to Excel (see step 6 above).6.4.4 GLOBAL WATER WL15 AND WL16 WATER LEVEL LOGGERSThe Global <strong>Water</strong> WL15 <strong>Water</strong> Level Loggers consists of a pressure transducer connected to adata recorder by a sensor cable, see FIGURE 6.8. WL16 models also record temperature but theirbasic operation is similar to the WL15.The following steps should be followed in setting up the Global <strong>Water</strong> Level Loggers <strong>for</strong>deployment:1. Install the Global Logger Software (verifyversion if using a WL16) onto a laptopcomputer;2. Verify the logger is reading accurately byplacing the transducer in a three foot longPVC pipe filled with water. Launch theGlobal <strong>Water</strong> Software and check the realtimereading of the logger. At the mainscreen “check” the “Sample Continuously”box to view real-time values. If the readingis within 0.05’ of 3.0’ the logger is properlycalibrated;Figure 6.8. Global <strong>Water</strong> Level Logger3. Make sure the computer is reading thecorrect date and time;REVISED SEPTEMBER 2012 102
STANDARD OPERATING PROCEDURES FOR SURFACE WATER QUALITY SAMPLING4. Double click the “Global Logger” icon. Once the main Global Logger window will appears,select the clear memory button.Make sure that data has been saved be<strong>for</strong>e pressing this button.5. Click the “Synchronize Time” button; this will synchronize the logger time with that ofthe computer;6. Click on the “Setup” button; here you can specify the logger/site name and the sampleinterval. In general loggers should be set to record data at 15 minute intervals;7. The logger comes pre-calibrated from the factory; however site specific calibrations can bemade. Refer to the <strong>Water</strong> Level Logger Users Guide (Global <strong>Water</strong> Instruments Inc, 2002)<strong>for</strong> the calibration procedure; and8. Click OK, the logger is now ready <strong>for</strong> deployment.The following steps should be followed in downloading the Global <strong>Water</strong> WL15 <strong>Water</strong> LevelLogger:1. Double click the “Global Logger” icon. Once the Global Logger main window will opens,click the “Get History Data” button;2. A historical data viewer window will open. Save the current reading by clicking the “Saveto File” button, select the location to save data and a file name, and click save. The file willsave as a comma separated file that can be opened in Excel.Data should be downloaded every six weeks. In addition, the Global <strong>Water</strong> WL15 <strong>Water</strong> Levelruns on a 12V lithium battery which should be changed every six months. The battery is accessedby unscrewing the black cap on the end of the data logger. The screen on the end of the sensorshould be periodically checked <strong>for</strong> clogging. The screen can be cleaned with soap and water and/orscrubbed gently with a toothbrush.The Global <strong>Water</strong> WL15 <strong>Water</strong> Level’s cable contains a vent tube that automatically corrects <strong>for</strong>barometric pressure compensation. This vent tube must not be kinked or obstructed, or erroneousdata will result. Additionally, the data logger is water resistant, not waterproof. It should not besubmerged and should be protected from condensation and rainfall.6.4.5 IN-SITU LEVEL TROLL 500 WATER LEVEL LOGGERSThe Level Troll 500 <strong>Water</strong> Level Logger is a completely sealed unit that contains pressure andtemperature sensors with an optional vented or non-vented pressure sensor, see FIGURE 6.9.The following steps should be followed in setting up the Level Troll 500 <strong>Water</strong> Level Logger <strong>for</strong>deployment:1. Remove the protective caps from the Level Troll and vented/communication cable.2. Slide back the sleeve on the cable connector.3. Orient the “flats” (grooves) so they will mate up, and insert the Level Troll connectorfirmly into the vented/communication cable connector. Slide the sleeve on the cableREVISED SEPTEMBER 2012 103
STANDARD OPERATING PROCEDURES FOR SURFACE WATER QUALITY SAMPLINGtoward the Level Troll body until the pin on the body pops into the round hole in the sloton the cable connector.4. Grasp the knurled (textured) section of the cable connector in one hand and the LevelTroll body in the other. Push and twist firmly so that the pin on the body connector slidesalong the slot on the cableconnector and locks securely intothe other hole.5. Connect vented/communicationcable to the PC serial port via theTROLL COM cable and make surethat Win-Situ software is loadedonto the computer.6. Start Win-Situ by double-clickingthe shortcut created on thedesktop. When the Win-Situapplication window opens, selectFile menu >Settings and check yourPC’s COM port (usually COM 1<strong>for</strong> direct serial port connection).Click the “OK” button.7. Click the “Connect” button toFIGURE 6.9. In-situ <strong>Water</strong> Level Logger with ventedcable attachedconnect to the Level Troll. The software will connect to the Level TROLL and displaycurrent level/depth, pressure, and temperature readings (pressure and temperature <strong>for</strong> aBaroTROLL).8. Set the clock. Both the device clock and the system (PC) clock are shown on the dashboardwhen the device is connected. The clocks update every two seconds. If the device clock ismore than two seconds off from the system clock, the device clock is displayed in red. Tosynchronize the clocks, click the Sync button.9. To prepare the device to log data, first select the Logging tab. Click the “New” button. TheLogging Setup Wizard will prompt you through the configuration of a data log—includingthe site, log name, parameters to measure, sample schedule, start time, stop time, output(pressure, depth, or water level with a reference), and other options.To start logging:A “Pending” (scheduled) log will start at its programmed time. You can start a “Ready” (manual)log at any time while connected by selecting the log and pressing “Start” to start logging;To stop logging:Select the log and press the “Stop” button or suspend (temporarily stop) it with the “Pause”button.10. After entering the logging program, you're ready to Exit the software (File menu > Exit).Disconnect the Troll Com cable by grasping the knurled (textured) section of the cableconnector in one hand and the Troll Com cable in the other. Twist in opposite directionsto unlock the Troll Com cable from the vented cable.REVISED SEPTEMBER 2012 104
STANDARD OPERATING PROCEDURES FOR SURFACE WATER QUALITY SAMPLING11. Install the instrument in its field location.The following steps should be followed in downloading the Level Troll 500 <strong>Water</strong> Level Logger:1. Connect logger to computer as described above;2. Start Win-Situ software; and3. Select the log and press the “Download” button.Similarly to the Global <strong>Water</strong> WL15, the Level Troll cable contains a vent tube that automaticallycorrects <strong>for</strong> barometric pressure changes. This vent tube must not be kinked or obstructed, orerroneous data will result. Additionally, the data logger is water resistant, not waterproof. It shouldnot be submerged and should be protected from condensation and rainfall.REVISED SEPTEMBER 2012 105
STANDARD OPERATING PROCEDURES FOR SURFACE WATER QUALITY SAMPLINGCHAPTER 7STREAM ECOSYSTEM MONITORINGThis chapter covers how to collect macroinvertebrates, diatoms and habitat data using the StreamEcosystem Monitoring (SEM) <strong>for</strong>m. SEM data is typically collected during the spring.7.1 SAMPLING ORDERThe following section provides a general outline to efficiently collect chemistry, macroinvertebrateand habitat data at a particular site with a two person team. Person one is identified in blue.Person two is identified in grey. Each task is listed in the circle corresponding to each person'scolor.The in<strong>for</strong>mation contained in this section is meant tosummarize the order of data collection in the field from thechapters that follow. The original procedures from thismanual should be consulted to verify that the summaryin<strong>for</strong>mation will meet your needs.1. Lay out reach. The reach length should equal 40 times thewetted width. The minimum reach is 300 feet. This personneeds the tape measure, flagging and a knowledge of theirpace. Record Paces of riffles, pools, runs on the SEM <strong>for</strong>m.Mark the 3 good riffles.2. Take field chemistry measurements w/ multimeter.3. Collect (2) 1 liter bottles, (3) 500 mL bottles, 1 Colilertbottle, 1 turbidity, (and any other QC or additionalparameters). Use DH-81 / churn splitter if depth > 1 foot,velocity > 1 ft/s, or grab sample not appropriate.Top of reachFlow2,31Bottom of ReachFlow4. Take discharge measurements.Measure wetted width. Divide by20. Minimum width separation 0.3ft (<strong>for</strong> small streams). For depths >2.5 ft use 2 point method (average0.2 and 0.8 rather than 0.6 depth).5. Record discharge. Take photos (up,down, sides). Work ahead on thefield <strong>for</strong>ms.45REVISED SEPTEMBER 2012 106
STANDARD OPERATING PROCEDURES FOR SURFACE WATER QUALITY SAMPLING6. Collect bugs in 3 good riffle habitats. Do 1 minute kicksover a 1 square meter area and place bugs in bucket at eachriffle. For cold water streams, do transect pebble counts andembeddedness at 3 good riffles (33 pebbles per transect).Take densiometer readings.Riffle 37. Record and fill out remainder of sheets including site sketch.89Riffle 2Riffle 2Riffle 38. Do the reach wide pebblecount. Goal is 100 reach widefairly evenly spaced. Do %algae and macrophyte coverwith the reachwide pebblecount.Record and fill out remainderof sheets including site sketch.9. Fill out proper functioningcondition, habitat score andPfankuch stability evaluation.Riffle 167Riffle 17.2 COLLECTING MACROINVERTEBRATESMacroinvertebrate sampling is conducted to assess the biological integrity of perennial, wadeablestreams. ADEQ has developed bioassessment tools in the <strong>for</strong>m of Indexes of Biological Integrity(IBI) along with habitat evaluations <strong>for</strong> this purpose. There are two IBIs, the Warm water IBI andCold water IBI. The procedure <strong>for</strong> calculating the IBIs is found in the Biocriteria Implementation<strong>Procedures</strong> (2011).7.2.1 SITE SELECTIONThe study reach length should be one of the following:1. 40 times the wetted width of the stream. The minimum reach length is 300 feet. Themaximum reach length is 3,000 feet.For a definition of bankfull, see Section 7.4.3. The study reach should be selected to representtypical habitat conditions found in the larger stream segment. The study reach length shouldbegin at the top of a riffle or run and end at the bottom of a riffle or run.REVISED SEPTEMBER 2012 107
STANDARD OPERATING PROCEDURES FOR SURFACE WATER QUALITY SAMPLING7.2.2 REFERENCE SITE SELECTIONIf the reach is to be used as a reference or background reach, the following general criteria must bemet: The site must be accessible within a 2-hour walk or 3-4 miles from the nearest four wheeldrive road No known discharges upstream No major impoundments upstream No human caused channel alterations at the site; e.g. diversions, dredge and fill projectsAt least 0.5 miles downstream of road crossingsThe site should be perennial. The indicators <strong>for</strong> perennial condition are likely to be thepresence of fish, univoltine insects (i.e. one generation per year), and healthy unstressedriparian plants The site should be free of local land use impacts There should be no recorded violations of pH or dissolved oxygen water quality standards The Habitat Assessment Index score should be greater than 147.2.3 WHEN TO SAMPLE MACROINVERTEBRATESThe narrative biocriteria standard (A.A.C. R18-11-108.01) applys to wadeable, perennial streamswith either an aquatic and wildlife cold or warm designated use. The following samplingconditions and time frames must be met in order to collect macroinvertebrates <strong>for</strong> ADEQbioassessment purposes. A stream reach must be: Wadeable. Wadeable means no deeper than can be safely waded across when collectingsamples. Perennial. Perennial refers to stream segments which flow continuously throughout theyear (excluding effluent dependent waterbodies). Contain fast-flowing riffle or run habitat. Riffle habitat refers to the portions of streamswhere moderate velocities and substrate roughness produce moderately turbulentconditions which break the surface tension of the water and may produce whitewater. Runhabitat refers to segments of streams where there is moderate velocity water, but nonturbulentconditions which do not break the surface tension of the water and do notproduce whitewater (Bain and Stevenson, eds.1999). Sampled during the spring index period (April-May <strong>for</strong> warm water streams (5,000 ft)). The spring index period is defined as aperiod of time following winter runoff in which baseflow conditions will be found in moststreams. Baseflow conditions generally are achieved post winter runoff in the desertstreams in April-May and in mountain streams in May-June. A period of 4 weeks postbankfullflood condition is generally required prior to macroinvertebrate sampling, evenduring the spring index sampling period. Hydrologic conditions are checked in the officeprior to a site visit and field conditions are documented on the SEM Field Form <strong>for</strong>Macroinvertebrate Sample Collection in the field prior to sampling to confirm thatsampling is occurring during the correct sample collection conditions.REVISED SEPTEMBER 2012 108
STANDARD OPERATING PROCEDURES FOR SURFACE WATER QUALITY SAMPLINGMacroinvertebrate samples are not collected when the following conditions occur: A bankfull or greater magnitude flowevent has occurred within 4 weeks of sitevisit or when extreme high flow eventshave occurred, resulting in deep scouringof the streambed and benthic communitysuch that the macroinvertebratecommunity will not recover within thespring index period. A 10 year or greater flood event hasoccurred within 6 months of thesampling event. Extended drought conditions havereduced flow from previously perennialcondition to pools only or stagnantwetland habitat Stream substrates that are dominated(consisting of >50% of that substratetype) by bedrock, or travertine areconsidered non-target conditions.Macroinvertebrate samples should becollected be<strong>for</strong>e pebble counts andbe<strong>for</strong>e any disturbance to the stream FIGURE 7.1 D-frame net with 500 micron meshchannel by investigators. Thenet.collection begins at the downstream end of the assessment reach and proceedsupstream.A macroinvertebrate sample consists of a three-minute timed composite sample from kick samplescollected from three riffle habitats within the study reach. The target sampling area isapproximately one square meter per each one minute sample. Select three or more riffles whichrepresent the variety of substrate sizes, velocities, depths, and habitats found within the reach.Collect one-minute timed samples from each of three habitats or divide the time as needed amongthe variety of habitats. If three good-sized riffles are not available to be sampled, spread the threeminute sample time over whatever riffle/run areas are available.7.2.4 HOW TO SAMPLE MACROINVERTEBRATESOnce the sampling sites within the reach have been selected, the first sample should be at thelowermost riffle.1. Fill a bucket half full with stream water.2. Place the D-frame (FIGURE 7.1) net on the stream bed in the path of flowing water, andagitate a one square meter area of substrate vigorously <strong>for</strong> one minute by kicking or handREVISED SEPTEMBER 2012 109
STANDARD OPERATING PROCEDURES FOR SURFACE WATER QUALITY SAMPLINGturning rocks to collect dislodged material. Sample as much variation of the flow andsubstrate as possible including large and small substrates.3. Deposit the contents of the net into the bucket. At this point there is no need to pick thenet clean.4. Repeat the sampling procedure <strong>for</strong> thesecond and third riffles. After the last riffle,rinse as many invertebrates into the bucketas possible. Use <strong>for</strong>ceps to removeorganisms attached to the D-frame net.Be<strong>for</strong>e leaving the site, the D-frame dip net,bucket, and sieve should be rinsed andscrubbed to dislodge small invertebrates, eggmasses, and organic material, so that it isnot transferred to the next site.5. Swirl the contents of the bucket and pourthe non-sediment portion into a 500 μmmesh sieve.6. Add water again to the bucket, swirl andpour the contents into the sieve. Repeatthis procedure several times until all insectsand organic debris are emptied and onlysediment remains.7. Dump the remaining sediment into adissecting tray and search the sediment <strong>for</strong>any remaining organisms, especially casedTrichoptera, snails, and freshwater clamsand then discard the remaining sediment.FIGURE 7.2. Macroinvertebrate sampling.8. Gently, squeeze the sample to remove excess water from algae laden samples. Using aplastic spoon or hands, gently dispense the sample from the sieve into a wide mouth, onelitersample jar. Fill the jar half to three-quarters full. If additional sample remains in thesieve, use an extra jar to contain it. Rinse any leftover material in the sieve into a cornerand spoon out as much as possible. Check the sieve <strong>for</strong> any remaining animals. If theentire sample does not fit into one jar, then add the remainder to a second jar. If thesample will not fit into two jars, then field split the sample.A field split consists of dividing the collected material in half. Half of the material isreturned to the stream. Half is placed in the collection jar(s). Be sure to mark thefield split check box in the "Biological <strong>Sampling</strong>" part of the <strong>for</strong>m. To per<strong>for</strong>m a onehalffield split, evenly spread the entire sample in a white dissecting tray and divide thesample with your hands into two equal portions. Place one half of the sample into thetwo sample jars and discard the other half into the stream. Note on the field <strong>for</strong>m thatthe sample was “field split 1/2 or 50%”. A quarter split can be per<strong>for</strong>med if a half-splitstill provides too much sample material to fit in two jars.REVISED SEPTEMBER 2012 110
STANDARD OPERATING PROCEDURES FOR SURFACE WATER QUALITY SAMPLINGThe total time spent kicking should total 3 minutes <strong>for</strong> a 3 square meter area. Morethan three riffles can be used, but it is important to be consistent with sampling timeand sampling area. Use a stop watch to keep track of time.9. Place label(s) (see Section 7.2.5) in the jar(s); add enough 99% isopropyl alcohol to coverthe sample material by about 1 inch.10. Seal and label the jar(s).7.2.5 DUPLICATE SAMPLESDuplicate macroinvertebrate samples should be collected <strong>for</strong> ten percent of the total number ofsamples. To collect a duplicate repeat the procedure described in Section 7.2.4 near the rifflelocation you kicked <strong>for</strong> the regular sample. Do not kick the same area twice. Collect the secondmacroinvertebrate sample in a separate bucket; Use two buckets to save time.7.2.6 MACROINVERTEBRATE SAMPLE LABELINGEach macroinvertebrate sample should have two identification labels. One should be taped on theoutside of the bottle while the other one should be penciled on “write-in-the-rain” paper: insidethe jar, visible from the outside. If more than one jar is used <strong>for</strong> a sample, putjar numbers on all labels (e.g., 1 of 2, 2 of 2). Each tag should have the followingin<strong>for</strong>mation at a minimum (FIGURE 7.3).CLGLR010.53Lower Gila Rivernear Dome143004/24/08RiffleADEQDM / LLStream nameSite code numberHabitat sampled (riffle)Date and TimeADEQ and collectors' initialsQuality control samples should be identified with a unique identifiersuch as (Prescott Run #2). Leave the date and time blank. Be sure tocross reference the unique identifier on the field <strong>for</strong>m so that the datacan be compared when the results come in.7.2.7 STORAGEAfter samples have been preserved with 99% isopropyl alcohol, samplesshould be placed in an ice chest with ice to cool the sample. Thisprevents overheating and degradation of the sample, and preventsfumes from developing inside truck camper shells. Samples should bestored in a cool environment and within flammable storage areas in thelaboratory prior to shipping to the receiving laboratory (FIGURE 7.3).FIGURE 7.3. Flammablestorage.7.2.8 CHAIN OF CUSTODYTo complete the Chain of Custody, samples shall be locked in field trucks when samplingpersonnel are away from the truck. Sample jars shall be placed in the large, flammable cabinet inREVISED SEPTEMBER 2012 111
STANDARD OPERATING PROCEDURES FOR SURFACE WATER QUALITY SAMPLINGthe equipment storage area of the ADEQ laboratory <strong>for</strong> storage, prior to shipping. The use oftamper-evident tape on shipping boxes to prevent tampering with samples during shipping isrequired. A Chain of Custody <strong>for</strong>m will accompany the samples during shipment.7.3 DIATOM COLLECTIONDiatom samples are collected from riffle or run habitats of small to medium sized wadeableperennial streams during the spring index period; April-May <strong>for</strong> warm water streams and May-June<strong>for</strong> cold water streams.The sample is collected from rocks having a flat and somewhat smooth surface. Care must betaken to not disturb the substrate in the area where the sample is to be taken; thus, the sampleshould be collected after the water sample, but prior to the pebble count and the macroinvertebratesample. A single sample consists of a 6 cobble composite collection from a variety ofriffle/run habitats throughout the study reach. The number of days past the last precipitation orflood event should be documented. Samples should not be taken within 4 weeks of a scouringflood event.7.3.1 SAMPLE COLLECTION AND FIELD PROCESSING1. Select 3 riffles in the assessment reach. From each riffle, select two relatively flat cobbleswhich have an obvious biofilm, <strong>for</strong> a total of six rocks. If there are fewer than 3 riffles inthe reach, randomly select six rocks from the available riffle(s). The selected rocks shouldbe in water of less than 1 meter (3 feet) deep. Begin sample collection at the bottom of thereach and move upstream. Try to avoid dislodging substrate when stepping onto riffles.2. Outline a nine centimeter square area on each rock with the template and Exacto knife.Scrape the outlined area with 30 strokes of an Exacto knife. Make single direction strokesin one direction. Put the scrapings from the knife blade into the sample jar. Rotate therock 90 and again scrape with 30 strokes in the same direction. Repeat until the rock hasbeen scraped perpendicular to each side of the sample area. Rinse the scraped area of therock into the sample jar with a squeeze bottle of water. Rinse the knife in the sample jar.Scrub the scraped area of the rock with a toothbrush <strong>for</strong> 10-15 seconds and rinse thescraped area again with water from the squeeze bottle. Rinse the toothbrush in the samplejar with water from the squeeze bottle. Use a new toothbrush and blade at each site.3. Repeat the above process <strong>for</strong> each of the remaining 5 rocks. Composite all rock scrapingsinto the sample jar.7.3.2 LABELINGUse the same labeling procedure as Section 7.2.6.7.3.3 PRESERVATION AND STORAGE1. Preserve the sample with about 10 ml of isopropanol and place in an ice chest with ice toprevent degradation of the sample while in the field. Care must be taken to not entirelysubmerge the collection jar in ice water.2. Store the samples in a dark place until shipment to the contract laboratory.REVISED SEPTEMBER 2012 112
STANDARD OPERATING PROCEDURES FOR SURFACE WATER QUALITY SAMPLING7.3.4 CHAIN OF CUSTODY1. Samples shall be locked in field trucks while sampling personnel are in the field.2. Sample jars shall be placed in the large, locked flammable proof cabinet in the equipmentstorage area of the ADEQ laboratory <strong>for</strong> storage, prior to delivery.3. A chain-of-custody <strong>for</strong>m will be submitted with the samples at the time of delivery ofsamples to the laboratory.7.4 HABITAT ASSESSMENTSThe habitat assessment provides ecological in<strong>for</strong>mation needed to interpret macroinvertebratebioassessments. Habitat and chemistry data provide an ecological context in which to place themacroinvertebrate data. Causes and sources of biological impairment can be explained by thechemical, physical, biological and land use in<strong>for</strong>mation produced in the habitat assessment.Filling out habitat <strong>for</strong>ms requires a little bit of homework. The flow regime, the flowregime category, and the fields listed under the stream type identification should befilled out be<strong>for</strong>e going into the field. <strong>Water</strong>shed area, predicted cross-sectional area,valley type, slope and sinuosity should be determined be<strong>for</strong>e going into the field sothat the "Stream Type" can be determined.The following sections follow the Stream Ecosystem Monitoring <strong>for</strong>m. The firstseveral pages of the <strong>for</strong>m match with what is normally done <strong>for</strong> ambient streammonitoring during ‘chemistry only’ visits, which occur during the summer, fall andwinter quarters. Additional in<strong>for</strong>mation <strong>for</strong> these sections can be found in theprevious chapters.7.4.1 STREAM TYPE IDENTIFICATIONDetermining the stream type requires slope, valley type, watershed area, predicted cross-sectionalarea, sinuosity and stream order. Slope and sinuosity are used directly in determining the streamtype (FIGURE 7.10). The other fields are used to make sure that the stream type you came upwith is correct.The watershed area can be determined by using GIS or using the value in the water qualitydatabase. See Appendix C to calculate watershed area using GIS. Use FIGURE 7.5 to determinethe cross-section area based on the size of the watershed. Indicate which regional curve is used(FIGURE 7.4).FIGURE 7.4. SEM Form. Stream Type Identification.REVISED SEPTEMBER 2012 113
STANDARD OPERATING PROCEDURES FOR SURFACE WATER QUALITY SAMPLING1,000Cross-section Area (ft 2 )1001010 1 10 100 1,000 10,000<strong>Water</strong>shed Area (mi 2 )Middle Gila, Salt River (lower), Santa Cruz, Verde, San PedroUpper Gila, Little Colorado, Salt River (upper)FIGURE 7.5. Cross-sectional area based on watershed size (Moody et al., 2003).7.4.2 REACH LENGTH AND COMPLEXITY7.4.2.1 Reach LengthDetermine reach length by:1. Take at least three representative stream width measurements.2. Average the stream width measurements.3. Multiply the average stream width by 40 to get the total reach length.FIGURE 7.6. SEM For. Reach length.7.4.2.2 Reach ComplexityPace off the reach and note the length of the pools, riffle and run habitats.To determine how many feet are in your specific pace, lay out at least 100 feet of tapeand count the number of paces it takes you to walk 100 feet. 100 divided by thenumber of paces equals the number of feet in your pace.REVISED SEPTEMBER 2012 114
STANDARD OPERATING PROCEDURES FOR SURFACE WATER QUALITY SAMPLINGFIGURE 7.7. Reach complexity.7.4.3 MEASUREMENTS FOR DETERMINING STREAM TYPERosgen (1994) developed a stream type classification system which allows <strong>for</strong> comparisons ofreference and study reaches and provides a basic understanding of channel processes. The streamtype must be identified prior to collecting other measurements <strong>for</strong> the stream stability assessment,such as depositional pattern, Pfankuch channel stability rating and stream type evolutionaryscenario.If bank-pins and cross-sections have already been done <strong>for</strong> you site then take themeasurements at the same location. Check the site file <strong>for</strong> this in<strong>for</strong>mation.FIGURE 7.8. SEM Form. Measurements <strong>for</strong> Determining Stream TypeThe following in<strong>for</strong>mation is needed to determine Stream Type:REVISED SEPTEMBER 2012 115
STANDARD OPERATING PROCEDURES FOR SURFACE WATER QUALITY SAMPLINGEntrenchment ratio (floodprone width/bankfull width) (determined in the field). Forlarger streams it is better to determine floodprone width in the office.Bankfull width/bankfull mean depth ratio (determined in the field)Sinuosity. Use FIGURE 7.9 to estimate sinuosity (determined at the office) or calculateusing a simple ratio of stream distance between two points which are 2 meander lengthsapart, to straight line distance between those two points, as measured in GIS or on a topomap.Sinuosity = 1.1Sinuosity = 1.3Sinuosity = 1.5Sinuosity = 1.7FIGURE 7.9. Classes of sinuosity of a stream channel. Reach slope. Percent slope = [Change in Elevation (ft)/ Distance of Reach (ft)] *100(determined at the office) Channel bed material, median particle diameter (D50) (determined in the field)The following sections will explain how to calculate each of these metrics and explain how todetermine stream type. Fill in the values in the "Stream Type Measurements” on the SEM <strong>for</strong>m.After completing this section you will be able to use FIGURE 7.10 to determine the stream typeand FIGURE 7.5 to determine how close the stream reach is with respect to the regional curve.REVISED SEPTEMBER 2012 116
STANDARD OPERATING PROCEDURES FOR SURFACE WATER QUALITY SAMPLINGSingle Thread ChannelMultiple ChannelsEntrenchmentRatioEntrenched(Ratio < 1.4)ModeratelyEntrenched 1.4-2.1Slightly Entrenched(Ratio > 2.2)Width / DepthRatioLow (< 12)Moderate toHigh (>12)Moderate to High(>12)Very Low(< 12)Moderate to High(>12)Very High (>40)HighVariableSinuosityLow (< 1.2)Moderate(>1.2)Moderate(>1.2)Moderate(>1.2)High(> 1.5)Moderate to High(>1.2)Very LowHighVariableStream TypeA G F B E C DDASlope> 0.100.04-0.0990.02-0.039
STANDARD OPERATING PROCEDURES FOR SURFACE WATER QUALITY SAMPLING7.4.3.1 Determining Bankfull WidthRosgen’s classification system <strong>for</strong> identifying different channel types is based on a common frameof reference among all streams; the bankfull elevation.The bankfull stage is the elevation at which incipient flooding occurs; that is the pointat which stream flow overtops the natural channel banks and spreads across thefloodplain.Evidence from a large number of rivers suggests that these flows are frequent, moderate sized flowswith a typical return interval of 1-2 years and that they represent the channel <strong>for</strong>ming ormaintenance flows. Similar return intervals were empirically identified <strong>for</strong> Arizona streams, wherethe range of return intervals <strong>for</strong> over 30 gauged stations was determined to be 1.1 – 1.8 years(Moody and Odem, 1999).The bankfull discharge is also equivalent to the “effective discharge”; the flow which transports thegreatest volume of sediment over time. Though very high flows can move significant amounts ofmaterial, they occur infrequently and there<strong>for</strong>e transport only a small fraction of the totalsediment volume over time. However, frequent moderate flood events typically carry the greatestamount of sediment; thus the bankfull flow is the most common channel shaping flow. Thebankfull elevation must be consistently identified in the field in order to correctly identify thestream type. The stream type depends on measurements of bankfull width/depth ratio andentrenchment ratio which are dependant upon measurements of the bankfull stage.Field Procedure <strong>for</strong> Identifying Bankfull without a Laser Level1. Walk a stream reach of a minimum of two meander lengths to be assessed looking <strong>for</strong>bankfull indicators, such as:o topographic breaks in slopeo tops of point barso changes in vegetationo changes in size of bank or bar materialso evidence of an inundation feature such as small bencheso the presence of a floodplaino exposed root hairs below an intact soil layer indicating exposure to erosive flowo bank undercuts.Vegetation is usually not a good bankfull indicator and must be used with caution. Athigh elevations, an ash tree or willow tree line may at times be useful; however, a grassor seep willow line at any elevation is not.REVISED SEPTEMBER 2012
STANDARD OPERATING PROCEDURES FOR SURFACE WATER QUALITY SAMPLINGFIGURE 7.11. Left: Bankfull identified by tape measurer at slope break. Right: Multiple bankfull indicators(change in particle size, top of point bar, slope break).2. Place stake flags, pieces of flagging, or other marking devices on the identified points alongthe reach where bankfull indicators are present. If bankfull stage has been properlyidentified, the stake flags should delineate a line identifying bankfull depth.3. Stretch the tape measure across the stream channel using at a riffle where the bankfullindicators are good. Make sure the tape is level. Avoid taking bankfull widths onmeanders.4. Repeat steps 2 and 3 at a second riffle.7.4.3.2 Bankfull Maximum Depth1. Measure the distance from the bottom of the stream (in the thalweg) to the top of the tapeusing a stadia rod (FIGURE 7.12).Measuring Tape at BankfullMeasuringBankfull DepthFIGURE 7.12. Measuring bankfull depth.7.4.3.3 Correction FactorsCorrection factors can vary from about 0.4 to 0.8 depending on the shape of the stream's crosssection.TABLE 7.1 provides common cross-sections and their corresponding correction factors.0.6 is the average coefficient <strong>for</strong> all streams.REVISED SEPTEMBER 2012 119
STANDARD OPERATING PROCEDURES FOR SURFACE WATER QUALITY SAMPLINGType Cross-section Correction FactorTriangular 0.5Skewed 0.5Bimodal 0.5Multi-modal 0.35Basin shaped 0.67Nearly rectangular 0.75TABLE 7.1. Correction factors based on cross-section type (Lawson, unpublished data, 2008).7.4.3.4 Field Bankfull Mean DepthMean depth is calculated by multiplying the bankfull maximum depth by the appropriatecoefficient in TABLE 7.1.7.4.3.5 Cross-Sectional AreaMultiply "mean depth" times average "bankfull width" to obtain the cross-sectional area.REVISED SEPTEMBER 2012 120
STANDARD OPERATING PROCEDURES FOR SURFACE WATER QUALITY SAMPLING7.4.3.6 Floodprone widthThe flood prone width is located at an elevation that is 2 times the maximum bankfull depth. Youmay need to estimate the distance <strong>for</strong> larger systems.Floodprone Width2 Times Bankfull DepthMeasuring Tape at BankfullBankfull DepthFIGURE 7.13. Floodprone is represented by the green dotted line and the width of the channel at 2 timesbankfull depth.7.4.3.7 Determining Stream Type1. Compare the field calculated cross-sectional value against the appropriate regional curvevalue. The field value should be similar or close to the predicted value. If the field value isvery dissimilar from the predicted value then reexamine the measurements and bankfullidentification. Typical explanations are an incorrect bankfull depth, a water diversion, oran impoundment in the watershed. If the issue cannot be resolved, use the field observedbankfull indicators to obtain cross-sectional area.2. Use the Rosgen’s classification chart (FIGURE 7.10) is used to identify the stream type.a. Entrenchment Ratio is calculated by dividing floodprone width by bankfull width.b. Bankfull width/depth ratio is calculated by dividing bankfull width by bankfullmean depth.c. Sinuosity can be calculated from a topographical map or aerial photo <strong>for</strong> the studyreach. Sinuosity can also be estimated by using FIGURE 7.9.d. Slope can be calculated from a topographical map <strong>for</strong> the study reach, or ifavailable, a longitudinal profile of the streambed. Slope equals elevation risedivided by elevation run.e. The median particle size (D50) can be determined from the reach pebble countcumulative percent data or from a graph of the cumulative percent by particle sizeclass.3. Determine stream type by using Rosgen’s classification chart (FIGURE 7.10) and the fiveclassification variables.The classification system scheme sorts fluvial streams into broad stream types A through G,representing the following categories:A – HeadwaterB – IntermediateC – Meandering alluvialE – Meandering alluvial with high sinuosity and low w/d ratioREVISED SEPTEMBER 2012 121
STANDARD OPERATING PROCEDURES FOR SURFACE WATER QUALITY SAMPLINGD – BraidedF – EntrenchedG – GullyThese broad categories are further refined by the addition of slope ranges and median particle sizeto produce 41 categories of stream types which are described and photographed in detail inRosgen (1996).7.4.3.8 Determining Valley TypeRosgen delineated eleven valley types and associated them with stream types (TABLE 7.2). ValleyTypes V, VII, X, and XI are unlikely to be found in Arizona and are not listed. For a discussion ofvalley types, see Rosgen (1996), Chapter 4.Valley Type Environment Geomorphic Profile Stream TypeCharacteristicsDominant OtherIRugged Narrow valleysA,GmountainsIILess rugged Narrow valleys B GmountainsIII Broad valleys in IncisedA,B,G,Dmountains upland riverswith alluvialfans atconfluenceIV Gorges,FCcanyons &confinedalluvial valleysVI Faultline valleys B C,FVIIIDevelopedfloodplainsAlluvialterraces andfloodplainsC,EIX Dune plains C,DD,F,GTABLE 7.2. Valley types and their associated stream types (Rosgen, 1996).7.4.4 REACH OBSERVATIONS7.4.4.1 Organic Debris / Channel Blockages in Active ChannelCheck all applicable boxes.REVISED SEPTEMBER 2012 122
STANDARD OPERATING PROCEDURES FOR SURFACE WATER QUALITY SAMPLINGFIGURE 7.14. SEM Form. Organic Debris.7.4.4.2 Reach Habitat QualityNote whether cobble, undercut banks, etc. are absent, rare, common, or abundant in the wettedwidth of the stream channel throughout the reach.Absent = None present at all.Rare = Some present, but not very much.Common = Moderate amount presentAbundant = Dominant throughout reach.FIGURE 7.15. SEM Form. Habitat Quality.7.4.5 DEPOSITIONAL FEATURESFor the depositional features parameter, mark all categories that apply to the stream channelwithin the study reach. Keep in mind that Rosgen A and B type streams are usually withoutdepositional features.REVISED SEPTEMBER 2012 123
STANDARD OPERATING PROCEDURES FOR SURFACE WATER QUALITY SAMPLINGFIGURE 7.16. SEM Form. Depositional Features.A bar is defined as a submerged or exposed ridge-like accumulation of sand, gravel, or otheralluvial material <strong>for</strong>med within an active channel, along the banks, or at the terminus of a streamwhere a decrease in velocity induces deposition. A point bar is found on the inside of meander bends. Diagonal bars <strong>for</strong>m diagonally to a stream channel, and may extend completely across thechannel. Mid-channel bars <strong>for</strong>m in the mid-channel zone and do not extend completely across thechannel. Islands are exposed bars or land segments within the stream channel that are relatively stableand normally surrounded by water. A side bar (or lateral bar) is located at the side of a stream channel, usually associated with theinside of slight curves. Delta bars are <strong>for</strong>med immediately downstream of the confluence of a tributary and the mainstream (Armantrout, 1998).7.4.6 RIPARIAN ASSOCIATIONCheck the applicable box based on the elevation and vegetation type.REVISED SEPTEMBER 2012 124
STANDARD OPERATING PROCEDURES FOR SURFACE WATER QUALITY SAMPLINGFIGURE 7.17. SEM Form. Riparian Association.7.4.7 PEBBLE COUNTSPebble counts measure the range of particle sizes in a wadeable perennial stream. Excess sedimentcan have adverse affects on the habitation, growth and propagation of aquatic life. ADEQ hasadopted a new narrative standard (R18—11-108.02) <strong>for</strong> bottom deposits which is determined bymeasuring "pebbles" in a systematic way to obtain a value <strong>for</strong> percent fine sediment in thestreambed. Implementation procedures <strong>for</strong> bottom deposits have also been developed (ADEQ,2012).The elevation or the applicable designated use of the stream must be known in orderto choose the right pebble count procedure (TABLE 7.3).DesignatedUseElevation Bottom Deposit Criterion (% of finesediment 5000 ft > 30 % Riffle & Reach (Section7.4.7.1 and 7.4.7.2)A&Ww 50 % Reach (Section (7.4.7.2)TABLE 7.3. Pebble count standards and appropriate procedures.The riffle pebble count is collected to identify the percent fines within the riffle habitat in coldwater streams where macroinvertebrate collections are made. In other words, it is a procedure <strong>for</strong>characterizing particle size distributions of riffle habitats of a study reach. The reachwide pebblecount is used to identify the percent fines in all habitats of a warmwater stream, but also to identifythe Rosgen Stream Type in both cold and warmwater streams. The percent fines data is used toevaluate whether a bimodal particle size distribution exists and to determine the amount of finesediment in the substrate, affecting colonization space <strong>for</strong> aquatic life. The data is also used todetermine whether changes in the substrate are occurring over time.REVISED SEPTEMBER 2012 125
STANDARD OPERATING PROCEDURES FOR SURFACE WATER QUALITY SAMPLING7.4.7.1 Riffle Pebble CountThe riffle pebble count is conducted in three riffles and is a modified version of the Wolmanpebble count (Leopold, et al. 1964). The purpose of the riffle pebble count is to calculate percentfines sediment in riffles and evaluate whether a bimodal particle size distribution exists. TheADEQ riffle pebble count consists of measuring particles at equal increments across multipletransects within the wetted width of riffle habitats where the macroinvertebrates were collected.The count objective is 100 particles.Riffle pebble counts are only required <strong>for</strong> coldwater streams (stream > 5,000 feet inelevation.Riffle Pebble Count Procedure1. Establish the study reach (see Section 7.1). Pebble count measurements will be collectedalong three transects/riffles where the macroinvertebrates were collected. Begin work atthe most downstream transect and move in an upstream direction to the midstream andupstream transects.2. Divide the stream width by thirty-three to obtain the increment needed to collect thirtythreeparticles across the transect in a single pass. Do not collect particles closer than 0.3tenths of a foot apart.Sand will feel gritty while silt and clay will feel smooth or slick.If thirty-three particles cannot be collected in one pass along the transect, make asecond or third pass as close as possible to the transect, and work in an upstreamdirection without working the same area.1/41/23/4FIGURE 7.18. Visual representation of stream divided into 1/4, 1/2, and 3/4 segments.REVISED SEPTEMBER 2012 126
STANDARD OPERATING PROCEDURES FOR SURFACE WATER QUALITY SAMPLINGA measuring tape may be used to divide the stream into 33 equal increments. It isquicker and just as representative to visually divide the stream into quarter segments.Pick 8 pebbles from each quarter. The 8 pebbles should be equally spaced and shouldbe at least 4 inches apart.3. Use the tip of your boot or a pointer to take a particle reading. Extend the <strong>for</strong>efinger, andwithout looking down, pick up the first pebble touched, and measure the intermediate axisin millimeters (FIGURE 7.19). The intermediate axis is neither the longer nor shorter ofthe three mutually perpendicular sides. Determine the Size Range from the Field DataSheet and record the tally. For embedded or very heavy rocks, measure them in place bymeasuring the smaller of the two exposed axes.There is a tendency to look down and select a pebble, but this should be avoided or theresults will be biased toward larger particle sizes.4. Discard the measured pebble downstream, move to thenext station, and repeat step 3.5. Continue working across the transect from wetted edge towetted edge of the streambed. After completing the firstthirty-three measurements at this transect, move upstreamto the next transect, and repeat the process.6. Once the count has been completed, and be<strong>for</strong>e leavingthe stream, sum the tallies to ensure that the goal of 100particles have been counted.7. Estimate the embeddedness of all the particles in thetransect and record the percentage on the field <strong>for</strong>m. Inother words, gravel, cobble, and boulder particles aresurrounded by what percentage of fine sediment? Thisvalue will be used in the Habitat Assessment (Section7.4.18). Don't estimate bedrock. Silt and sand particlesare "highly embedded".ABFIGURE 7.19. Axes of pebble. A =Longest Axis (length). B =Intermediate Axis (width). Thickness= Shortest AxisREVISED SEPTEMBER 2012 127
STANDARD OPERATING PROCEDURES FOR SURFACE WATER QUALITY SAMPLINGFIGURE 7.20. SEM Form. Transect/Riffle pebble count <strong>for</strong>m.7.4.7.2 Reachwide Pebble CountA distilled version of the Zigzag Pebble Count Method(Bevenger and King, 1995) is presented below. This count is adirect measure of the median particle size <strong>for</strong> the entire reach.Reachwide Pebble Count Procedure1. Pace off the study reach (see Section 7.1). Stay as closeto the stream as possible. Laying out the reach shouldbe done in conjunction with the "Reach Complexity"section. Flagging should be used to ensure that 100pebbles are sampled evenly throughout the reach.Dividing the reach into quarters or tenths will enablethe samplers to assess if they are on track with theirpebble counts.2. Randomly choose a starting spot by looking at thesecond hand of your watch (TABLE 7.4)FIGURE 7.21. Counting pebbles using theREVISED SEPTEMBER 2012 128
STANDARD OPERATING PROCEDURES FOR SURFACE WATER QUALITY SAMPLINGSeconds<strong>Sampling</strong> Location1 & 6 LEW2 & 7 1/43 & 8 1/24 & 9 3/45 & 0 REWTABLE 7.4. Use the last digit on your watch to randomly choose the beginning point <strong>for</strong> the 5 point method.3. Take the total number of paces (ie. reach length) obtained from step 1 and divide it by 100.This will give you the number of paces that need to be walked <strong>for</strong> each of the 100 pebblesthat will be sampled. For example, if your reach is 350 paces long then you will need tocount a pebble every 3.5 paces. This works best if the recorder paces along side thesampler so that the sampler has a point of reference as they are zigzagging across thestream.4. Begin sampling the reach as diagramed in FIGURE 7.22. Use the tip of your boot or apointer to take a particle reading. Extend the <strong>for</strong>efinger, and without looking down, pickup the first pebble touched, and measure the intermediate axis in millimeters (FIGURE7.19). The intermediate axis is neither the longer nor shorter of the three mutuallyperpendicular sides. Determine the Size Range from the Field Data Sheet and record thetally. For embedded or very heavy rocks, measure them in place by measuring the smallerof the two exposed axes. Discard the measured pebble downstream.Make a visual estimate of what percent of the particle is embedded. Embeddedness is thepercent of a particle surrounded by sand, silt and other small particles. Don't tally bedrocksamples. Place silt and sand into the "high embeddedness" category.5. At the same spot where you measured the pebble, also note the type of plant or algaespecies present <strong>for</strong> each of the 100 pebble count locations. Identify the plant type, usingthe list provided on the field <strong>for</strong>m and the field plant ID guide.6. Record the tally on the field <strong>for</strong>m, in consecutive order (FIGURE 7.25). Make sure towrite values from left to right on each row because the number of runs, <strong>for</strong> calculatingdiversity, is dependent on the number of consecutive sightings of the same plant species.Mark your observations using the assigned code letters <strong>for</strong> each species (A = algae and M =Macrophyte).6.. After marking plant cover observations <strong>for</strong> the 100 stations along the reach length,calculate the percent plant cover. Count the number of macrophyte and algae observations/ 100 to calculate plant cover % as follows:C% = (Np/Nt) x 100Where: C% = cover percentNp = number of plants “points”Nt = total number of points (=100)REVISED SEPTEMBER 2012 129
STANDARD OPERATING PROCEDURES FOR SURFACE WATER QUALITY SAMPLINGThis will give you a measurement of the percent cover of the stream bed by plants.FIGURE 7.22. The reach wide pebble count. The stream is divided into 5 vertical segments and 20 lateralsegments <strong>for</strong> a total pebble count of 100.There is a tendency to look down and select a pebble, but this should be avoided or theresults will be biased toward larger particle sizes.7. Continue working up or down the reach until you reach the stream edge. Be sure tosample the edge twice as you zig zag through the stream (see FIGURE 7.22). This willensure an equal representation of all sampling stations.8. The pebble count tallies must be graphed to determine the D15, D50 (median particlesize), and D84 classes (See Section 9.2, Post-trip procedures).Parts of the reach may not be wadeable due to deep pools or fast flowing water. Youmust still collect a measurement if at all possible. Wade in as close to the specifiedlocation and either measure the size of the particle between your feet, take a visualestimate if you can see the particle, or jab the substrate with a pointer to estimate sizeclass. If you cannot enter the pool, use your pointer to jab a particle at approximately1m from the stream edge and estimate the size class. Flag the number of estimatedparticles on the field <strong>for</strong>m. Be sure to comment on the number of estimated particlesin the EDAS database.7.4.7.2.1 How to Calculate Number of Runs and DiversityAquatic plant diversity is a measure of both species richness and evenness of the speciesdistribution in the study area. Low diversity is an indicator of nutrient stress. Using thealgae/macrophyte observations recorded <strong>for</strong> the percent plant cover estimate (above), calculate theplant diversity using the Sequential Comparison Index (Cairns, et al., 1968).1. Count the number of runs of each plant type present, including algae, macrophytes andfungal growths. Data will be organized by the number of “runs” or consecutive instances ofencountering the same plant in subsequent samples and counted as in this example, whereX, Y, Z, C, A and O are different plant species and the numbers indicate number of runs:XX O X OOOO YY Z A C AAAREVISED SEPTEMBER 2012 130
STANDARD OPERATING PROCEDURES FOR SURFACE WATER QUALITY SAMPLING1 2 3 4 5 6 7 8 92. Calculate the diversity using the following <strong>for</strong>mula, where the number of runs is divided bythe number of samples (total number of plant points observed).DI = (number of runs) / (number of samples)3. This <strong>for</strong>mula will yield a number between zero and one. This number will then becompared to the following table:RatingScorePoor 0 – 0.3Fair 0.3 – 0.6Good 0.6 – 1.0FIGURE 7.23. SEM Form. Reachwide Pebble Count Forms.REVISED SEPTEMBER 2012 131
STANDARD OPERATING PROCEDURES FOR SURFACE WATER QUALITY SAMPLING7.4.8 RIFFLE GEOMETRYPace or measure off the length and width of the 3 riffles where bugs were collected. The width isfrom the wetted edge of one bank to the other. The length is measured from the beginning to theend of a riffle.Pase or measure the riparian width at the same location where the riffle width was taken. Measurefrom the edge of the stream to the upland zone, which is the zone where riparian plants no longermake up 50% of the species. Note if the riparian width was estimated <strong>for</strong> larger river systems.Calculate the length/width ratio by dividing the riffle length by the riffle width.FIGURE 7.24. Riffle geometry.7.4.9 CANOPY DENSITYPercent canopy density is measured with a concave Spherical Densiometer, manufactured byForest Densiometers, Bartlesville, Oklahoma. Densiometers should be modified by placing narrowstrips of black tape at a right angle<strong>for</strong>ming a “V” as shown inFIGURE 7.25. This will provide17 intersect recording points. Themodification improves themeasurement of canopy closure(Platts et al, 1987). To facilitate thereading of the mirror surface in thefield, place black dots at theintersections of all lines with aSharpie.The Spherical Densiometeroptically identifies a series of pointsin the canopy above the samplinglocation. The observer records thenumber of shaded points.FIGURE 7.25. Modified Spherical Densiometer.REVISED FEBRUARY 2010 132
STANDARD OPERATING PROCEDURES FOR SURFACE WATER QUALITY SAMPLINGCanopy Density Procedure1. Canopy density readings are taken at the same transects as the transect pebble counts andriffle bug sample locations (i.e. 3 transects). At each transect, four measurements are taken(FIGURE 7.26);o at right edge of water facing the right bank,o at mid-channel facing upstream,o at mid-channel facing downstream, ando at left edge of water facing the left bank.2. At edge of water while standing in the stream, and facing the stream bank, hold theinstrument level, away from the body, with the "V" pointing toward the observer. Positionthe densitometer twelve inches above the water surface, and twelve inches from the edge ofwater.The observers head reflection should be touching the top of the uppermost grid line.3. Count all line intersecting points and that touch vegetation and record that number on thefield data sheet.4. Repeat at the middle upstream, middle downstream and other edge of water.5. On the SEM <strong>for</strong>m, sum the tallies <strong>for</strong> each column. Each column represents a crosssection.Sum the cross-section tallies and divide by 3 to obtain the mean number of points.6. If the Strahler stream order is less than 5, multiply the mean number of points by 1.5. Ifthe Strahler stream order is greater than or equal to 5 than multiply the mean number ofpoints by 0.75.FIGURE 7.26. Transect and Reachwide Pebble Count Forms.7.4.9.1 Determining Stream OrderStream order can range from a "1" <strong>for</strong> a headwater stream to around a "10" <strong>for</strong> a very large river.The Amazon River is the highest order river on Earth with a Strahler stream order of "12."When two first-order streams come together, they <strong>for</strong>m a second-order stream. When two secondorderstreams come together, they <strong>for</strong>m a third-order stream. Streams of lower order joining aREVISED SEPTEMBER 2012 133
STANDARD OPERATING PROCEDURES FOR SURFACE WATER QUALITY SAMPLINGhigher order stream do not change the order of the higher stream. Thus, if a first-order streamjoins a second-order stream, it remains a second-order stream. It is not until a second-order streamcombines with another second-order stream that it becomes a third-order stream (FIGURE 7.27).A GIS shapefile has been created to make determining stream order easier.1 st Order 2 nd Order 3 rd OrderFIGURE 7.27. Determining Strahler stream order.7.4.10 RIPARIAN SPECIESRiparian zones are vital to the protection of aquatic habitat. Riparian plants have been shown toreduce the amount of pollutants that can enter the stream. Riparian trees, shrubs and herbs arehydrophytic plants that are found between (and sometimes in) the stream and the upland area.The upland area is generally defined as the area that has 50% or fewer of its species as facultativeor obligate species (ACOE, 1988). Use the “ADEQ Guide to Algae and Plants” or associated fieldguides to identify algae and plant in the riparian zone.(Jones, 2011) to identify common plants and algae.Some riparian species identification guides include: Shrubs and Trees of the southwest uplands (Elmore and Janish, 1976) Desert Plants: Riparian <strong>for</strong>est and scrubland community types of Arizona and New Mexico(Szaro, 1989) Trees of Arizona (Little, 1968; Brockman, 1968) Salicaceae: willow family key (Argus, 1995) Willow quick ID guide (ADEQa) Riparian tree quick ID guide (ADEQb)REVISED SEPTEMBER 2012 134
STANDARD OPERATING PROCEDURES FOR SURFACE WATER QUALITY SAMPLINGFIGURE 7.28. SEM Form. Riparian Species and Regeneration Potential of Riparian Trees.7.4.11 BIOLOGICAL OBSERVATIONSThis section seems very similar to the "Site Observations" at the beginning of the field <strong>for</strong>m. Themain difference is that the Biological Observations are taken throughout the reach instead of 10meters up and downstream of the sample point.There are three algae categories. Each question considers a different algae strata. For example, donot include floating algae and algal slime in the ‘filamentous algae covering streambed throughoutthe reach’ (FIGURE 7.29).For the macrophytes, only consider macrophytes in the wetted width of the channel.See Section 7.4.7.2 <strong>for</strong> the percent filamentous algae covering streambed andmacrophyte cover.FIGURE 7.29. Biological Observations.REVISED SEPTEMBER 2012 135
STANDARD OPERATING PROCEDURES FOR SURFACE WATER QUALITY SAMPLING7.4.12 INDICATORS OF EXCESS NUTRIENTSThe following stream nutrient assessment protocol provides an evaluation of multiple fieldobserved ecological indicators of nutrient stress, to support the narrative nutrient standard in theADEQ <strong>Surface</strong> <strong>Water</strong> <strong>Standard</strong>s (AAC 18-11-108). This assessment should be conducted duringthe growing season in the spring. This assessment protocol utilizes biological endpoint indicators,supported by chemical and physical observations to make a weight of evidence assessment ofnutrient enrichment.7.4.12.1 Physical – Depositional Area ConditionsNine measurements will be taken in three depositional areas: deep or shallow pools, backwaters,eddies, or slack edge water areas, including macrophyte beds (don’t use plunge pools).Depositional area conditions are evaluated to look <strong>for</strong> indicators of excess organic matter buildup,decay and anoxia and associated indicators of presence of a thick organic sludge layer overlying bedsediments, a sulfur smell released from sediment, and presence of red bloodworms, an anoxiaindicator.Do not do this method on channel types that don’t have well defined depositionalareas (such as an A type channel).1. Draw the site sketch first and map out the different kinds of depositional areas that arepresent (deep or shallow pools, backwaters, eddies, slackwater edge areas and macrophytebeds). Then select 3 of those locations at which to mark observations. Select locationswhich are representative of the quantity of each type present in the reach.2. Within each depositional area, select three points where observations of decay and anoxiawill be made: one at the deepest part of the pool and two other locations that arerepresentative of the deposits in that habitat.3. Place the ski-pole down in the center of that habitat, then pick up a handful of sediment.Examine it <strong>for</strong> thick black sludge-like organic matter, smell it <strong>for</strong> sulfur content then look<strong>for</strong> bloodworms. Record the scores as follows: absent (0), present but rare (1), andpresent/abundant (2) <strong>for</strong> each indicator in the table on the field <strong>for</strong>m.4. An evaluation of overall pool conditions (good, fair, poor) is made using the followingguidelines. Sum up the total score of the 27 indicator boxes in Figure 7.3.0 and calculatethe percentage of a total of 54 points. Use the following scoring categories.Number of indicatorsCondition≤25% of a possible score of 54 Good condition26-49% Fair condition≥50% Poor conditionREVISED SEPTEMBER 2012 136
STANDARD OPERATING PROCEDURES FOR SURFACE WATER QUALITY SAMPLINGFIGURE 7.30. SEM Form. Depositional area conditions.7.4.12.3 Other indicators of excess nutrientsThere can be many riparian, reach, and landscape level indicators which could be indicators ofnutrient inputs or sources. The following should be noted to document natural and anthropogenicsources or contributors to nutrient enrichment in a stream reach.REVISED SEPTEMBER 2012 137
STANDARD OPERATING PROCEDURES FOR SURFACE WATER QUALITY SAMPLINGFIGURE 7.31. SEM Form. Other indicators of excess nutrients.7.4.13 REGENERATION POTENTIAL OF RIPARIAN TREESObservations of regeneration capacity aid in evaluating the health of the riparian community. Astressed community will exhibit reduced age class diversity, changes in percent cover, loss of speciesdiversity and increased abundance of exotic species. To complete the regeneration potential table,record the presence of the five most common trees in four age classes; mature trees, young trees,saplings, and seedlings. The observations <strong>for</strong> all size classes are taken at 5 feet above the ground.For example, to determine if a tree fits into the mature tree category look at trees throughout thestudy reach at 5 feet high and see if they are greater than 16 inches in diameter. The community isconsidered in best condition if tree species are abundant in three age classes (FIGURE 7.32).FIGURE 7.32. Riparian species and regeneration potential.REVISED SEPTEMBER 2012 138
STANDARD OPERATING PROCEDURES FOR SURFACE WATER QUALITY SAMPLING7.4.14 ESTIMATING RIPARIAN VEGETATION COVEREstimating percent cover of different canopy layers of the riparian community is a semiquantitativemeasure of riparian condition. Record the estimated percent cover of the over storyof riparian trees, the understory of shrubs, ground cover and barren ground within the floodplain.Consider each vegetative layer separately with a score of 0-100 percent <strong>for</strong> each (FIGURES 7.33and 7.34).5% 10%15%20% 30%40%50% 60% 80%FIGURE 7.33. Figure used <strong>for</strong> estimating percent areal cover.FIGURE 7.34. SEM Form. Riparian Vegetation CoverREVISED SEPTEMBER 2012 139
STANDARD OPERATING PROCEDURES FOR SURFACE WATER QUALITY SAMPLING7.4.15 NON-POINT SOURCE OBSERVATIONSSources of potential impairment must be identified as part of the bioassessment process. Sourcesadjacent to the study reach as well as sources within the watershed are identified from visualobservations in the field and from topographic maps or aerial photos.FIGURE 7.35. SEM Form. Non-point Source Codes.REVISED SEPTEMBER 2012 140
STANDARD OPERATING PROCEDURES FOR SURFACE WATER QUALITY SAMPLING7.4.16 PFANKUCH CHANNEL STABILITY EVALUATIONThe Pfankuch Channel Stability Evaluation (Pfankuch, 1975) is an assessment of streamcondition. It is used to qualitatively describe the potential <strong>for</strong> sediment material detachment andchanges in sediment supply due to changes in streamflow and/or changes in watershed condition.The evaluation is segregated into three categories: upper banks, lower banks, and channel bottom.Each category has three to four ratings. The sum of the category ratings is trans<strong>for</strong>med into anadjective rating of stream stability (e.g., Excellent, Good, Fair, and Poor), using Rosgen streamtype.Pfankuch’s original evaluation was designed <strong>for</strong> use in western U.S.A. mountain stream channels,but did not provide <strong>for</strong> the varieties of stream type. Rosgen (1996) incorporated the evaluationinto his river classification system, but dropped the “excellent” rating. After extensive use ofRosgen’s modified version, ADEQ determined that some portions of the evaluation did notadequately evaluate arid land stream channels. There<strong>for</strong>e, ADEQ staff made the appropriatemodifications to the rating categories that evaluate Arizona streams. Under the ”Lower Banks”category, two changes were made; “Bank Rock Content” was deleted and replaced by “<strong>Surface</strong>Protection,” and “Deposition” was deleted. Pfankuch’s entire category of six ratings <strong>for</strong> channel“Bottom” was removed and replaced by three ratings that more accurately describe arid landstream channel bottoms. There<strong>for</strong>e, a correction factor of 1.226 is applied to convert the ADEQscores upward <strong>for</strong> use with the original Pfankuch scoring criteria <strong>for</strong> each stream type shown in thetable following the Pfankuch <strong>for</strong>m.REVISED SEPTEMBER 2012 141
STANDARD OPERATING PROCEDURES FOR SURFACE WATER QUALITY SAMPLINGREVISED SEPTEMBER 2012 142
STANDARD OPERATING PROCEDURES FOR SURFACE WATER QUALITY SAMPLINGFIGURE 7.36. SEM Form. Pfankuch Assessment.REVISED SEPTEMBER 2012 143
STANDARD OPERATING PROCEDURES FOR SURFACE WATER QUALITY SAMPLING7.4.17 PROPER FUNCTIONING CONDITION (PFC) ASSESSMENTProper Functioning Condition (PFC) is a qualitative method <strong>for</strong> assessing the condition ofriparian-wetland areas (Prichard et al, 1993). The term PFC is used to describe both theassessment process, and a defined, on-the-ground condition of a riparian-wetland area.The PFC assessment refers to a consistent approach <strong>for</strong> considering hydrology, vegetation, anderosion/deposition (soils) attributes and processes to assess the condition of riparian-wetland areas.A checklist is used <strong>for</strong> the PFC assessment which synthesizes in<strong>for</strong>mation that is essential <strong>for</strong>determining the overall health of a riparian-wetland system. The on-the-ground condition termedPFC refers to how well the physical processes are functioning. PFC is a state of resiliency that willallow a riparian-wetland area to hold together during high-flow events with a high degree ofreliability. This resiliency allows an area to produce desired values, such as fish habitat, birdhabitat, or <strong>for</strong>age, over a period of time. Riparian-wetland areas that are not functioning properlycannot sustain these values.PFC is a qualitative assessment based on quantitative science. The PFC assessment is intended tobe per<strong>for</strong>med by an interdisciplinary team with local, on-the-ground experience in the kind ofquantitative sampling techniques that support the PFC checklist. These quantitative techniquesare encouraged in conjunction with the PFC assessment <strong>for</strong> individual calibration, where answersare uncertain, or where experience is limited. PFC is also an appropriate starting point <strong>for</strong>determining and prioritizing the type and location of a quantitative inventory or monitoring.The PFC <strong>for</strong>m consists of a set of guidelines <strong>for</strong> filling out the checklist. The guidelines are fromBureau of Land Management training courses and training materials. The guidelines shouldaccompany the checklist into the field and be referred to as the checklist is being filled out by theassessment team.Several of the field data sheet habitat measurements should be used to assist the PFC evaluations,such as depositional features, pebble count, regeneration potential, and Rosgen stream type. If a“No” answer is given <strong>for</strong> any of the PFC items, a remark must be given that describes thecondition. The number of yes and no answers on the checklist are used to summarize the overallcondition into one of six categories: Proper functioning condition, Functional at risk/upwardtrend, Functional at risk/downward trend, Functional at risk/no apparent trend, Non-functional,and Unknown. There is no numeric scoring involved. Best professional judgment is used todetermine the appropriate assessment category.REVISED SEPTEMBER 2012 144
STANDARD OPERATING PROCEDURES FOR SURFACE WATER QUALITY SAMPLINGFIGURE 7.37. SEM Form. Proper Functioning Condition.REVISED SEPTEMBER 2012 145
STANDARD OPERATING PROCEDURES FOR SURFACE WATER QUALITY SAMPLING7.4.18 HABITAT ASSESSMENTThe habitat assessment focuses on stream substrates and bank stability, which are important <strong>for</strong>biotic communities such as macroinvertebrates and fish. It is used in association with themacroinvertebrate index of biological integrity to identify habitat problems as potential stressors.The habitat condition parameters were extracted from USEPA’s visual based habitat assessmentprotocols described in the Rapid Bioassessment Protocols (Barbour et al., 1999) and USEPA’sEnvironmental Monitoring and Assessment Protocols (Lazorchak et al (eds.), 1998).7.4.18.1 Riffle Habitat QualityHabitat quality within riffles is evaluated through a survey of the variety of natural structureswithin the stream reach, such as cobble, large rocks, woody debris, and undercut banks available<strong>for</strong> colonization by macroinvertebrates. A wide variety and abundance of submerged structuresprovides benthic macroinvertebrates with a large number of habitat niches, thus increasingcommunity diversity. As the habitat structure becomes less complex, the variety and abundance ofcover decreases. Habitat loss leads to a decrease in community diversity, and the potential <strong>for</strong>community recovery lessens.Complete the Reach Habitat Quality portion of the SEM Form prior to conducting the habitatscoring. It is best to complete this <strong>for</strong>m as one of the last tasks be<strong>for</strong>e leaving the study area. Walkthe entire reach, identifying the relative abundance of each micro- and macro-habitat. For warmwater streams, give an optimal score if there are 2-3 habitats in the common to abundantcategories; suboptimal if there are 2+ habitats with 1 abundant; marginal if sand is common orabundant with 1 additional habitat; poor if the habitat is dominated by abundant sand withpossible algae or macrophytes present. For cold water streams, give an optimal score if there are 3+habitats in the common to abundant categories; suboptimal if there are 2+ habitats with 1abundant; marginal if there are 2+ habitats that are rare or common; poor if the habitat isdominated by abundant sand with possible algae or macrophytes present.7.4.18.2 Extent of Riffle HabitatIn addition to habitat quality, the quantity of the riffle habitat is an important factor <strong>for</strong> thesupport of healthy biological stream communities. Good riffle habitat covers the width of thestreambed, extends twice the width in riffle length, and is populated with an abundance of cobble.When present, these factors provide abundant habitat <strong>for</strong> maintenance of the macroinvertebratecommunity and support of the aquatic food web. Where cobble substrate is lacking, riffles mayalso be lacking. In streams with excess sediment, the interstitial spaces around the rocks fill withsand which converts the riffle to a sandy run. The lack of habitat in sandy runs preventmacroinvertebrate communities from developing.Complete the Riffle Geometry portion of the field <strong>for</strong>m prior to conducting the habitat scoring.Mark the widths and lengths of three or more riffles in the study reach. Calculate the length towidth ratios <strong>for</strong> each and then calculate the average ratio. Use these data to score the Extent ofRiffle Habitat.REVISED SEPTEMBER 2012 146
STANDARD OPERATING PROCEDURES FOR SURFACE WATER QUALITY SAMPLING7.4.18.3 Embeddedness in RifflesEmbeddedness refers to the extent to which rocks (gravel, cobble, and boulders) and woody debrisare covered or sunken into the silt, sand, or mud in stream riffles. As rocks become moreembedded, the surface area available as habitat <strong>for</strong> macroinvertebrates decrease. Embeddedness isthe result of an infusion of fine sediments from upland and stream bank erosion into streamsubstrates. Embeddedness is one of the primary measures of excess bottom deposits.Note the riffle embeddedness while doing the reachwide pebble count.7.4.18.4 Sediment DepositionThis parameter measures the amount of sediment that has accumulated on the stream bottom andin pools throughout the reach, and <strong>for</strong> large-scale movement of sediment into a stream. Sedimentdeposition may cause the <strong>for</strong>mation of side or mid-channel bars, enlargement of point bars, or mayresult in the filling of riffles and pools. Usually sediment deposition is evident in areas that areobstructed by natural or manmade debris and in areas where stream flow decrease, such as atbends. Large amounts of fine sediment deposition throughout the reach creates a homogenous,unstable, sandy substrate that is unsuitable <strong>for</strong> macroinvertebrate colonization.Field staff should be familiar with Rosgen stream types (Rosgen, 1996) and be able to identify thestream type of the study reach. The stream type is required to evaluate whether excess sediment ispresent <strong>for</strong> that stream type and to determine whether the channel features con<strong>for</strong>m to the model<strong>for</strong> a stream type.7.4.18.5 Bank StabilityThe bank stability parameter evaluates the active bankfull channel and is an indicator of the sourceand amount of sediment contributing to sediment deposition in the stream. Stable, well vegetatedbanks with little erosion will maintain a stable geomorphic profile and adequate cobble habitat.Unstable banks are characterized by steep walls, banks devoid of vegetation, exposed tree roots,and exposed soil. Unstable banks will erode during moderate flows, contributing large amounts ofsediment to the stream bed.Bank stability is evaluated by visual estimation or measurement of the percent of bank erosion <strong>for</strong>each bank. Both bank scores are summed <strong>for</strong> the total bank stability score. A visual estimate ofbank erosion <strong>for</strong> each bank is determined from markings on the site sketch. To measure bankerosion, the length of eroding banks can be paced off or measured with a reel tape, as a percentageof the total bank length.7.4.18.6 Habitat Assessment Index ScoringScores <strong>for</strong> the five habitat parameters are summed <strong>for</strong> either a warm water or cold water habitatindex score. The five in-stream and bank habitat parameters are scored on a scale of 1 to 4, withhigher scores indicating better condition. The habitat scores are summed <strong>for</strong> a total habitat scoreranging from 5-20, with habitat improving with increasing scores. The Habitat Assessment IndexREVISED SEPTEMBER 2012 147
STANDARD OPERATING PROCEDURES FOR SURFACE WATER QUALITY SAMPLINGscore is then categorized as being good, impaired or very impaired; using the 25th percentile ofADEQ reference habitat assessment scores as the criterion. The 25th percentile of referencemethod was selected because it is a conservative scoring criteria and allows <strong>for</strong> the natural varianceamong reference site scores. The scoring criteria are the same <strong>for</strong> both the cold and warm waterHabitat Assessment Indexes.FIGURE 7.38. SEM Form. Habitat Assessment.REVISED SEPTEMBER 2012 148
STANDARD OPERATING PROCEDURES FOR SURFACE WATER QUALITY SAMPLING7.4.19 SITE SKETCHA sketch of the stream reach provides a visual representation of the general habitat available to themacroinvertebrate community. The site sketch demonstrates the relative proportions of macrohabitats,such as riffles, runs, and pools. It should also display micro-habitats such as woodydebris, leaf packs, macrophyte and algae beds, undercut banks, and riparian vegetation. Thesketch can also present potential sources of impairment such as excess sediment in the <strong>for</strong>m of sideand mid-channel bars from cut banks or degraded tributaries. The map should be scaled toinclude the entire study reach, displaying floodplains, terraces, features such as trees, rocks or flooddebris, the stream name, date, direction of stream flow, a north arrow, benchmarks, point bars,abandoned channels, and sample locations <strong>for</strong> water, bugs and pool deposits.Using an aerial photo of the stream reach can speed up your drawing and make yoursketch more accurate.Note where the depositional habitat areas are <strong>for</strong> the nutrient assessment.REVISED SEPTEMBER 2012 149
STANDARD OPERATING PROCEDURES FOR SURFACE WATER QUALITY SAMPLINGFIGURE 7.39. Site Sketch.REVISED SEPTEMBER 2012 150
STANDARD OPERATING PROCEDURES FOR SURFACE WATER QUALITY SAMPLINGCHAPTER 8GEOMORPHOLOGY PROCEDURESA geomorphic assessment of stream channels provides a process-based framework <strong>for</strong>understanding past and present watershed dynamics. A fluvial geomorphic assessment generallyincludes data collection, field investigations, and channel stability assessments (USDA, 1998).Much of ADEQ’s field methodology is based on or derived from the work of Dr. Dave Rosgen, aconsulting hydrologist and author with extensive work and expertise in fluvial geomorphology,with references detailed in Rosgen’s text Applied River Morphology (1996). This chapter detailsthose methods.8.1 STREAM CHANNEL CONDITIONStream channel condition or state is determined from field inspection and measurement of streamchannel characteristics which include: amount, types, and age classes of riparian vegetation,sediment deposition patterns, frequency and amount of debris occurrence, meander patterns,stream size, flow regime, and altered states due to direct disturbance. The depositional pattern isparticularly important as a screening level evaluation of excess sediment conditions. Depositionalpatterns, defined as bar features in alluvial channels, are evaluated and scored <strong>for</strong> purposes of theRosgen channel stability index.8.2 CROSS-SECTION SURVEYSCross section surveys are conducted primarily <strong>for</strong> purposes of identifying Rosgen stream channeltype, to represent riffle and pool habitats present in a reach, and to document bank erosion. Ariffle cross-section survey is required <strong>for</strong> identifying stream channel type. Other cross-sectionsurveys may be needed to conduct a Stream Stability Assessment. The riffle cross-section should belocated where bankfull and floodprone indicators are present. An illustrated guide to fieldsurveying techniques is provided in Harrelson et al (1994). The following is an abbreviated versionof the Harrelson procedure.Equipment Required: Topcon Rotating Laser Level, stadia or telescoping rod, two pieces of rebar,flagging, camera, GPS unit, fiberglass measuring tape, calculator, laptop computer withspreadsheet or RiverMorph software installed, and cross-section field data sheets.8.2.1 CROSS-SECTION SURVEYING PROCEDURE USING THE TOPCON ROTATING LASER LEVEL1. Position the Topcon Rotating Laser Level (FIGURE 8.1) on a promontory near the crosssectionto be measured and, if possible, at an elevation above the floodprone depth. TheTopcon unit should have an unobstructed view of the cross-section.2. The first and last measurement should be made at a monumented benchmark, such asfound at a USGS gauging station. Use the Cross-Section Survey Form (FIGURE 8.2) torecord data. If a monumented benchmark is not available, as will often be the case, youmust create a site benchmark having a relative elevation of 100 feet. "Monumented" refersto a benchmark of known and precise elevation and xy coordinates. We establish sitebenchmarks with relative elevation and unknown xy coordinates. To construct a sitebenchmark, either pound a piece of rebar into the ground or mark a boulder or a rockREVISED SEPTEMBER 2012 151
STANDARD OPERATING PROCEDURES FOR SURFACE WATER QUALITY SAMPLINGoutcropping. The rebar should extend out of the earth approximately two inches. Thesebenchmarks need to be exactly noted on the field sketch with measurements from notablestationary and permanent objects so that they can be found at the next visit. Severalphotographs of the monumented benchmark and the surrounding area, as well as a GPSreading are useful <strong>for</strong> re-locating the benchmark.3. Anchor the measuring tape to the rebar on the left bank, with zero as the starting point atthe rebar pin. Using the left bank as zero allows <strong>for</strong> conventionalsurvey graphing of the cross-section. Run the tape across andperpendicular to the stream channel. Find a place on the opposite(right) bank that is near the same elevation as the first rebar andperpendicular to the direction of flow in the channel. Place asecond piece of rebar here. Pull the tape as taut as possible andanchor the tape to the second in-ground rebar. Ensure that the tapeis not deflected by vegetation along the cross-section. To preventthe tape from whipping in the wind, tie several pieces of flagging tothe tape.FIGURE 8.1. Rotatinglaser level.4. If a USGS or other benchmark is available, shoot its elevation. Use the elevation of thebenchmark above mean sea level as the reference elevation <strong>for</strong> the graphic. If nobenchmark is available, start the cross-section at the constructed site benchmark.5. Shoot the elevation of the constructed site benchmark on the left bank which is thestarting point. The stadia rod should be placed on top of the rebar <strong>for</strong> this measurement.Also collect a measurement at the base of the left bank pin. The station number at thispoint is zero.6. Moving downslope and along the cross-section, record the elevations of all relevant featuresin a field book or <strong>for</strong>m. Relevant features might include changes in slope, edges of water,thalweg, bankfull, floodprone elevation, change in vegetation, etc. The person recordingthe elevations on the field data sheet must provide a description notation <strong>for</strong> eachmeasurement in the comments column <strong>for</strong> each station (e.g., bankfull, LEW, REW,thalweg, top of terrace, bottom of bank). This in<strong>for</strong>mation is very important whenconstructing the cross-section graphic7. At each elevation measurement, record the cross-sectional distance from station 0+00 tothe nearest tenth of a foot. Use a bubble level to ensure that the stadia rod isperpendicular to the earth be<strong>for</strong>e taking the elevation reading.8. Shoot the rebar on the right bank at the top and base of the right bank rebar pin.9. To check the accuracy of the survey, go back to the starting point, either the benchmark orthe site benchmark, and shoot that elevation again. The difference between the originalelevation and the new calculated elevation is the error. Very small errors may result fromrounding and are acceptable. Typically a closure of 0.02 feet is acceptable. Large errorsmay result from mistakes in calculation, so check the arithmetic first. Other errors may bedue to inaccurately reading the rod, or note taking. If the error is too large, the line mustbe resurveyed to locate and correct the error. To estimate the allowable error, use thefollowing equation.REVISED SEPTEMBER 2012 152
STANDARD OPERATING PROCEDURES FOR SURFACE WATER QUALITY SAMPLING0.007TotalDISTANCE10010. Plot the cross-section in the field in a spreadsheet program or RiverMorph software ifpossible. The plotting of the cross-section in the field is a QC measure. Review the plot todetermine if the survey is complete and that the bankfull elevation is reasonable. Resurveynear slope breaks if needed to verify the bankfull elevation or to eliminate possible errorsbe<strong>for</strong>e leaving the site. An example of a completed cross-section diagram is presented inFIGURE 8.3.REVISED SEPTEMBER 2012 153
STANDARD OPERATING PROCEDURES FOR SURFACE WATER QUALITY SAMPLINGFIGURE 8.2. ADEQ Longitudinal Profile and Cross-section survey field <strong>for</strong>m. Only fill in the white areas. Greyareas can be filled in back in the office.REVISED SEPTEMBER 2012 154
STANDARD OPERATING PROCEDURES FOR SURFACE WATER QUALITY SAMPLINGBoneyard Cr at Clabber cityPool XS 9-25-0211.0Elevation (ft)9.07.05.03.0Survey 1Bankfull 1<strong>Water</strong>surfacFloodprone0.0 20.0 40.0 60.0 80.0 100.0 120.0 140.0Station (ft)FIGURE 8.3. Example of Cross-section survey. Point of observation is looking downstream while station 0, 0corresponds to the left bank.8.3 LONGITUDINAL PROFILE PROCEDUREThe procedure described here is an extract of that described in Stream Channel Reference Sites:An Illustrated Guide to Field Technique (Harrelson, et al, 1994). For a detailed description of theprocedure, see that publication.The placement of the laser level and tripod should be planned in advance such that as many pointsalong the channel can be taken without using a turning point. When a turning point is requiredthere is the possibility of introducing error to the measured profile. The profile is best measuredwith two observers; one to operate the rod and one to record the measurements on the field <strong>for</strong>m(FIGURE 8.4). If a total station is used, the recorder also operates the total station.The ideal location <strong>for</strong> measuring a profile is one that has unobstructed views from the laser level tothe extendable rod; a condition that may only exist on meadow streams and channels that havebeen denuded of vegetation. Since unobstructed views along stream channels are rare, a survey ofthe selected reach should be conducted to ascertain the best placement of the laser level, usually ata high point (e.g., high bank or hill), and one that the extendable rod can reach <strong>for</strong> interception ofthe laser beam. Where high points are unavailable or dense vegetation exists, some clearing of treelimbs and brush may be required, but kept to a minimum.The length of the profile reach is usually determined by the need <strong>for</strong> the measurements. At aminimum, the profile should not be less than twenty times the bankfull width or two channelmeander wavelengths. A long profile reach will better represent the slope of the profile andminimize local disturbances in the channel.REVISED SEPTEMBER 2012 155
STANDARD OPERATING PROCEDURES FOR SURFACE WATER QUALITY SAMPLINGIf a benchmark of known elevation is available, then the benchmark is the elevation referencepoint (backsight; BS) from which all feature elevations (<strong>for</strong>esight; FS) are determined. The“…height of instrument (HI) is the elevation of the line of sight projected by the instrument. Itcan be found by adding the backsight rod elevation to the known (or assumed) elevation of thebenchmark or the point on which the backsight was taken” (Harrelson et al, 1994). Wherebenchmarks are available, the elevation of the first feature is the elevation of the reference point.Typically, this is given an elevation of 100 feet. If the laser beam is 4.5 feet above the referenceelevation, the height of instrument is 104.5 feet. All <strong>for</strong>esight rod readings are subtracted from theheight of instrument to obtain feature elevations.As the observers move downstream and move out of range of the laser level or encountervegetation obstructions, a turning point must be made to continue the survey. A turning point(TP) “…is a reliable point upon which a <strong>for</strong>esight is taken to establish elevation. A backsight isthen made to establish a new HI (Height of Instrument) and to continue a line of levels. Theturning point retains the same elevation while the instrument is moved. Set the rod on a turningpoint (the last measured elevation) and record the <strong>for</strong>esight. Move the instrument as the rod staysin place. Make a backsight and record it” (Harrelson et al, 1994). It is critical when employing aturning point to continue a survey that the rod stays in-place at the last measured elevation whilethe laser level is repositioned.The survey begins at the top of the reach where the end of fiberglass tape is anchored and the tapelaid along the path of the thalweg. Measured elevation points, recorded as rod height, aredetermined by channel morphology. The distance from the end of the tape to the measuredfeatures is recorded as stations. When the reel end of the tape has been reached, the tape is againrepositioned along the thalweg <strong>for</strong> the next downstream leg of the survey. This procedure isrepeated until the entire reach has been surveyed. <strong>Water</strong> surface, banks, channel and/or wateredges, and terraces are typically measured at the same stations as the bed features. It is importantthis process not be rushed and that enough time be allocated to complete the entire profile. Careshould be taken to locate, as accurately as possible, the location of a new feature and the maximumdepth of a pool. The latter measurement is especially important if pool facet slopes are to becalculated off the profile.An alternative method of measuring a profile is a “leapfrogging” method where the length of eachfeature is measured separately. This method is best employed with three observers and twoextendable rods. The first observer measures the elevation of point one (e.g., top of pool) andholds one end of the tape. The second observer moves to the second feature point (e.g., maximumpool depth) with the other end of the tape. The elevation of the second point is measured as wellas the distance between the two features. The third observer records the feature callout, length,and rod height measurements. The first observer then moves to the third point (e.g., top of run)bringing the end of the tape to the next feature, where the elevation and feature length ismeasured. The “leapfrogging” continues to the end of the reach. <strong>Water</strong> surface, low banks,bankfull, and terraces are typically measured at the same stations as the features or wherever goodindicators exist along the profile.REVISED SEPTEMBER 2012 156
STANDARD OPERATING PROCEDURES FOR SURFACE WATER QUALITY SAMPLINGFrom the field profile survey <strong>for</strong>m (FIGURE 8.3), elevations of geomorphic features are calculated.Plots of the profile are made with either RiverMorph or Excel software from which geomorphicanalyses are made.8.4 CHANNEL VERTICAL STABILITY ASSESSMENT USING THE BANKHEIGHT RATIOA channel that is entrenched or vertically contained cannot access its floodplain and willexperience bank erosion at bankfull or greater flows. The bank height ratio (BHR) is a measure ofthe degree of incision of the study channel. Bank height ratio is defined as the ratio of the lowbank height divided by the maximum bankfull depth at that cross-section (Rosgen, 2001a). Lowbank height is any substantial bank below bankfull maximum height. The ratio can be calculatedfrom a single riffle or pool cross-section survey. Ideally, a longitudinal profile delineatingnumerous low bank and maximum bankfull heights provides an accurate bank conditionassessment. Use the maximum value of all available BHR data in the study reach <strong>for</strong> the finalscoring criterion as shown in TABLE 8.1. The scoring criterion <strong>for</strong> BHR is used to evaluate therange of conditions from vertically stable to unstable, as per Rosgen (2001).Bank height ratio Stability rating Sediment supply Sediment supply scorecategory1.0 – 1.1 Stable Low 21.11 – 1.3 ModeratelyModerate 5unstable>1.3 Unstable High 10TABLE 8.1. Bank height ratio scoring criteria.8.4.1 BANK HEIGHT RATIO PROCEDURE1. Conduct cross-section surveys at both riffle and pool cross-sections, identifying the lowbank height and bankfull elevations. Then divide the low bank height reading by thebankfull maximum depth at the cross-section to obtain the bank height ratio <strong>for</strong> eachrespective location.2. Conduct a longitudinal profile, incorporating measurements of low bank heights andbankfull elevations. Plot the profile data. Then calculate bank height ratio wherever lowbank height data points were collected, using the bankfull elevation line plotted on thegraph.3. Use Rosgen’s scoring criteria in TABLE 8.1 to determine the stability rating, sedimentsupply category and sediment supply score. The sediment supply score is then used in thefinal 6-parameter stability assessment score.8.5 CHANNEL LATERAL STABILITY USING THE BANK ERODIBILITYHAZARD INDEX AND NEAR BANK STRESS RATIOSBank erosion is congruent with natural river processes; however, lateral migration rates of streamchannels can be accelerated when variables controlling bank erosion processes are altered. TheREVISED SEPTEMBER 2012 157
STANDARD OPERATING PROCEDURES FOR SURFACE WATER QUALITY SAMPLINGBank Erosion Hazard Index (BEHI) provides an estimate of bank stability or stream bank erosionpotential through measurement of eight parameters. Rosgen’s BEHI index (Rosgen, 1996)addresses the ability of stream-banks to resist erosion through measurement of the followingvariables:1. Stream bank height to bankfull height ratio2. Riparian vegetation rooting depth to stream bank height ratio3. Rooting density4. Stream bank angle or slope5. Bank surface protection by debris and vegetation6. Composition of bank materials7. Stratification of bank materials and presence of soil lenses8. Shear stress in the near bank region.The first seven variables are scored according to Rosgen’s BEHI method at riffle and pool crosssections.As a final step, near bank stress (NBS) is calculated. A reach BEHI assessment is thenper<strong>for</strong>med. Additional BEHI /NBS surveys are per<strong>for</strong>med if different bank types are encountered.The number of linear feet in each BEHI category is multiplied by the predicted erosion rate <strong>for</strong>that bank type and summed <strong>for</strong> an estimate of soil loss <strong>for</strong> the whole study reach. A predictedbank erosion rate is obtained by locating the BEHI and NBS categories on a graph of empiricalbank erosion data. Graphs developed by Rosgen integrate the potential <strong>for</strong> bank erosion with thesheer stress directed at the bank by stream flow (Near Bank Stress) to predict an average annualerosion rate. The dominant BEHI and NBS categories determine which sediment supply categoryapplies, as shown in the scoring criteria in TABLE 8.2 (Rosgen, 2001c).Dominant categoriesSediment supply Sediment supplyStability ratingBEHI NBScategoryscoreLow LowLow ModerateStable Low 5Low HighLow ExtremeModerate LowModerately Unstable Moderate 10Moderate ModerateModerate HighModerate ExtremeHigh ModerateHigh HighUnstable High 20High ExtremeExtreme ExtremeTABLE 8.2. Bank Erosion Hazard Index and Near Bank Stress scoring criteria.Required equipment: Laser level, two surveying rods, receiver, bubble levels, and Bank angleindicator/compass.Bank Erosion Hazard Index (BEHI) ProcedureREVISED SEPTEMBER 2012 158
STANDARD OPERATING PROCEDURES FOR SURFACE WATER QUALITY SAMPLINGThis procedure provides a description <strong>for</strong> each parameter in the BEHI as well as <strong>for</strong> the Near BankStress (NBS). The BEHI model uses several physical attributes of a bank to determine BankErosion Potential (BEP). Bankfull stage is used as a common point <strong>for</strong> this characterization.Bankfull stage is used as a common reference point because it is the primary channel-shaping orchannel flow in the Rosgen system and can be identified in the field. The study bank, <strong>for</strong>purposes of the BEHI evaluation, is defined as a three foot (one meter) wide section of bank that isintersected by bankfull stage. Bank Erosion Potential is determined using the following fieldprotocols.1. Total bank height divided by bankfull height (ft/ft). Total bank height is the verticalmeasurement from base of bank to top of bank. All bank height measurements beginwhere the slope of the bank meets the bed. Measure the height of the continuous bankintersected by bankfull stage. If a second bank is set back in a terrace away from thebankfull bank, it is not included in measuring height. Bank height is most accuratelymeasured using a laser level and surveying rod and receiver, as part of a cross-sectionsurvey. Bank height can alternatively be measured with two rods and bubble levels as partof a bank profile, though this method is less accurate. To calculate this metric, total bankheight is divided by the bankfull stage at that bank profile location. Both values plus themetric value must be recorded on the BEHI <strong>for</strong>m.2. Root depth divided by bank height (ft/ft). Root depth is defined as the depth of rootmass providing stability to the bank. Long individual roots are not considered in rootdepth because these are not thought to add significant strength to the bank. On sloping orvegetated banks, overall root depth is generally assumed to be equivalent to the bankheight, but is verified by surficial digging and exposing the roots of the dominantvegetation. Root depth is most accurately measured from the top of bank to the bottomroot depth using a laser level and surveying rod and receiver, as part of a cross-sectionsurvey. Rooting depth can alternatively be measured with two rods and bubble levels aspart of a bank profile. To calculate this metric, rooting depth is divided by the total bankheight at that cross-section. The root depth plus the metric value should be recorded onthe BEHI <strong>for</strong>m.3. Root Density (%). The root density is defined as the ratio of the root mass surface area tothe total bank surface area. Root density on sloping, well-vegetated banks (native grasses,sedges and riparian trees) is typically near 100%. The root density value will be similar tothe surface protection value when banks are well protected by vegetation. In cut bankswith high erosion potential, there may be some root density above the bankfull elevation,but none below it. In such cases, make a weighted estimate of the whole bank root densityby considering both the density in the upper soil layer and also the rooting depth. Scrapeaway the loose soil to expose roots, in order to properly evaluate root density. Make avisual estimate of root density, using rooting depth to assist the evaluation in cut banks.4. Bank Slope (ft/ft). Bank slope or angle is measured in degrees from the horizontal of thestreambed. Bank slope is defined as rise over run from the toe of the bank to the top ofthe continuous bank intersected by bankfull stage. A vertical bank is 90 degrees. Bankslope can be measured with a clinometer, a compass, or a bank angle indicator. It can alsobe calculated from a cross-section graph, using the <strong>for</strong>mula of ∆ rise/∆ run. If there areREVISED SEPTEMBER 2012 159
STANDARD OPERATING PROCEDURES FOR SURFACE WATER QUALITY SAMPLINGtwo distinctly different bank angles on a bank, use the steepest slope to evaluate thisparameter.5. <strong>Surface</strong> Protection (%). <strong>Surface</strong> protection is defined as the percentage of the banksurface protected by vegetation, root wads, large boulders or other resistant materials whichprotects the bank from eroding due to freeze and thaw action. Materials such as car bodiesor uprooted tree trunks, which may contribute to bank erosion by redirecting high velocitytoward the bank are not included as surface protection. <strong>Surface</strong> protection on sloping,well-vegetated banks is generally considered to be near 100%. In alluvial streams, surfaceprotection will be similar to root density values.6. Bank Materials. The BEHI score is adjusted <strong>for</strong> composition of bank materials. Wherebanks are composed of bedrock and boulders, no adjustment is made. Where banks aredominated by cobble, subtract 10 points from the BEHI score. Where cobble banksconsist of a mixture of sand and gravel, no adjustment in BEHI score is made. For graveldominated banks, add 5 points to the BEHI score. For banks dominated by sand, add 10points. For silt/clay dominated banks no adjustment to BEHI score is made.7. Bank Stratification. The BEHI score is adjusted <strong>for</strong> soil stratification layers whichcontribute to bank erosion potential. In a cut bank, unstable layers of sand and gravel,especially at or below the bankfull level, contribute to bank erosion potential. Add 5-10points depending on the number of layers and position of the unstable layers in relation tothe bankfull stage. Typically, five points are added when there is one unstable layer, andten points <strong>for</strong> two or more unstable layers.8. Calculation of BEHI score. Rosgen (1996) developed a 1-10 scoring system <strong>for</strong> each of theseven metrics, with a sum total BEHI score of 5 - 50 (TABLE 8.3). This scoring system isincluded in the specialized BEHI field <strong>for</strong>m (Rosgen, 2001a). The total BEHI scores givethe following rating categories.BEHI Total ScoreBEHI Category5 – 9.5 Very Low10 – 19.5 Low20 – 29.5 Moderate30 – 39.5 High40 – 45 Very High46 - 50 ExtremeTABLE 8.3. Bank Erosion Hazard Index rating categoriesREVISED SEPTEMBER 2012 160
STANDARD OPERATING PROCEDURES FOR SURFACE WATER QUALITY SAMPLINGFIGURE 8.4. Bank erodibility hazard index.8.5.1 NEAR BANK STRESS PROCEDUREThe erosive <strong>for</strong>ce against a bank is actually the shear stress contributed by the stream flow. ShearStress in a stream is defined as the specific weight of water multiplied by the hydraulic radius andwater surface slope. Slope should refer to the water surface at bankfull stage. Hydraulic radius isREVISED SEPTEMBER 2012 161
STANDARD OPERATING PROCEDURES FOR SURFACE WATER QUALITY SAMPLINGdefined as the cross-sectional area divided by the wetted perimeter. Bank erosion potentialincreases directly with increases in the ratio of near bank stress to channel shear stress.There are several methods <strong>for</strong> estimating or calculating near bank stress <strong>for</strong> any given bank in thestudy reach. Rosgen (2003) identified seven methods, associated with Level I through Level IVfield assessment procedures. The Near Bank Stress procedure from the Rosgen suite of methods isgiven below. Near bank stress is characterized by a ratio of the shear stress in the 1/3 of thechannel nearest the eroding bank to the entire cross-sectional shear stress. The followingmeasurements are required to calculate the shear stress ratios:1. Mean depth at a cross-section2. Average water surface slope <strong>for</strong> reach3. <strong>Water</strong> surface slope in near bank region <strong>for</strong> that habitat type (e.g. pool), and4. Nar bank maximum depth.This ratio of near bank to mean channel shear stress is then categorized similarly as the BEHIscores, as very low to extreme, as shown in TABLE 8.4.NBS RatioNBS Category1.6 ExtremeTABLE 8.4. Near Bank Stress rating categories.1. Field Measurements. A cross-section survey is needed to calculate cross-sectional area,wetted perimeter and hydraulic radius at bankfull elevation. A longitudinal profile is alsoneeded to calculate the water surface slope of the reach and the water surface slope in thenear bank region. Average water surface slope is measured along the thalweg of the wholestudy reach, beginning and ending at the top of riffle feature. The water surface slope inthe near bank region is measured at the top and bottom of the bed feature in which thecross-section lies (e.g. Riffle, run or pool habitat feature). Elevation measurements arecollected at the thalweg on the stream bottom and at the water surface at the upstream endof the feature, such as top of pool and also at the downstream end of the feature, below thecross-section. If the stream is dry, take thalweg measurements one bankfull width upstreamand downstream of the cross-section location.2. Calculations. After plotting the cross-section profile, extract the necessary variables tocalculate mean shear stress and near bank stress. Cross-sectional area and mean depth arefirst calculated. Bankfull mean depth is the ratio of bankfull cross-sectional area tobankfull width. Then, hydraulic radius of both the channel and the near bank region iscalculated by dividing cross-sectional area by wetted perimeter (width plus 2 times meandepth). Values <strong>for</strong> the near bank shear stress and average reach shear stress are calculatedby multiplying water surface slope, hydraulic radius, and the weight of water (Rosgen,2001c). The ratio of near bank shear stress to average shear stress is calculated and theREVISED SEPTEMBER 2012 162
STANDARD OPERATING PROCEDURES FOR SURFACE WATER QUALITY SAMPLINGNBS category determined from the ratio indicated in TABLE 8.4. Alternately,measurements can be entered into “RiverMorph” software, which per<strong>for</strong>ms the shear stresscalculations (RiverMorph LLC, 2002).3. Predicted bank erosion. Rosgen (1996) produced two different graphs to integrate theBEHI and NBS scores and categories into a predicted bank erosion rate (FIGURE 8.6).The predicted bank erosion rate (ft/year) is plotted against both the NBS category andBEHI regression line in these graphs. This predicted lateral erosion rate is then multipliedby the bank height and length in the reach <strong>for</strong> a bank soil loss estimate (ft3/year) as shownin the <strong>for</strong>m in FIGURE 8.6. This predicted soil loss estimate is then determined <strong>for</strong> eachbank type in the reach and summed <strong>for</strong> a total soil loss estimate <strong>for</strong> the entire reach(FIGURE 8.8). Moody et al. (2003) determined that the Colorado USFS 1989 graph(FIGURE 8.7) worked best in Arizona <strong>for</strong> predicting bank erosion rates, which wereverified in a BEHI validation study of over 40 sites in the Verde and San Pedro Riverbasins.4. Measured bank erosionActual bank erosion rates are measured with the use of multiple bank pins placed alongeroding banks. Pin lengths protruding from the bank are remeasured after major stormand flow events. One or more bank pins (4’ x 3/8” smooth rebar) are installed horizontallyinto bank material at bankfull elevation or above and below bankfull at each cross-section.Each cross-section represents a different common bank type occurring in the reach. Inaddition, bank pins are placed at upstream and downstream locations from the crosssectionlocation in order to obtain an average bank loss from a minimum of three bankpins in that bank type. The length of the bank pin exposed after each flood event indicatesthe amount of bank material lost at that cross-section. The average bank loss is thenmultiplied by the length of that bank type <strong>for</strong> the total erosion rate (ft3/yr).REVISED SEPTEMBER 2012 163
STANDARD OPERATING PROCEDURES FOR SURFACE WATER QUALITY SAMPLINGFIGURE 8.6. Near Bank Stress (NBS) rating and Bank erosion prediction <strong>for</strong>m by Rosgen (2001a).REVISED SEPTEMBER 2012 164
STANDARD OPERATING PROCEDURES FOR SURFACE WATER QUALITY SAMPLINGFIGURE 8.7. Bank erosion rate prediction graphs by Rosgen (1996).REVISED SEPTEMBER 2012 165
STANDARD OPERATING PROCEDURES FOR SURFACE WATER QUALITY SAMPLINGFIGURE 8.8. Bank erosion calculation.REVISED SEPTEMBER 2012 166
STANDARD OPERATING PROCEDURES FOR SURFACE WATER QUALITY SAMPLING8.6 CHANNEL PATTERNA well developed and appropriate meander pattern is important <strong>for</strong> maintenance of streamchannel stability. Channel pattern measurements include: meander length, belt width, radius ofcurvature, meander width ratio, arc length, arc angle, ratio of radius of curvature to bankfullwidth, ratio of meander length to bankfull width, and sinuosity. These data are determined frommeasurements of stream channel characteristics obtained from ortho-photo quad maps or aerialphotos. Measurements can alternately be collected in the field, but only in locations where thelack of vegetation allows.Channel pattern parameters are important <strong>for</strong> comparison of study sites to reference sites and <strong>for</strong>restoration design; however, they are not scored and used in Rosgen’s channel stability index.When the reference reach data <strong>for</strong> the same valley and stream type differ in watershed size, values<strong>for</strong> channel pattern parameters can be converted to dimensionless ratios by dividing by bankfullwidth. A large departure from meander reference values indicates instability as the stream channelevolves to a more stable <strong>for</strong>m (e.g. lateral instability results from inadequate meander width orsmall radius of curvature ratios). Down-valley meander migration and excessive near-bank stressdue to ratios of radius of curvature/bankfull width values of less than 2.0 indicate channeladjustment due to instability.8.6.1 CHANNEL PATTERN PROCEDURESFIGURE 8.9. Measurements needed to calculate river sinuosity (after Rosgen and Silvey, 1998).1. A narrative description of meander pattern is selected from Rosgen’s (1996) Level III <strong>for</strong>m“Meander Patterns”. Identification of meander pattern is best per<strong>for</strong>med by inspection ofrecent aerial photographs or ortho-photo quads. Topographic maps can also be used butthey typically provide only an historic perspective.REVISED SEPTEMBER 2012 167
STANDARD OPERATING PROCEDURES FOR SURFACE WATER QUALITY SAMPLING2. Sinuosity is defined as the ratio of meandering channel length to straight-line valley lengthand indicates how the stream has adjusted its slope to that of its valley. Sinuosity is bestmeasured from recent aerial photographs or ortho-photo quads. Use a stream length that isat least two meander wavelengths <strong>for</strong> the measurement (FIGURE 8.9). The greatestsinuosity is found in a highly meandering “E” type alluvial channel, whereas the leastsinuosity is common in “A” type high relief, entrenched streams.REVISED SEPTEMBER 2012 168
STANDARD OPERATING PROCEDURES FOR SURFACE WATER QUALITY SAMPLINGFIGURE 8.10. Measurements needed to calculate river meander geometry (Rosgen, 2001).REVISED SEPTEMBER 2012 169
STANDARD OPERATING PROCEDURES FOR SURFACE WATER QUALITY SAMPLING3. Meander wavelength (Lm) is the linear downstream distance of one river meander asshown in FIGURE 8.10. Collect several field measurements or a minimum of threemeasurements from recent aerial photographs or ortho-photo quads. Calculate minimum,maximum and average values <strong>for</strong> ratio of meander wavelength / bankfull width. Distancevalues ranging from 10-14 bankfull widths are common <strong>for</strong> an individual meanderwavelength.4. Meander belt width (Wblt) is the width of a meander from outside bend to outside bend.Collect several measurements or a minimum of three measurements from recent aerialphotographs or ortho-photo quads. Meander width ratios can then be calculated bydividing the belt width / bankfull width. Obtain minimum, maximum and average values.5. The radius of curvature is used to evaluate channel resistance to erosion and meandermigration rates. Collect several field measurements or a minimum of three measurementsfrom recent aerial photographs or ortho-photo quads. Radius of curvature is defined bythe following <strong>for</strong>mula:where: R c = radius of curvature in feetLm = meander length in feetK = sinuosityR cLmK13(K 1)Another technique <strong>for</strong> field measurement is establishing the Chord length/mid-ordinate ratio asshown in FIGURE 8.10. Chord length is the measured distance between two points along theriver meander. To determine the mid-ordinate, locate the mid-point of the chord, then measurethe length of the perpendicular middle ordinate. The <strong>for</strong>mula <strong>for</strong> calculating radius of curvaturefrom these measurements is as follows:1.50.5R cC2 M 8M2where: R c = radius of curvature in feetC = Chord length in feetM = Mid-ordinate distance in feet8.7 CHANNEL DIMENSION RELATIONS USING WIDTH/DEPTH RATIOSThe ratio of the riffle cross-section width/depth of a study reach to the width/depth ratio of areference reach provides a measure of vertical stability. A reference reach is one that is eitherunimpaired or least impaired. A least impaired reach is one that is as close to being unimpaired ascan be found in the area of the study reach. The bankfull width/mean bankfull depth ratio isobtained from riffle cross-section data. Increases in width/depth ratio are often associated withchannel aggradation due to accelerated stream bank erosion, excess sediment deposition andchannel widening, which commonly occur in “C” type alluvial channels. Decreases inwidth/depth ratio can indicate channel incision, as <strong>for</strong> example when a “B” type channel degradesinto a “G” type channel. The width/depth ratio is one of the six variables used and scored <strong>for</strong>REVISED SEPTEMBER 2012 170
STANDARD OPERATING PROCEDURES FOR SURFACE WATER QUALITY SAMPLINGpurposes of the Rosgen channel stability index and the TABLE 8.5 presents scoring criteria <strong>for</strong>evaluating stability using this variable (Rosgen, 2001).Width/depth ratio / Stability rating Sediment supply Sediment supply scoreReference w/d ratiocategory< 1.4 Stable Low 21.4 – 1.7 Moderately unstable Moderate 5> 1.7 Unstable High 10TABLE 8.5. Scoring criteria <strong>for</strong> evaluating channel stability.8.7.1 FIELD AND ANALYTICAL PROCEDURES1. Conduct a cross-section survey at the study reach as indicated in Harrelson et al. (1994),identifying bankfull features.2. Using a spreadsheet program, calculate bankfull cross-sectional area, and divide it bybankfull width to determine bankfull mean depth.3. Calculate width/depth ratio by dividing bankfull width by bankfull mean depth.4. For the reference reach width/depth ratio, use either a local reference site on a similarstream type, the Rosgen guidance provided in FIGURE 8.11, or use regional mean ratiosby channel type (Moody et al., 2003).5. Calculate the ratio of the study reach width/depth ratio to the reference reachwidth/depth ratio and apply stability ratings given in the table above <strong>for</strong> purposes of theRosgen stability index.FIGURE 8.11. Examples of increases and decreases in width/depth ratios to reference condition that indicateimpairment of stream stability (Rosgen, 2001).REVISED SEPTEMBER 2012 171
STANDARD OPERATING PROCEDURES FOR SURFACE WATER QUALITY SAMPLING8.8 STREAM CHANNEL SCOUR AND DEPOSITION POTENTIALAdequate sediment transport is an essential component <strong>for</strong> maintenance of a stable channel. Ifeither the channel depth or slope is less than needed to move the largest particle size of a barsample, then aggradation or excessive deposition and a high width/depth ratio will occur. If thedepth or slope exceeds that required to move the largest particle size, then degradation or excessscour may lead to channel incision. Sediment competence is determined by measuring the abilityof a riffle cross-section to transport the largest particle in motion at bankfull stage. Thoughsediment competence is not one of the 6 variables in Rosgen’s Stability Index, it is an importantmeasure of vertical stability <strong>for</strong> alluvial stream channels, and can be used separately to evaluatechannel stability. Implicit in this procedure is the assumption that bankfull discharge isresponsible <strong>for</strong> transporting the greatest volume of sediment over time; that the bankfull dischargeis the “effective discharge”.8.8.1 SEDIMENT COMPETENCE PROCEDUREField methods require collection of a pebble count from the riffle cross-section, sieve analysis of abar sample collected from a bankfull bar feature or sub-pavement sample, and a longitudinalprofile. The bar sample must be collected from the lower third of a bankfull bar at an elevationhalfway between bankfull stage and the channel thalweg as indicated in FIGURE 8.12 (Rosgen,2001a). The sub-pavement sample should be collected at the head of a riffle on either side or thethalweg. Critical dimensionless shear stress is calculated from the median particle sizes from boththe riffle pebble count and the bar sample, using the following <strong>for</strong>mula as described by Rosgen(2001).ci 0.0834where: τci = critical dimensionless shear stressd i = median diameter of riffle bed material in mm.d 50 = median diameter of bar sample in mm.The Shield’s <strong>for</strong>mula is used to calculate the bankfull mean depth needed to entrain the largestparticle size in the bar sample, utilizing the largest particle size from the bar sample sieve test andthe water surface slope of the study reach. The following <strong>for</strong>mula is used to calculate the requiredbankfull mean depth (Rosgen, 2001). Scores in the following table indicate when a channel is instable, aggrading or degrading condition.rcid id50D *1.65* dwhere: D r = bankfull mean depth in feetτ ci = critical dimensionless shear stressd i = median diameter of riffle bed materialS e = existing water surface slope of study reach0.872iSeSlope evaluation Depth evaluation Stability categoryREVISED SEPTEMBER 2012 172
STANDARD OPERATING PROCEDURES FOR SURFACE WATER QUALITY SAMPLINGSlope evaluation Depth evaluation Stability categorySe/Sr = 1 De/Dr = 1 StableSe/Sr < 1 De/Dr < 1 AggradingSe/Sr > 1 De/Dr > 1 DegradingTABLE 8.6. Determining the stability category based on a slope and depth evaluation.Where:Se = existing water surface slope of study reachSr = bankfull water surface slope requiredDe = existing bankfull mean depth (from riffle cross-section)Dr = bankfull mean depth requiredREVISED SEPTEMBER 2012 173
STANDARD OPERATING PROCEDURES FOR SURFACE WATER QUALITY SAMPLINGFIGURE 8.12. Bar sample procedure (Rosgen, 2001a).REVISED SEPTEMBER 2012 174
STANDARD OPERATING PROCEDURES FOR SURFACE WATER QUALITY SAMPLINGFIGURE 8.13. Sediment transport calculation <strong>for</strong>m provided by Rosgen (2001c).REVISED SEPTEMBER 2012 175
STANDARD OPERATING PROCEDURES FOR SURFACE WATER QUALITY SAMPLING8.9 STREAM TYPE EVOLUTIONARY SCENARIOSNatural channels are dynamic by nature, responding to changes in flows and sediment loads byvertical and lateral adjustments and changes in bed material. Channel type evolution occurs as aresult of vertical or lateral instability created as a stream system exceeds a geomorphic threshold.The <strong>for</strong>mation of gullies, an unstable channel type, followed by a succession of channel typestoward a more stable <strong>for</strong>m is the best known of the channel evolution sequences (TABLE 8.7).Various stream type evolutionary scenarios, which commonly occur in alluvial channels, have beendescribed (Rosgen, 1996) and are used in the Rosgen Stability Index.8.9.1 FIELD PROTOCOLSField protocols consist of per<strong>for</strong>ming a riffle cross-section survey and identifying other channeltypes that may occur within the two meander study reach. The existing stream type(s) occurring inthe study reach are determined from the riffle cross-section data (entrenchment ratio, width/depthratio), sinuosity, slope and median particle size of the bed material using Rosgen’s streamclassification system (Rosgen, 1994). The field observer must select not only the existing streamtype, but also the location in one of the sequences of evolution. The field observer should alsodetermine the potential stable stream type in addition to the existing stream type. This requiresadditional in<strong>for</strong>mation about the valley type. For instance, which stream types are naturallyassociated with that valley type; what other “background” or “reference” stream channel types arecommon in the local area? The table below indicates channel type sequences indicative of low,moderate and high sediment supply or channel stability categories, and the associated RosgenStability Index score (Rosgen, 2001).Evolutionary sequence Stability rating Sediment supply Sediment supply scorecategory(C → E), (Fb → B), (G → Stable Low 5B), (F →Bc)(F → C), (B → G) Moderately Moderate 10Unstable(E or C → G), (E or C → Unstable High 15D) (G → F), (D → G)TABLE 8.7. Evolutionary sequences that estimate sediment supply by stream type.8.9.2 ROSGEN STABILITY ASSESSMENTVariables that describe vertical and lateral stability, excess sediment conditions, a change in streamtype, and overall channel, bank and floodplain condition are included in the Rosgen StabilityIndex <strong>for</strong> a holistic geomorphic stability assessment. The bank height ratio measures verticalstability and the dominant BEHI/NBS category; width/depth ratio measures lateral stability. Thedepositional pattern is an indicator of excess sediment conditions, while the Pfankuch stabilityrating is an assessment of the overall channel, bank and floodplain conditions. Lastly, theevolutionary stage documents instability associated with channel type changes. These six variablesare trans<strong>for</strong>med into qualitative rating and then quantitative ratings of sediment supply, usingguidance from Rosgen (2001). The sediment supply ratings are given in the following tables.REVISED SEPTEMBER 2012 176
STANDARD OPERATING PROCEDURES FOR SURFACE WATER QUALITY SAMPLINGSediment Supply SummarySediment DominantSupply BEHI/NBS(Width/depthratio) /(Referencewidth/ depthratio)BankHeightRatioPfankuchChannelStabilityRatingEvolutionary StageDepositionalPatternLow L/L, L/M < 1.4 1.0 – 1.1 Good (C → E), (Fb → B), 1,4(G → B), (F → Bc)Moderate M/M, M/L, L/H, 1.4 – 1.7 1.11 – 1.3 Fair (F → C), (B → G) 3L/ExHigh M/H, H/M, H/H, > 1.7 > 1.3 Poor (E or C → G), (E or 2,5,6,7,8M/Ex, H/Ex,C → D)Ex/Ex(G → F), (D → G)VariablesStability CategoriesLow Moderate HighDominant BEHI/NBS 5 10 20(Width/depth ratio) / (Reference width/ depth ratio) 2 5 10Bank Height Ratio 2 5 10Pfankuch Channel Stability Rating 5 10 15Evolutionary Stage 5 10 15Depositional Pattern 2 5 10Total Stability Index Score 21 45 80Conversion of stability index score to overall channel stability ratingChannel Stability RatingStability Index ScoreLow (not attaining) 21 – 33Moderate (inconclusive) 34 – 45High (attaining) 46 - 80TABLE 8.8 Rosgen Stability Assessment Variables (Rosgen, 2001).8.10 LINEAR HABITAT COMPLEXITY INDEXThe Linear Habitat Complexity Index (LHCI) identifies the degree of morphological complexitywithin a stream channel. The Index is based on run, riffle, and pool lengths. For the Index, glidesare considered to be runs. It was inferred that reaches of stream channel with extensive runs wereless physically heterogeneous (i.e. lacking complexity and habitat diversity <strong>for</strong> aquatic organisms)than complex channels having short runs frequently intermixed with pools and riffles. Aheterogeneous channel is considered to be indicative of stability.8.10.1 LINEAR HABITAT COMPLEXITY INDEX CALCULATION PROCEDUREThe Index is calculated from feature identification and feature lengths on a longitudinal profile.A run reference norm is determined from a reference reach using the LHCI calculation. Whenapplied to a study reach, the index identifies runs exceeding the reference run norm. The Index isstructured such that as LHCI values increase, habitat complexity trends toward homogeneity; thus,increasing index values indicate lower physical integrity than the reference reach.REVISED SEPTEMBER 2012 177
STANDARD OPERATING PROCEDURES FOR SURFACE WATER QUALITY SAMPLINGThe reference reach mean run length and standard deviation are calculated from the profile data.For the index, a reference run length norm is determined to be the mean run length plus onestandard deviation.The Index is a moving average of ten contiguous features. After the Index is calculated <strong>for</strong> the firstten features, the first feature is dropped and the eleventh feature added <strong>for</strong> the next reachcalculation. This process continues to the end of the profile.Linear Habitat Complexity Index = 1 – ((total length of ten features – the sum of the portions ofruns exceeding reference run norm) / total length of ten features).Plots of the results of the LHCI are composed <strong>for</strong> the reference and study reaches. Significantdepartures of the study reach from the reference reach are determined. Significant departuresindicate that the study reach has less habitat complexity than the reference reach.8.11 POOL FACET SLOPE ANALYSISThe intent of this metric analysis is to quantitatively measure the degree of sedimentation instream channels, especially in “C” and “E” type channels. Pools fill with sediment underconditions of sediment deposition. When deposition is severe, the number of pools become fewerand the pools that are present loose depth as they fill with sediment. In the longitudinal profile,pools follow riffles and runs. The pool facet slope is the angle of declination from the end of theupstream feature (riffle or run) to the lowest point in the pool. This angle will trend towards thehorizontal as the pool fills with sediment; there<strong>for</strong>e, the pool facet slope is an indicator ofsediment conditions in a stream channel that is expected to contain pools.When measuring the facet slope, care must be taken to measure, as accurately as possible, bothends of the facet. A procedure <strong>for</strong> measuring a more accurate longitudinal profile is described inthe longitudinal profile procedure documentation. Examples of this analysis are detailed inLawson and Huth (2003).8.11.1 Pool Facet Slope Analysis ProcedureThe facet angles are measured from longitudinal profiles where feature types and feature depthsare known. This calculation is the rise over run and expressed as the mathematical ratio or adegree angle of declination (arctan = rise/run). A profile of sufficient length <strong>for</strong> the analysis isdetermined by localized conditions. The length of the profile could be as much as 2,000 feet orseveral meanders. The profile length should give enough facet angles <strong>for</strong> statistical analysis when astudy reach is compared to a reference reach. It is suggested that both the study and referencereaches contain a minimum of twenty-five pools. It is unknown, at this time, how different theangles of the two reaches must be to be significantly different. The calculations of mean,minimum, maximum, and standard deviation of reach pools are recommended <strong>for</strong> comparisons.REVISED SEPTEMBER 2012 178
STANDARD OPERATING PROCEDURES FOR SURFACE WATER QUALITY SAMPLINGCHAPTER 9POST-TRIP PROCEDURES9.1 CALCULATING DISCHARGEAfter all flow measurements have been recorded on the field data sheet, discharge can becalculated using an excel spreadsheet. The "Calculating Discharge" template can be found atJ:\WQD\<strong>Surface</strong> <strong>Water</strong> Section\Monitoring Unit\Streams\Excel WorksheetsThe completed <strong>for</strong>m should be printed and included with the field data sheets in thesite file.FIGURE 9.1. Discharge results from Excel template.9.2 PEBBLE COUNTSThe median particle size (d50) can be calculated using the pebble count spreadsheet on the "J"drive. The 15th, 85th and 100th percentiles are also automatically calculated. Print out a copy ofthe completed data sheet and place it into the site folder.REVISED SEPTEMBER 2012 179
STANDARD OPERATING PROCEDURES FOR SURFACE WATER QUALITY SAMPLINGFIGURE 9.2. Pebble count excel sheet.9.3 POST-TRIP CALIBRATIONSCalibrate pH, dissolved oxygen and conductivity when you return to the office. Values shouldagree with the precalibration results within the following limits.Parameter Acceptable RangepHPost-trip reading should be within 0.3 standard units of the pre-trip readings <strong>for</strong>each buffer solution used. Hydrolab instrument specifications specify aninstrument tolerance of +/- 0.2 SU, and additional 0.1 SU is permitted <strong>for</strong> minorenvironmental differences (temperature, etc.).Conductivity EC readings shall be within 10% of pre-trip post-calibration values.Dissolved Dissolved oxygen saturation values will be evaluated site by site according toOxygen calibration per<strong>for</strong>mance in the field. Readings will be evaluated after sitecalibration by stabilization time (should be within 2 minutes) and adherence to afull 100% calibration <strong>for</strong> YSI. Hydrolab measurements should be within 10%.TABLE 9.1 Post-trip calibrations.REVISED SEPTEMBER 2012 180
STANDARD OPERATING PROCEDURES FOR SURFACE WATER QUALITY SAMPLINGIf the field meter post trip checks are out of the ranges identified below, the following steps mustbe done:What to do if the calibration value is outside the "Acceptable Range".1. If the post-trip check results in readings that deviated outside of the acceptable range, thedata will not be acceptable <strong>for</strong> assessment or compliance purposes and should be excludedor discarded from the dataset. Be sure to make a note in the field notes that such data wasrejected.3. Determine when, if possible, any problems occurred in the field. If this can bedetermined, the readings taken be<strong>for</strong>e the problem occurred may be acceptable. Anyvalues obtained after the problem occurred should be discarded.4. If the problem resulted in large differences between meter readings and stated solutionvalues, try to isolate the problem and correct it as outlined in the Pre-Trip EquipmentCalibration <strong>Procedures</strong>. If the problem cannot be corrected satisfactorily, tag the meter <strong>for</strong>repair.9.4 ROUTINE MAINTENANCEMaintenance of active multiprobes should be conducted every quarter. Equipment that is notbeing regularly used should be maintained every six months. This section covers both YSI andHydrolab multiprobes. The maintenance is the same <strong>for</strong> both units unless otherwise noted.Record what maintenance was per<strong>for</strong>med, the date, who per<strong>for</strong>med the maintenanceand any problems encountered in the equipment log book.9.4.1 MULTIPROBE CALIBRATION9.4.1.1 Hydrolab Maintenance9.4.1.1.1 Specific Electrical Conductivity1. Prepare the unit by attaching the cable andtransmitter. On older sonde units and on someolder minisondes, the EC probe consists of a set ofnickel electrodes covered by a hard plasticconductivity cell block. When working with thistype of probe, first remove the conductivity cellblock with a screwdriver and then remove therubber o-rings from the electrodes.2. Newer units will probably be equipped with a fourelectrode graphite conductivity sensor (FIGURE9.3). This type of sensor should never be cleanedwith abrasive material of any type. When cleaningthe electrodes, use cotton and a solvent such asmethanol or isopropyl alcohol to remove anyresidue that may present. The sensor can also becleaned using warm soapy water. Rinse withFIGURE 9.3. New graphite conductivitysensor (left). Old nickle conductivityelectrodes (rig ht). Both are combined withthe DO probe.REVISED SEPTEMBER 2012 181
STANDARD OPERATING PROCEDURES FOR SURFACE WATER QUALITY SAMPLINGdeionized water when finished.3. For older units, polish all exposed surfaces of the nickel electrodes including the ends withthe emery strips (#400 wet/dry sandpaper) found in the maintenance kit. Do not to touchthe other probes with the sandpaper (especially the pH and redox); protect them with wetcotton. Rinse with deionized water and then replace the o-rings and the conductivity cellblock.9.4.1.1.2 pH1. Clean the glass probe with a cotton ball or Q-tip saturated with methanol or isopropylalcohol. Rinse the probe thoroughly with deionized water.2. If the response time of the pH probe does not produce 95% of the calibration readingwithin 90 seconds, then shock the probe with a weak HCl solution.3. Wrap the probe with cotton saturated with 0.1M HCl and leave <strong>for</strong> 5 minutes. Removethe cotton and rinse with deionized water. Soak the probe in pH 7.0 buffer <strong>for</strong> 10 minutesbe<strong>for</strong>e calibrating.4. The reference electrolyte is replaced in the older sonde units by inverting the entire unitand gently pulling off the white cylindrical sleeve. Empty the remaining electrolyte andrinse the sleeve with a small amount of fresh pH reference electrolyte. After rinsing, refillthe sleeve to the top with standard pH electrolyte and push sleeve back about half-way ontoits mount. At this point, turn the sonde unit so the probes are pointing upwards, allowingany air bubbles in the electrolyte to move up towards the porous Teflon junction. Push thesleeve down the rest of the way, purging any air within the chamber and flushing theporous junction on the tip of the sleeve with fresh reference solution. In most cases thefresh reference solution can be seen coming through the pores in the junction. In thenewer minisonde units, the porous Teflon junction is located at the top of the probe nextto the pH electrode. A screw driver is used to remove it so that the old reference solutioncan be dispensed and replaced with new solution. Use a syringe to replace the solution inthe probe. When the porous junction is replaced, the fresh solution is flushed thru thejunction.5. The porous junction of the electrolyte sleeve can become clogged with impurities overtime. A new junction may be required if air bubbles are obstructing the flow of electrolyteto pass through the junction during the process described in step #4.9.4.1.1.3 Dissolved Oxygen1. To change the DO membrane, remove the DO sensor guard (older sonde units) and o-ringsecuring the membrane. The membrane should be replaced each time the unit is serviced.The membrane should be replaced if air bubbles are under the membrane, the membraneis damaged, or if the membrane is wrinkled.2. To replace the DO electrolyte solution, tip the probe until the old solution is dispensed.Slowly refill with the squeeze bottle of KCL electrolyte provided in the kit. Empty theprobe a second time. Refill the probe again being careful not to induce any bubbles intothe cylinder. Gently tap the cylinder to remove any bubbles and let the unit sit <strong>for</strong> 5-10minutes to allow gases to escape. Add a few more drops of solution to <strong>for</strong>m a meniscus ifneeded.REVISED SEPTEMBER 2012 182
STANDARD OPERATING PROCEDURES FOR SURFACE WATER QUALITY SAMPLING3. To replace the standard membrane, secure the membrane on one side of the top of thesleeve with the thumb, and with a smooth firm motion, stretch the other end of themembrane over the sensor surface and hold it in place with the index finger. Secure themembrane with the o-ring and trim the excess membrane below the o-ring. There shouldbe no wrinkles in the membrane or bubbles in the electrolyte under the membrane. Avoidoverstretching the membrane. Do not touch any of the internal parts of the DO sensor.4. Test the unit <strong>for</strong> bubbles by gently tapping the sonde cylinder and by inverting the probe afew times.5. The DO sensor should be allowed to sit overnight to allow the membrane to relax be<strong>for</strong>ecalibrating.9.4.1.1.4 TemperatureThe temperature portion of the probe requires no maintenance. Temperature should be verifiedto a NIST traceable thermometer at least once a year.9.4.1.2 YSI Maintenance9.4.1.2.1 ConductivityThe openings that allow fluid access to the conductivity electrodes must be cleaned regularly. Thesmall cleaning brush included in the 6570 Maintenance Kit is ideal <strong>for</strong> this purpose. Dip thebrush in clean water and insert it into each hole 15-20 times. In the event that deposits have<strong>for</strong>med on the electrodes, it may be necessary to use a mild detergent with the brush. Aftercleaning, check the response and accuracy of the conductivity cell with a calibration standard.If this procedure is unsuccessful, or if probe per<strong>for</strong>mance is impaired, it may benecessary to return the probe to an authorized dealer.9.4.1.2.2 pHCleaning is required whenever deposits or contaminants appear on the glass and/or platinumsurfaces of these probes or when the response of the probe becomes slow.Remove the probe from the sonde. Initially, simply use clean water and a soft clean cloth, lenscleaning tissue, or cotton swab to remove all <strong>for</strong>eign material from the glass bulb and platinumbutton. Then use a moistened cotton swab to carefully remove any material that may be blockingthe reference electrode junction of the sensor.When using a cotton swab, be careful NOT to wedge the swab tip between the guard and the glasssensor. If necessary, remove cotton from the swab tip, so that the cotton can reach all parts of thesensor tip without stress. You can also use a pipe cleaner <strong>for</strong> this operation if more convenient.If good pH and/or ORP response is not restored by the above procedure, per<strong>for</strong>m the followingadditional procedure:1. Soak the probe <strong>for</strong> 10-15 minutes in clean water containing a few drops of commercialdishwashing liquid.REVISED SEPTEMBER 2012 183
STANDARD OPERATING PROCEDURES FOR SURFACE WATER QUALITY SAMPLING2. GENTLY clean the glass bulb and platinum button by rubbing with a cotton swab soakedin the cleaning solution.3. Rinse the probe in clean water, wipe with a cotton swab saturated with clean water, andthen rerinse with clean water.If good pH and/or ORP response is still not restored by the above procedure, per<strong>for</strong>m thefollowing additional procedure:1. Soak the probe <strong>for</strong> 30-60 minutes in one molar (1 M) hydrochloric acid (HCl). Thisreagent can be purchased from most distributors. Be sure to follow the safety instructionsincluded with the acid.2. Rinse the probe in clean water, wipe with a cotton swab saturated with clean water, andthen rerinse with clean water. To be certain that all traces of the acid are removed from theprobe crevices, soak the probe in clean water <strong>for</strong> about an hour with occasional stirring.If biological contamination of the reference junction is suspected or if good response is notrestored by the above procedures, per<strong>for</strong>m the following additional cleaning step:1. Soak the probe <strong>for</strong> approximately 1 hour in a 1 to 1 dilution of commercially-availablechlorine bleach.2. Rinse the probe with clean water and then soak <strong>for</strong> at least 1 hour in clean water withoccasional stirring to remove residual bleach from the junction. (If possible, soak the probe<strong>for</strong> period of time longer than 1 hour in order to be certain that all traces of chlorinebleach are removed.) Then rerinse the probe with clean water and retest.Dry the sonde port and probe connector with compressed air and apply a very thin coat of O-ringlubricant to all O-rings be<strong>for</strong>e re-installation.9.4.1.2.3 Dissolved OxygenThe KCl solution and the Teflon membrane at the tip of the probe should be changed prior toeach sonde deployment and at least once every 30 days during the use of the sonde in samplingstudies. In addition, the KCl solution and membrane should be changed if (a) bubbles are visibleunder the membrane; (b) significant deposits of dried electrolyte are visible on the membrane orthe O-ring; and (c) if the probe shows unstable readings or other probe-related symptoms.After removing the used membrane from the tip of the probe, examine the electrodes at the tip ofthe probe. If either or both of the silver electrodes are black in color, the probe should beresurfaced using fine sanding disks.To resurface the probe using the fine sanding disk, follow the instructions below. First dry theprobe tip completely with lens cleaning tissue. Next, hold the probe in a vertical position, placeone of the sanding disks under your thumb, and stroke the probe face in a direction parallel to thegold electrode (located between the two silver electrodes). The motion is similar to that used instriking a match. Usually 10-15 strokes of the sanding disk are sufficient to remove black depositson the silver electrodes. However, in extreme cases, more sanding may be required to regeneratethe original silver surface.REVISED SEPTEMBER 2012 184
STANDARD OPERATING PROCEDURES FOR SURFACE WATER QUALITY SAMPLINGAfter completing the sanding procedure, repeatedly rinse the probe face with clean water and wipewith lens cleaning tissue to remove any grit left by the sanding disk. After cleaning, thoroughlyrinse the entire tip of the probe with distilled or deionized water and install a new membrane.Be sure to: (1) Use only the fine sanding disks in the resurfacing operation and (2)Sand in a direction parallel to the gold electrode. Not adhering to either of theseinstructions can seriously damage the electrodes.If this procedure is unsuccessful, as indicated by improper probe per<strong>for</strong>mance, it may be necessaryto return the probe to an authorized service center.9.4.1.2.4 TemperatureThe temperature portion of the probe requires no maintenance. Temperature should be verifiedto a NIST traceable thermometer at least once a year.9.4.2 TURBIDITYThe Hach 2100 Turbidity meter should be calibrated with theprimary standard every quarter. The primary reference standard isdifferent from the secondary gel standards that travel with theunit.Turbidity Maintenance Check batteries (takes 4 AA) Clean unit Replace velvet cloth if dirty Replace secondary standards or sample vials if scratched Add label with calibration resultsFIGURE 9.4. Turbidity primaryreference standards.Be sure to check the expiration date of the primary standards and keep themrefrigerated. Mix the standards well be<strong>for</strong>e calibrating.Quarterly Calibration Procedure1. Insert the 0.1 NTU primary reference standard in the cell compartment (the one in therefriderator). Shake/mix well. Be sure to align the arrow on the cell with the arrow on thecell compartment. Close the lid and press I/O button to turn the machine on.2. Press the CAL button and then the arrow key to get a numerical value.3. Then press READ. The instrument will count back from 60 seconds and then ask <strong>for</strong> thenext Gelex Primary <strong>Standard</strong>.4. Insert the 20 NTU primary reference standard in the cell compartment and press theREAD button. The instrument will count back from 60 seconds and then ask <strong>for</strong> the nextGelex Primary <strong>Standard</strong>.REVISED SEPTEMBER 2012 185
STANDARD OPERATING PROCEDURES FOR SURFACE WATER QUALITY SAMPLING5. Insert the 100 NTU primary reference standard in the cell compartment and press theREAD button. The instrument will count back from 60 seconds and then ask <strong>for</strong> the nextGelex Primary <strong>Standard</strong>.6. Insert the 800 NTU primary reference standard in the cell compartment and press theREAD button. The instrument will count back from 60 seconds.7. Remove the cell from the compartment and press CAL to accept the calibration. Theinstrument will return to the measurement mode automatically.8. If the calibration is not accepted start back at step one and try it again.9. Next, insert the 0-10 gel standard (the one that is used in the field) and press READ. Dothis three times to obtain an average that will become the calibration value. Write thisvalue down on a label that will be placed on the instrument.Press the ‘RANGE’ button if you see a blinking 9.99 value.10. Insert the 0-100 gel standard and press READ. Do this three times to obtain an averagethat will become the calibration value. Write this value down on a label that will be placedon the instrument.11. Insert the 0-1000 gel standard and press READ. Do this three times to obtain an averagethat will become the calibration value. Write this value down on a label that will be placedon the instrument.9.4.3 FLOW METERMaintenance <strong>for</strong> the flow meter basically consists of checking the batteries and calibrating usingthe bucket test.Flow Meter Maintenance Check Batteries (takes 2 D) Add label with calibration date and noting that batteries were goodFlow Meter Quarterly Calibration1. Fill a 5 gallon bucket of water half full of water. Clean sensor if needed with soap andwater.2. Insert the probe sensor so that it doesn't touch the sites of the bucket. You may attach theprobe to the wading rod to suspend the probe. Let the probe sit <strong>for</strong> at least a minute sothat the water is not moving.3. Turn on the unit and press RCL and STO at the same time. The number "3" should bedisplayed. Quickly press until "0" is displayed. Quickly press RCL and STO again.If you are not quick enough you may need to power down the unit and start over.REVISED SEPTEMBER 2012 186
STANDARD OPERATING PROCEDURES FOR SURFACE WATER QUALITY SAMPLING9.4.4 BACTERIA KITS AND INCUBATORS1. Verify that all the items in the bacteria portion of the checklist (Appendix A) are in thebacteria kits.2. Ensure that incubators reach and maintain a temperature of 44.5 degrees by reading thesupplied thermometer located in the incubator (FIGURE 9.5).FIGURE 9.5. Incubator thermometer showing the 35 and 44.5 degree C marks.9.4.5 SEM MONITORINGMaintenance <strong>for</strong> SEM monitoring should include verifying that all the needed equipment ispresent and in good repair be<strong>for</strong>e the spring sampling event.9.5 MACROINVERTEBRATE SHIPPING9.5.1 SAMPLE PREPARATION FOR SHIPPING TO TAXONOMY LABORATORY1. Drain sample over a 500 micron sieve and large funnel into a waste container (e.g. 5-gallonisopropanol carboys) under a fume hood and place the sample back into the sample jaralong with the correct interior label. Ensure that all specimens have been picked off thesieve and placed in sample container, then cap tightly. Rinse and scrub the sieve with abrush prior to draining the next sample.2. Wrap jars in bubble wrap and place in a heavy duty garbage bag with an absorbent sheet,inside a shipping box. ADEQ uses ADOT approved boxes that are 14x10x10", single-wallconstruction, edge Crush Test of 32 lbs/inch, gross weight limit of 65 lbs. The bubble wrapprevents shock and deterioration of the sample specimens. Close and seal the garbage bag.Place the Laboratory address on a sheet of paper inside the box, along with an inventory ofsamples. Seal the box with tamper-proof tape to continue chain of custody while samplesare in transit. Mark boxes with “this side up” arrows to further prevent leakage and protectsamples.3. Ship boxes via commercial carrier. No hazardous materials labeling is required. ADEQhas received verbal approval from DOT and UPS to ship decanted macroinvertebratesamples without having to meet hazardous materials shipping requirements because of thevery limited quantities of isopropanol alcohol present in the decanted samples. ADEQmarks boxes with "this side up" arrows to further prevent leakage and protect samples.Normal address labels are used <strong>for</strong> shipping. Enclose Chain of custody <strong>for</strong>m with thesamples.All macroinvertebrate samples from a spring sample event are shipped to thelaboratory in July of each year or as soon as practical after sampling.The taxonomy laboratory verifies receipt of samples listed on the chain of custody <strong>for</strong>mand emails a receipt of the samples <strong>for</strong>m. The laboratory also refreshes the alcoholpreservative.REVISED SEPTEMBER 2012 187
STANDARD OPERATING PROCEDURES FOR SURFACE WATER QUALITY SAMPLINGREVISED SEPTEMBER 2012 188
STANDARD OPERATING PROCEDURES FOR SURFACE WATER QUALITY SAMPLINGCHAPTER 10 DATA MANAGEMENTThis chapter is meant to provide clear data entry methods that encourage uni<strong>for</strong>mity and accuracyin surface water quality data management. It is to be used by anyone who enters data into thesurface water side of the WQDB. For the purposes of this manual, WQDB will reference thesurface water portion of the database.10.1 WHERE IS WATER QUALITY DATA STORED?Most surface water quality data is stored in an Oracle based database called the <strong>Water</strong> QualityDatabase (WQDB). Macroinvertebrate and habitat data is stored in a Microsoft Access databasecalled the Ecological Data Application System (EDAS). Fish tissue and algae data is currentlystored in Microsoft Excel spreadsheets. This chapter will focus primarily on WQDB navigationand data entry.10.2 WQDB BASICSThe WQDB is a relational database that makes the task of storing hundreds of thousands of waterquality records easier. All databases are made up of multiple tables that are related to one another.The WQDB has four main tables that are interconnected (FIGURES 10.1 and 10.2).SiteVisitSampleTest ResultFIGURE 10.1. WQDB table hierarchy. One site is related to many visits. One visit is related to many samples etc.REVISED SEPTEMBER 2012 189
STANDARD OPERATING PROCEDURES FOR SURFACE WATER QUALITY SAMPLINGFIGURE 10.2. A slightly more complicated view of the main tables in the WQDB and their associated fields.The water quality database currently has over 1 million records from internal and external sources.A record is a defined as a discrete parameter at a particular location at a particular time. Forexample, an alkalinity concentration of 123 mg/L at Roosevelt Lake 15 feet below the surface onMarch 23, 2008 would be one record. ADEQ is the primary source of most of the data in theWQDB (FIGURE 10.3). Fifty-seven percent of the data in the WQDB is from ADEQ, 23 percentof the data is from USGS and 20 percent if from other sources such as the Salt River Project andArizona Game and Fish (to name just a few).REVISED SEPTEMBER 2012 190
STANDARD OPERATING PROCEDURES FOR SURFACE WATER QUALITY SAMPLINGNumber of Records by Year400003500030000Number of Records250002000015000ADEQUSGSOther10000500001987 1988 1989 1990 1991 1992 1993 1994 1995 1996 1997 1998 1999 2000 2001 2002 2003 2004 2005 2006FIGURE 10.3. Number of WQDB records by year and by reporting agency.10.3 NAVIGATING THE WQDBThis section will focus on how to move from screen to screen in the WQDB. There are a varietyof <strong>for</strong>ms and reports that are prepackaged in the database. There are also a number of ways toquery the database.10.3.1 LOGGING INTO THE DATABASEOpening the database is as simple as double clicking on the water faucet that should beon your desktop.There are two databases that you will routinely deal with <strong>for</strong> <strong>Surface</strong> <strong>Water</strong>. The"production database" and the "test database". The "test database" is used to testmodifications to the database in a safe environment and should be accessed using adifferent icon. The in<strong>for</strong>mation technology staff will typically email you the URL <strong>for</strong>this application when you need to test enhancements or changes to the database.REVISED SEPTEMBER 2012 191
STANDARD OPERATING PROCEDURES FOR SURFACE WATER QUALITY SAMPLINGFIGURE 10.4. Logon screen.Your username will be your LAN ID. See your supervisor <strong>for</strong> your password. The database is"com" (FIGURE 10.4).A <strong>Water</strong> Quality Division Database Access Request Form must be filled out (andapproved) prior to accessing certain parts of the database. This <strong>for</strong>m will indicate whatrights you have (supervisor, read-only, add/delete, etc.). This <strong>for</strong>m can be found onthe intranet under "Forms".10.3.2 NAVIGATING THROUGH THE WQDBAfter logging into the WQDB, the screen in FIGURE 10.5 will appear. This is the main menu <strong>for</strong>the database and includes all the various screens to view the data <strong>for</strong> the water quality division.Click "<strong>Surface</strong> <strong>Water</strong>" to enter the surface water quality database.FIGURE 10.5. The WQDB Main Menu.REVISED SEPTEMBER 2012 192
STANDARD OPERATING PROCEDURES FOR SURFACE WATER QUALITY SAMPLINGThe surface water main menu has six choices (FIGURE 10.6). The enter/update menu will bedescribed in Section 10.6. The Inquiry, Report and Database Lookup Tables, and Supervisormenus are described below. FIGURE 10.7 provides a flow chart which identifies the relationshipbetween all the screens, <strong>for</strong>ms and reports that can be accessed in the WQDB.FIGURE 10.6. The main menu <strong>for</strong> the <strong>Surface</strong> <strong>Water</strong> Database.REVISED SEPTEMBER 2012 193
LoginWQDB MainMenuGroundwaterGlobalPositioningPermits <strong>Surface</strong> <strong>Water</strong>Drywell Engineering CERTOP/SWAPEnter/UpdateInquiryLookupTablesReportsSupervisorBatchManagementVisitVisitsSiteEntrySiteFormSingleSiteSiteFormMultipleSitesTestResultsBy Basin, watershed,HUC, or program areaLookupTablesVariousLookupTablesQCReportQCReportDetailsEventsAddSampleUpdateSampleSampleTestsTestResultsReportQCReportEventsFormLab &SuitesNewTestResultFormExistingTestResultFormFIGURE 10.7. Flow chart of the <strong>for</strong>ms and reports within the WQDB.REVISED SEPTEMBER 2012 194
STANDARD OPERATING PROCEDURES FOR SURFACE WATER QUALITY SAMPLING10.3.2.1 Inquiry MenuThe inquiry menu provides a variety of canned reports and <strong>for</strong>ms to complete simple queries ofthe database. Other tools such as Oracle Discoverer, Microsoft Query, or the <strong>Water</strong> Quality Datawarehouse should be used to run more complicated queries. The four query choices within theWQDB are listed in FIGURE 10.8.FIGURE 10.8. <strong>Surface</strong> <strong>Water</strong> Inquiry Menu10.3.2.1.1 Single Site DetailedThis query will open up a blank site <strong>for</strong>m (FIGURE 10.9). You may query any field on this <strong>for</strong>m.1. Use the wildcard "%" to return multiple records. For example, entering "LCLCR%" in the"Site ID" field will give all the sites with LCLCR which is the Little Colorado River.Entering %STONE% in the "Site Name" field will give all the site names with STONEbe<strong>for</strong>e or after the percent sign (like Tombstone or Stoneman Lake).2. Press the flashlight button.3. Use the blue up and down arrows to scroll through the records.4. Press the "Sample/Test" button to see the test results at this particular site.5. Use the blue up and down arrows to scroll through the different dates.You can also query directly from the Sample/Test Results screen.REVISED SEPTEMBER 2012 195
STANDARD OPERATING PROCEDURES FOR SURFACE WATER QUALITY SAMPLINGFIGURE 10.9. Single site detailed.10.3.2.1.2 Multiple Site MenuYou can query multiple sites by using the multiple sitemenu. The basin, watershed, and HUC reports all work inroughly the same manner.1. Enter the applicable HUC/watershed.2. Enter the waterbody type (stream, lake, etc).3. Its strongly recommended that you also enter aspecific stream or lake to limit the number ofrecords that will be returned.The pull down arrow may need to be pressedtwice to get a filtered list of streams or lakes.REVISED SEPTEMBER 2012 196
STANDARD OPERATING PROCEDURES FOR SURFACE WATER QUALITY SAMPLINGFIGURE 10.10. Multiple sites by basin query.4. Enter the <strong>for</strong>mat you would like to see your data in. The output optionsare as followsA. Screen. This will take you to a listing of all the sites fitting thecriteria you entered. You may "drill down" to the test results byclicking "deq number".B. Preview. This is a "PDF" adobe acrobat list of all the sites in thequery.C. Flat File. This will generate a text file listing of all the sites in thequery.To execute, click the "Per<strong>for</strong>m Query" button.10.3.2.1.3 Test ResultsThe test results query works in much the same manner as the multiple site query with theexception that all results <strong>for</strong> a particular site will be returned. You can drill down by parameter(FIGURE 10.11) to filter your results.REVISED SEPTEMBER 2012 197
STANDARD OPERATING PROCEDURES FOR SURFACE WATER QUALITY SAMPLINGFIGURE 10.11. Test result query.10.3.2.2 Report MenuThe report menu currently only has one report <strong>for</strong> quality control calculations. This is primarily<strong>for</strong> streams work and deals with calculating things like cation and anion ratios to determine ifthere were any quality assurance problems at the lab. See Section 10.5 <strong>for</strong> additional detail onquality assurance and control.10.3.2.3 Lookup Table MenuThe lookup tables provide all the background in<strong>for</strong>mation in the database. For example, there is alookup table <strong>for</strong> county names that enables the sampler to fill in one of the Arizona counties onthe Site screen. The in<strong>for</strong>mation from the pull down list comes from the lookup tables.Supervisors and administrators are typically the only ones with rights to change the lookup tables.One of the most important lookup tables <strong>for</strong> a sampler is the Chemical Suite List.This template is lab specific and fills all the in<strong>for</strong>mation in automatically except <strong>for</strong> thesample result. If the lab methods or parameters change then this table will need to beupdated.REVISED SEPTEMBER 2012 198
STANDARD OPERATING PROCEDURES FOR SURFACE WATER QUALITY SAMPLINGFIGURE 10.12. <strong>Surface</strong> water lookup tables.10.3.2.4 Supervisor MenuThe supervisors menu allows the supervisor to edit the lookup tables.10.4 ENTERING DATA10.4.1 ELECTRONIC UPLOADSElectronically uploading data from the lab greatly speeds up the data entry process. It also reducestranscription errors by lab and data entry staff. The data from the lab must con<strong>for</strong>m to an ASCIIfixed-width <strong>for</strong>mat with the following in<strong>for</strong>mation:Field NameCharacter PositionADEQ Number 01-06Lab Name 07-11Reporting Agency 12-16Collecting Agency 17-21Sample ID 22-81Field Sample Type 82Lab Sample Type 83Lab ID 84-98REVISED SEPTEMBER 2012 199
STANDARD OPERATING PROCEDURES FOR SURFACE WATER QUALITY SAMPLINGField NameCharacter PositionSample Date 99-108Sample time 109-112Method 120-139STORET 140-144Lab Reporting Limit 145-152Lab Reporting Limit Unit 153-160Sample Result 161-172Lab Notation 173-175Sample Result Unit 176-183Dilution 184-193Lab Qualifier 1 194-196Lab Qualifier 2 197-199Lab Qualifier 3 200-202Sampler Name 203-232Site ID 233-244Comment 245-494TABLE 10.1. Fixed width <strong>for</strong>mat required <strong>for</strong> electronic uploads into the <strong>Surface</strong> <strong>Water</strong> database.10.4.1.1 Electronic Upload ProcessADEQ has developed a process to upload data from the lab (FIGURE 10.13). The lab emails thedata portal a text file with all the lab results. The data portal is the person at ADEQ who isdesignated to receive all electronic submittals <strong>for</strong> the surface water section. The portal thenrequests that the Batch Upload Manager to load the data. The sampler will receive an email thattheir data, which includes everything from their entire trip, has been loaded successfully.Error messages will be displayed in the lower left hand side of the screen or as a textbox. Additional in<strong>for</strong>mation about the type of error can be obtained by pressingSHIFT + F1.REVISED SEPTEMBER 2012 200
STANDARD OPERATING PROCEDURES FOR SURFACE WATER QUALITY SAMPLINGText File EmailedFrom lab toADEQ PortalProblems withUpload?NoData loaded intoproduction, EmailPortal “LoadSuccessful”YesDetermine why thereis a loading error.Portal/samplerrequest that labcorrectly <strong>for</strong>mats dataLab Error(Typically<strong>for</strong>matting)Sampler Error(Typically wrongSiteID, time date)Who’s ResponsibleSampler ManuallyEnters Data.Sampler emailsPortal.Error cannotbe fixed in atimely manorPortal Emailssampler ErrorSampler emails lab(cc Portal) w/correction & requestto reload dataLabSampler or PortalPortalSamplerBatch Upload ManagerFIGURE 10.13. Flow chart of the electronic upload process.The database portal will work with the samplers if there is a problem. Once the problem isidentified, ADEQ request that the data be reloaded with the correct in<strong>for</strong>mation. If there is notimely fix the sampler may decide to load the data manually (see Section 10.3.2). The samplermust email the database portal if they choose to load the data manually.A hard copy of the lab data will still be sent to the sampler <strong>for</strong> the site file.10.4.1.2 What Parameters are Electronically Uploaded?Only lab parameters are electronically uploaded. Field parameters are manually entered (seeSection 10.4.2). Samplers also need to add sampling event in<strong>for</strong>mation or comments, add missinglab data qualifiers, and validate the data. Duplicate samples will also need to be manually entered.The “Database Portal” will notify you when the data has been received at ADEQ.10.4.1.3 How to Avoid Electronically Uploading DataThe lab cannot load the data into the WQDB without a valid SiteID. Use the temporary code"999" followed by a descriptive name <strong>for</strong> the site if you do not wish to have your data electronicallyuploaded. For example, use 999QC1 <strong>for</strong> a blank.REVISED SEPTEMBER 2012 201
STANDARD OPERATING PROCEDURES FOR SURFACE WATER QUALITY SAMPLING10.4.2 MANUAL DATA ENTRYThere are a couple of different ways to manually enter data into the database. This section coversthe fastest and most commonly used route <strong>for</strong> entering data.10.4.2.1 Navigating to the Site Visit ScreenThe visit screen allows you to see all the samples taken at a site <strong>for</strong> a particular date. To enter thevisit screen, click surface water, enter/update menu and then visit (FIGURE 10.14).FIGURE 10.14. Pathway to the visit screen.To open up an existing site on the visit screen either enter the SiteID or the DEQ number andthen hit the searchlight button . The screen will show all samples collected at that particularsite and sort them by date (newest at the top) (FIGURE 10.15).REVISED SEPTEMBER 2012 202
STANDARD OPERATING PROCEDURES FOR SURFACE WATER QUALITY SAMPLINGFIGURE 10.15. Visits screen.10.4.2.2 Adding a New VisitThis section applies to data that will not be electronically uploaded. Use this procedure <strong>for</strong> a sitethat has no data listed <strong>for</strong> the date you sampled. For visits that already have existing data <strong>for</strong> aparticular date (or will soon) see Section 10.4.2.3.1. Click on the top most date and then click the add record button .2. Add the date, agency, sampler and program in<strong>for</strong>mation.3. Click the "Add Sample" button.4. See Section 10.4.3 to enter data using a template or Section 10.4.4 to enter it manually.10.4.2.3 Adding a Sample to an Existing VisitUse the "Add Sample" button to add a new time or depth <strong>for</strong> that particular date (typically lakesonly). See Section 10.4.3 to enter data using a template.10.4.2.4 Updating an Existing SampleUse the "Update Sample" button to add parameters to a particular time/depth <strong>for</strong> a particulardate. The "Update Sample" button is used when adding field parameters to data that has beenelectronically uploaded.REVISED SEPTEMBER 2012 203
STANDARD OPERATING PROCEDURES FOR SURFACE WATER QUALITY SAMPLINGYou must wait to add field parameters to a site until after the lab data has beenelectronically uploaded. If you input field parameters be<strong>for</strong>e the lab data, the lab datawon't load into the WQDB (there cannot be two samples taken at the same time onthe same date).All sample results <strong>for</strong> a particular time, date and depth should be on the same record.Use the up and down arrows to find the record you need to update. You can eitherenter all the data manually (not recommended) or use a template by clicking on the "Add SampleSuite" button on the "Sample &Test Results" Screen (FIGURE 10.16). See Section 10.4.3 <strong>for</strong> theprocedure to add a sample suite.FIGURE 10.16. Test Results Screen shot.10.4.3 ENTERING DATA USING A TEMPLATEYou should use a template to enter data whenever possible. A template is a list of parameters thathas all the lab methods, units, etc. The ambient streams program has a template that lists all themetals, nutrients, inorganic and field parameters. This saves time and reduces errors whenentering data.The chemical suite selection screen may be reached by the visit screen or by the test results screen.The procedure <strong>for</strong> both is the same.1. Select the analyzing lab (FIGURE 10.17).2. Enter the Lab Number (optional). The lab number is number that the lab gives to asample and is usually on the chain of custody.3. Enter the Lab Sample Type (Regular, Duplicate, Split)REVISED SEPTEMBER 2012 204
STANDARD OPERATING PROCEDURES FOR SURFACE WATER QUALITY SAMPLING4. Select the appropriate premade sample suite. You can go to the lookup tables under the"inquiry" menu to see what parameters each suite currently has.5. Click the Enter Sample/Test Results button (FIGURE 10.17).FIGURE 10.17. Chemical suite selection.6. Enter the following if not already filled out (FIGURE 10.18):o Sample ID - Same as the Lab Sample IDo Field Sample Type (composite, grab, insitu etc.)o Sample Time (this is in military time, required)o Depth (if it is a lake)o Custody (was there a chain of custody? Almost always a "Y" <strong>for</strong> yes)The collection agency and reporting agency fields should be filled out already. TheCollection agency is the group that collects the sample (usually ADEQ). The reportingagency is the agency that paid <strong>for</strong> the data (again, usually ADEQ).REVISED SEPTEMBER 2012 205
STANDARD OPERATING PROCEDURES FOR SURFACE WATER QUALITY SAMPLINGFIGURE 10.18. Test results screen shot after a template has been loaded. Note all the "ND" results.7. By default, all the results will be listed as "ND" or non-detect in the Test Results Screen.Go through and enter each result <strong>for</strong> all the parameters in the template. Add anyapplicable lab data qualifiers and comments. Verify that the analytical method, reportinglimits, and etc. are correct and match what has been reported by the lab.8. Save your work by clicking .9. Add any applicable events by clicking on the event button. Events are basically qualifiers<strong>for</strong> that particular date and site or <strong>for</strong> an entire visit. All events listed in TABLE 10.2 thatapply to a site must be noted in the database. Nobody wants to spend countless hourspouring over your field notes to figure out why a pH reading wasn't taken. Multiple eventscan and should be entered <strong>for</strong> each site. They are vitally important when other people aretrying to make sense of your data. Although observations could simply be written into thecomment field, a set of critical “events descriptions codes” were established so that datacould be queried by these codes.What's the difference between a sample and a visit? A sample is specific to a particulardate, location and time. A visit is only specific to a date and place. This is important<strong>for</strong> lakes which may have multiple samples per visit. You can flag the entire visitrather than each sample.VISIT OR EVENT DESCRIPTIONABUNDENT MACROPHYTESABUNDENT WATERFOWLALGAL BLOOMALGAL BLOOM IN THE LACUSTRIN PORTION OF THE LAKEREVISED SEPTEMBER 2012 206
STANDARD OPERATING PROCEDURES FOR SURFACE WATER QUALITY SAMPLINGVISIT OR EVENT DESCRIPTIONDATA CHECK COMPLETEDDEVIATION FROM STANDARD OPERATING PROCEDURESDIEL DO SWING IS MORE THAN 5 MG/L IN LAKE PHOTIC ZONEDISSOLVED OXYGEN VALUE ATTRIBUTED TO GROUNDWATER UPWELLINGEQUIPMENT PROBLEMS ASSOCIATED WITH VISIT(DATA ASSOCIATED WITH THE EQUIPMENT NOT ENTERED)EVIDENCE OF RECENT FLOODINGEXCEEDANCE(S) AT TIME OF SAMPLINGFIELD BLANK CONTAMINATION ABOVE MRL - DATA NOT ACCEPTEDFISH KILL ATTRIBUTED TO LOW DO, HIGH PH OR ALGAL TOXICITYFISH KILL OBSERVEDFLOOD EVENT IN PROGRESS AT TIME OF SITE VISITFLOW MEASUREMENT FROM USGS GAUGE/RECORDS OR 3RD PARTYGENERAL – ADDITIONAL COMMENTGENERAL/ADDITIONALGROUNDWATER -- DISSOLVED OXYGEN VALUE ATTRIBUTED TO GROUNDWATER UPWELLINGHOLDING TIME EXCEEDEDINCOMPLETE SAMPLING EVENT - MISSING PARAMETER(S) OR REPORTSINDEPENDENT HYDROLOGIC EVENT (ALTHOUGH WITHIN 7 DAYS OF OTHER VISITS)INDICATION OF TOXIC ALGAELIMITED SAMPLING EVENT - SELECTED PARAMETERS ONLYLOW D.O./HIGH PH ATTRIBUTED TO PONDING OR EVAPORATION OF STREAMLOW FLOW CONDITIONSLOW LAKE LEVELSNEARBY SPRINGS INFLUENCING SAMPLESMACROPHYTES – ABUNDANT MACROPHYTESNO ACTIVE FLOW; POOLS OR PONDED WATER ONLYNOT RECOMMENDED FOR ASSESSMENTQA/QC OR DUPLICATE SAMPLE COLLECTED AT TIME OF VISITQC EQUIPMENT BLANK ASSOCIATED WITH VISITQC RATIO OUTSIDE ACCEPTABLE RANGE - CATION / ANION BALANCEQC RATIO OUTSIDE ACCEPTABLE RANGE - F/L ECQC RATIO OUTSIDE ACCEPTABLE RANGE - F/L PHQC RATIO OUTSIDE ACCEPTABLE RANGE - TDS / CALC. SUMQC RATIO OUTSIDE ACCEPTABLE RANGE - TDS / ECSIGNIFICANT RAIN DURING PAST 48 HOURS MAY AFFECT RESULTSSPLIT/DUPLICATE ANALYSIS OUTSIDE CONTROL LIMITSSPLIT/DUPLICATE ANALYSIS ALL WITHIN CONTROL LIMITSSTREAM DRY AT TIME OF SITE VISITSUBMERGED AQUATIC VEGETATION COVERING >50% LAKE BOTTOMWATERFOWL – ABUNDANT WATERFOWLVISIT MEMBER OF INDEPENDENT EVENT GROUPING - AFTER EVENTVISIT MEMBER OF INDEPENDENT EVENT GROUPING - DURING EVENTWEATHER CONDITIONS MAY AFFECT SAMPLESTABLE 10.2. Available events in the WQDB.10. Save your work by clicking .REVISED SEPTEMBER 2012 207
STANDARD OPERATING PROCEDURES FOR SURFACE WATER QUALITY SAMPLING10.4.4 ENTERING DATA BY HANDOccasionally you may need to add a few parameters by hand into the database. Individualparameters can be added by hand to the WQDB using the following method.1. Navigate to the Test Results Screen and locate the site, date and time you want to update.2. Click on the top most parameter (the field under "reporting lab will work fine) and thenclick the add record button .3. Input the STORET number. STORET codes can be looked up by parameter name usingthe SW STORET lookup table in the WQDB. (A list is provided in Appendix D)Additional STORET codes are available in the EPA STORET lookup table. Contact yoursupervisor if you need to create a new STORET code.A STORET code is selected based on the parameter name, unit of measurement, media,and analysis type. They must all be correct. For example, if you were looking <strong>for</strong> possibleSTORET codes <strong>for</strong> dissolved copper, you would query the STORET / ParameterIn<strong>for</strong>mation table. Use the search button (flashlight). to enter the parameter, surroundedby “%” signs: %copper%. This would bring up the alternatives shown below.FIGURE 10.19. STORET query.To narrow the field of alternatives you could have entered, the sample media (water) andanalysis type (dissolved) or measuring units (μg/l).4. Enter the reporting lab.REVISED SEPTEMBER 2012 208
STANDARD OPERATING PROCEDURES FOR SURFACE WATER QUALITY SAMPLINGFIGURE 10.20. Entering the STORET number automatically updates several other fields.5. Enter the lab number ID6. Enter the sample purpose (regular, duplicate, split).7. Enter the water method.Only approved analytical methods should be sited. The methods in the drop down listin the WQDB may not be approved <strong>for</strong> ambient surface water quality data. Themethods list in WQDB is currently shared by all programs. It includes many methodsapproved <strong>for</strong> analysis <strong>for</strong> other programs (e.g., hazardous wastes and soilcontamination).8. Enter the lab notation if needed. ND or not detected is the most common lab notation.When the lab notation is present the results should be blank and vice versa.If bacteria counts are reported as “too numerous to count,” then enter GT <strong>for</strong> the labnotation. A rough estimate of the upper detection limit should also be entered. Thismay be an educated guess. The upper limit <strong>for</strong> Colilert analysis is 2419.6 CFU per 100mL (unless dilutions are pre<strong>for</strong>med). Also enter the A1 data qualifier indicating thatthe bacteria is too numerous to count.Bacterial results are not recorded as “0” as this number will interfere with automatedgeometric mean calculations (Chapter 4 has additional in<strong>for</strong>mation regardingbacteria).CodeABGTLTLT-NNDLab NotationCompound is absentGreater than quantification levelLess than (Unknown if below quantificationlevel)Less than (No presence of compound detected)Presumptive evidence of the presence of thecompoundNot detectedREVISED SEPTEMBER 2012 209
STANDARD OPERATING PROCEDURES FOR SURFACE WATER QUALITY SAMPLINGCodePRTABLE 10.3. Lab notation descriptions.Lab NotationCompound is present9. Enter the results and units. Results are entered using the units provided by the laboratoryand that agree with the STORET code chosen. Be sure that the units and results match.Incorrect units are one of the most common errors.You will seldom report a result of “0.” Instead you will report that it was measured belowthe lower reporting or detection limit – even with field equipment. The <strong>Sampling</strong> andAnalysis Plan should contain the default detection limits <strong>for</strong> the laboratory analysis as wellas the lowest reliable range <strong>for</strong> all field equipment.This issue is more complex when dealing with hardness dependent standards. Several areasin the state, primarily in higher elevations, have hardness that varies well below 100 mg/L.Such low hardness values result in very low criteria to be met. In these areas, specialarrangements may be necessary to detect dissolved metals below the applicable criteria.10. Enter the reporting limit and reporting limit units. The reporting limit <strong>for</strong> the WQDB istypically the Method Reporting Level (MRL). Lab results can be reported between theMethod Detection Limit and the MRL. These results will be flagged with one of the"Estimate" qualifiers in TABLE 10.4.Samples that are analyzed at a detection limit above any applicable water qualitycriterion do not tell us if the standard was exceeded. Such analysis should be avoided.For example, the chronic selenium criterion is 2.0 μg/L; there<strong>for</strong>e, a lab resultreported as
STANDARD OPERATING PROCEDURES FOR SURFACE WATER QUALITY SAMPLINGCodeLBA4A2A3A5MPVA6A7A1B4B6B3Short Description of QualifierANALYTE - VALUE REPORTED IS ABOVE INSTRUMENT DETECTION LIMITBACTERIA - COLONY COUNTS OUTSIDE IDEAL RANGE (20-60 CFU)BACTERIA - DETECTED IN METHOD BLANK.BACTERIA - INCUBATION PERIOD EXCEEDEDBACTERIA - INCUBATION PERIOD SHORTER THAN REQUIRED.BACTERIA - INCUBATOR/WATER BATH TEMP OUTSIDE REQUIREMENTSBACTERIA - MOST PROBABLE VALUE.BACTERIA - NOT DETECTED IN POSITIVE CONTROLBACTERIA - SAMPLE HAD INADEQUATE HEADSPACEBACTERIA - TOO NUMBEROUS TO COUNTBLANK - ANALYTE IN BLANK AT OR ABOVE METHOD ACCEPTANCE CRITERIA.BLANK - ANALYTE IN CALIBRATION BLANK AT OR ABOVE THE METHOD REPORTING LIMIT, BUTBELOW STANDARDBLANK - ANALYTE IN CALIBRATION BLANK AT OR ABOVE THE METHOD REPORTING LIMIT.B7BLANK - ANALYTE IN METHOD BLANK AT OR ABOVE MRL, BUT CONC. IN SAMPLE IS 10X ABOVE CONCIN BLANKB5BLANK - ANALYTE IN METHOD BLANK AT OR ABOVE THE METHOD REPORTING LIMIT, BUT BELOWSTANDARD.B1 BLANK - ANALYTE IN METHOD BLANK DETECTED AT OR ABOVE METHOD REPORTING LIMITB2BLANK - NON-TARGET ANALYTE DETECTED IN METHOD BLANK AND SAMPLE PRODUCINGINTERFERENCEK1 BOD - DILUTIONS DID NOT MEET THE OXYGEN DEPLETION CRITERIA (2 MG/L)K2 BOD - DILUTIONS DID NOT MEET THE RESIDUAL D.O. CRITERIA (1 MG/L)K4 BOD - SEED DEPLETION OUTSIDE METHOD ACCEPTANCE LIMITS.K5 BOD - DILUTION WATER D.O. DEPLETION WAS > 0.2 MG/L.K7 BOD - DISCREPANCY BETWEEN THE BOD AND COD. RESULTS VERIFIED BY REANALYSIS OF COD.K8 BOD - GLUCOSE / GLUTAMIC ACID BOD ABOVE METHOD ACCEPTANCE LEVELS.K6 BOD - GLUCOSE / GLUTAMIC ACID BOD BELOW METHOD ACCEPTANCE CRITERIA.W2 CALIBRATION - %RSD ABOVE 15%. AVE %RSD MET THE 20% CRITERIA IN EPA METHOD 8260B/2870C.W1 CALIBRATION - %RSD ABOVE 20%. AVE %RSD MET THE 20% CRITERIA IN EPA METHOD 8000B.V6 CALIBRATION - DATA FROM ONE-POINT CALIBRATION CRITERIAV2CALIBRATION - RECOV ABOVE METHOD ACCEPT LIMITS. ANALYTE DET. INSUFFICIENT SAMPLE TOCONFIRM.V3 CALIBRATION - RECOV ABOVE METHOD ACCEPT LIMITS. ANALYTE DET. SAMPLE NOT REANALYZED.V1 CALIBRATION - RECOV ABOVE METHOD ACCEPT LIMITS. TARGET ANALYTE NOT DETECTED.V7CALIBRATION - RECOV ABOVE METHOD CONTROL LIMIT. AVE %DIFFERENCE (% DRIFT) METMETHOD CRITERIA.V5CALIBRATION - RECOV AFTER GROUP OF SAMPLES ABOVE ACCEPT LIMITS. TARGET ANALYTE NOTDETECTED.V4CALIBRATION - RECOV BELOW METHOD ACCEPTANCE LIMITS. INSUFFICIENT SAMPLE TOREANALYZE.V8CALIBRATION - RECOV BELOW METHOD CONTROL LIMIT; AVE %DIFFERENCE (% DRIFT) METMETHOD CRIT.C7CONFIRMATION - 1ST & CONF RPD VARIATION >40%. MATRIX INTERFERENCE. REPORT LOWERVALUE.C6CONFIRMATION - 1ST & CONF RPD VARIATION >40%. NO MATRIX INTERFERENCE. REPORT HIGHERVALUE.C1 CONFIRMATION - ANALYSIS NOT PERFORMED AS REQUIRED.REVISED SEPTEMBER 2012 211
STANDARD OPERATING PROCEDURES FOR SURFACE WATER QUALITY SAMPLINGCodeC5C4C3VFFB2FB1DD4D2D3D1R10MR7R6R5R4R2R1R11JE4E5E3E2E1E8KEE7E6TRUJT4TWSOPCH1CH4Short Description of QualifierCONFIRMATION - NOT CONFIRMED, PAST HOLDING TIME.CONFIRMATION - PAST HOLDING TIME.CONFIRMATION - QUALITATIVE CONFIRMATION PERFORMED.CONTAMINATION - ANALYTE DETECTED IN BOTH ENVIRONMENTAL SAMPLE & ASSOCIATED BLANKS.CONTAMINATION - ANALYTE FOUND IN SAMPLE BLANK AS WELL AS SAMPLECONTAMINATION - FIELD BLANK TAKEN FOR ANALYTE, MINOR CONTAMINATIONCONTAMINATION - FIELD BLANK TAKEN FOR ANALYTE, NO CONTAMINATIONDILUTION - DILUTION FACTOR USED.DILUTION - MINIMUM REPORTING LEVEL ADJUSTED DUE TO SAMPLE AMOUNT.DILUTION - REQUIRED DUE TO HIGH CONCENTRATION OF ANALYTE.DILUTION - REQUIRED DUE TO INSUFFICIENT SAMPLE.DILUTION - REQUIRED DUE TO MATRIX INTERFERENCE.DUPLICATES - 1ST & CONF RPD VARIATION >40%. LOWER VALUE REPORTED - CHROMATOGRAPHICPROBLEMSDUPLICATES - DUPLICATE ANALYSIS OUTSIDE CONTROL LIMITSDUPLICATES - LFB/LFBD RPD > LAB CONTROL LIMIT, BUT RECOVERY MET ACCEPTANCE CRITERIA.DUPLICATES - LFB/LFBD RPD > METHOD CONTROL LIMIT, BUT RECOVERY MET ACCEPTANCECRITERIA.DUPLICATES - RPD > LAB CONTROL LIMIT, BUT RECOVERY MET ACCEPTANCE CRITERIA.DUPLICATES - RPD > METHOD CONTROL LIMIT, BUT RECOVERY MET ACCEPTANCE CRITERIA.DUPLICATES - RPD EXCEEDED THE LAB CONTROL LIMITDUPLICATES - RPD EXCEEDED THE METHOD CONTROL LIMIT.DUPLICATES - THE RPD CALCULATION FOR MS/MSD NOT USEFUL DUE TO THE VARYING SAMPLEWEIGHTS.ESTIMATEESTIMATE - ANALYTE BELOW LAB REPORTING LEVELESTIMATE - ANALYTE DETECTED BELOW LAB REPORTING LEVEL. NOT CONFIRMED BY ALT ANALYSIS.ESTIMATE - ANALYTE EXCEEDED CALIBRATION RANGE. NOT REANALYSED DUE TO HOLDING TIMES.ESTIMATE - ANALYTE EXCEEDED CALIBRATION RANGE. NOT REANALYSED DUE TO MATRIXPROBLEMS.ESTIMATE - ANALYTE EXCEEDED CALIBRATION RANGE. INSUFFICIENT SAMPLE TO REANALYZE.ESTIMATE - ANALYTE WAS NOT DETECTED; REPORTED TO MDL PER PROJECT SPECIFICATION.ESTIMATE - COMPOUND IS PRESENT, BUT BELOW LISTED VALUE (TYPICALLY, THE LAB DETECTIONLIMIT).ESTIMATE - ESTIMATED VALUE.ESTIMATE - INTERNAL STANDARD RECOVERIES DID NOT MEET LAB ACCEPTANCE CRITERIA.ESTIMATE - INTERNAL STANDARD RECOVERIES DID NOT MEET METHOD ACCEPTANCE CRITERIA.ESTIMATE - LAB REPORTED A TRACE VALUEESTIMATE - QUANT LIMIT ADJUSTED DUE TO BLANK CONTAMINATION / ANAL DEFICIENCIES.ESTIMATE - TENTATIVELY IDENTIFIED COMPOUND. CONCENTRATION ESTIMATED.ESTIMATE - VALUE IS LESS THAN DETECTION CRITERIAESTIMATE - VALUE IS LOWER THAN VALUE UNDER "T"FIELD - DEVIATIONS FROM STANDARD FIELD OPERATING PROCEDURES, ANALYTE-SPECIFICFIELD - EPA METHOD 1669 FIELD PROTOCOLS EMPLOYED W/ CLEAN LAB ANALYSISFIELD - EPA METHOD 1669 FIELD PROTOCOLS EMPLOYED W/ STANDARD LAB ANALYSISREVISED SEPTEMBER 2012 212
STANDARD OPERATING PROCEDURES FOR SURFACE WATER QUALITY SAMPLINGCodeCH3CH2H1H4H2H3HN3T1T2T3Q8Q9YQ10Q7Q1Q11Q6Q4Q2Q3Q5L1L3L2L4SM3M5M4Short Description of QualifierFIELD - MODIFIED EPA METHOD 1669 FIELD PROTOCOLS EMPLOYED W/ CLEAN LAB ANALYSISFIELD - STANDARD FIELD COLLECTION PROTOCOLS EMPLOYED W/ CLEAN LAB ANALYSISHOLDING TIME - ANALYSIS PERFORMED PAST HOLDING TIMEHOLDING TIME - EXCEEDED SAMPLE EXTRACTION HOLDING TIME, BUT ANAL HOLDING TIME OKHOLDING TIME - REANALYSIS FOR DILUTION WAS PAST HOLDING TIMEHOLDING TIME - RECEIVED AND ANALYZED PAST HOLDING TIMEHOLDING TIME EXCEEDEDMETHOD - ALL METHOD REQUIREMENTS MET.METHOD - APPROVED BY EPA, BUT NOT YET LICENCED BY ADHS.METHOD - APPROVED METHOD, BUT ANALYTE NOT INCLUDED IN THE METHOD COUMPOUND LIST.METHOD - NOT PROMULGATED EITHER BY EPA OR ADHS.QC - INSUFFICIENT SAMPLE TO MEET METHOD QC REQUIREMENTS, BUT BATCH QC REQUIREMENTSWERE MET.QC - INSUFFICIENT SAMPLE TO MEET METHOD QC REQUIREMENTS.QC - RATIOS OUSIDE ACCEPTABLE RANGEQC - SAMPLE IN INAPPROPRIATE SAMPLE CONTAINER.QC - SAMPLE INADEQUATELY DECHLORINATED.QC - SAMPLE INTEGRITY WAS NOT MAINTAINED.QC - SAMPLE IS HETEROGENEOUS. SAMPLE HOMOGENEITY COULD NOT BE ACHIEVED.QC - SAMPLE RECEIVED ABOVE RECOMMENDED TEMPERATURE.QC - SAMPLE RECEIVED AND ANALYZED WITHOUT CHEMICAL PRESERVATION.QC - SAMPLE RECEIVED WITH HEAD SPACE.QC - SAMPLE RECEIVED WITH IMPROPER CHEMICAL PRESERVATION.QC - SAMPLE RECEIVED WITHOUT CHEM PRESERVATION,. PRESERVED BY THE LAB.SPIKE - BLANK SPIKE RECOVERY ABOVE LAB ACCEPTANCE LIMITS.SPIKE - BLANK SPIKE RECOVERY ABOVE METHOD ACCEPTANCE LIMITS.SPIKE - BLANK SPIKE RECOVERY BELOW LAB ACCEPTANCE LIMITS.SPIKE - BLANK SPIKE RECOVERY BELOW METHOD ACCEPTANCE LIMITS.SPIKE - BLANK SPIKE SAMPLE RECOVERY OUTSIDE CONTROL LIMITSSPIKE - MATRIX SPIKE - ACCURACY REDUCED AS CONC IS DISPROPORTIONATE TO SPIKE CONC.SPIKE - MATRIX SPIKE - ANALYTE CONC. DETERMINED BY THE METHOD OF STANDARD ADDITION(MSA).SPIKE - MATRIX SPIKE - CONC DILUTED BELOW REPORT LIMIT. METHOD CONTROL SAMPLERECOVERY OKM6 SPIKE - MATRIX SPIKE - RECOVERY WAS HIGH (ADEQ POLICY 0154).M1SPIKE - MATRIX SPIKE - RECOVERY WAS HIGH. ACCEPTABLE METHOD CONTROL SAMPLE RECOVERY.M7 SPIKE - MATRIX SPIKE - RECOVERY WAS LOW (ADEQ POLICY 0154.000).M2S1S3S4S6S7SPIKE - MATRIX SPIKE - RECOVERY WAS LOW. ACCEPTABLE METHOD CONTROL SAMPLE RECOVERY.SUR RECOV - ABOVE LAB ACCEPT LIMITS. METHOD ACCEPTANCE LIMITS OK.SUR RECOV - ABOVE LAB ACCEPT LIMITS. METHOD ACCEPTANCE LIMITS OK. TARGET ANALYTE NOTDETECTSUR RECOV - ABOVE LAB AND METHOD ACCEPTANCE LIMITS. TARGET ANALYTES NOT DETECTEDSUR RECOV - BELOW LAB & METHOD ACCEPT LIMITS. REANALYSIS LOW RECOV DUE MATRIX EFFECTSUR RECOV - BELOW LAB & METHOD ACCEPTANCE LIMITS. UNABLE TO CONFIRM MATRIX EFFECT.REVISED SEPTEMBER 2012 213
STANDARD OPERATING PROCEDURES FOR SURFACE WATER QUALITY SAMPLINGCodeS5S8S10Short Description of QualifierSUR RECOV - BELOW LAB ACCEPTANCE LIMITS, BUT WITHIN METHOD ACCEPTANCE LIMITS.SUR RECOV - CALC NOT USEFUL DUE SAMPLE DILUTION. METHOD CONTROL SAMP RECOVACCEPTABLE.SUR RECOV - WAS ABOVE LAB & METHOD ACCEPTANCE LIMITS.S11 SUR RECOV - WAS HIGH (ADEQ POLICY 0154.000).S12 SUR RECOV - WAS LOW (ADEQ POLICY 0154.000).TABLE 10.4. Lab Data Qualifiers.Data that cannot be used <strong>for</strong> assessments is flagged using the "Assessment Comment"button. This is reserved primarily <strong>for</strong> data that is not scientifically defensible or doesnot meet credible data requirements. Currently only the Assessment Program can addthe flag and a comment about why the data is flagged.11. Repeat the process if additional parameters need to be entered.12. Save your work by clicking .10.5 CREATING NEW SITESAvoid establishing unnecessary sites by looking <strong>for</strong> existing sites in AZMAPPER, ArcMap orquerying the database. A new site should be established when it is hydrologically distinct fromexisting sites.A rule of thumb is that new sites can be created if they are more than 300 feet apart ona stream. The general rule is only meant to reduce redundant sites in the database.Hydrological differences that should be considered include confluences fromtributaries, springs, point source discharges or land use that might discharge pollutantsduring runoff events.10.5.1 PROCEDURE TO CREATE A NEW SITESteve Vogel (currently) creates all the sites <strong>for</strong> ADEQ. To create a site you will need to email himeverything on the Site In<strong>for</strong>mation Screen except <strong>for</strong> the Site ID and DEQ number (FIGURE10.9). He will create these. Everything in blue is required. Everything in white is optional.10.5.2 HOW SITES ARE NAMEDThe Site Identification Number (a.k.a. SITEID) is also used to identify a site. It has a distinctadvantage over the DEQ number by using a naming convention that describes a particular site.Lake and stream sites are each identified a little differently.Each surface water code abbreviation is unique within the watershed and within the surface watertype. For instance, “RED” can only be used <strong>for</strong> one stream in the Bill Williams <strong>Water</strong>shed.However, RED could also be used <strong>for</strong> a lake in the Bill Williams, and RED could be used <strong>for</strong>another stream in the Santa Cruz <strong>Water</strong>shed.REVISED SEPTEMBER 2012 214
STANDARD OPERATING PROCEDURES FOR SURFACE WATER QUALITY SAMPLING10.5.2.1 Stream Code AbbreviationsIf the site is on a stream or canal, the monitoring point is the “river mile” distance calculated fromthe streams mouth point (confluence with another stream or lake) up to the monitoring site,measured in miles. The river miles are shown as a 5-digit number with a decimal point to 100ths(e.g., 001.32).A stream site code contains a numeric river mile, along with the watershed and stream code. Forexample: VREVR012.21, is the East Verde River at 12.21 miles upstream from its confluence withthe Verde River.The three letter stream code is primarily derived from the first three letters of the name, except asstated below or to avoid duplications (e.g., Aluminum Creek might be ALU) The third letter is dedicated <strong>for</strong> the following stream names endingso C is dedicated to names ending in “Canyon.” It is not used <strong>for</strong> names ending inCreek (e.g., Chevelon Canyon = CHC) (C is also used <strong>for</strong> canals, see canalabbreviations below)o W is dedicated to names ending in “Wash” (Indian Bend Wash = IBW);o R is dedicated to names ending in “River” or “Run” (e.g., San Pedro River = SPR)o G is dedicated to names ending in “Gulch” (e.g., Alum Gulch = ALG); Use only the first letter of a common name (East, San, Little) (e.g., East Clear Creek =ECL) Ignore the word “Fork” (e.g., East Fork Black River = EBR) Use first letters of each word if three or more words (e.g., Copper Camp Wash = CCW) Use the number in the name (e.g., 3-Mile Creek = 3MI)Unnamed Streams – These are assigned codes on an as-needed basis (when sampling sites). The first code is always a “U” <strong>for</strong> unnamed stream. The next two letters are taken from the first two code letter used <strong>for</strong> the stream or lake it isdraining to. If unnamed tributary to an unnamed tributary, use “UU” and then a letter <strong>for</strong> the streamor lake it is draining into.For example: If Bitter Creek’s code is BTR, then the first unnamed tributary would be UBT. Thenext unnamed tributary would be UB1, then UB2, etc. If samples are collected on an unnamedtributary to an unnamed tributary to Bitter Creek, the code would be UUB.Duplicate Codes – If the abbreviation is already used <strong>for</strong> a stream within the watershed, do thefollowing in order, until a unique code is derived: Use the next consonant until all consonants in the name have been used, Use the next vowel until all vowels in the name have been used, Use a numberFor example, multiple unnamed tributaries to Pinto Creek became: UP1, UP2, UP3, UP4….REVISED SEPTEMBER 2012 215
STANDARD OPERATING PROCEDURES FOR SURFACE WATER QUALITY SAMPLING10.5.2.2 Lake Code AbbreviationsLake monitoring points are created by adding a dash and up to a 5 letter code abbreviation. Themost common lake sites are routinely given the following abbreviations: A = Dam site B = Mid lake MAR = Marina or -BR = Boat RampLake sites can also be given descriptive abbreviations. For example, a site on Roosevelt Lake nearPitney Picnic Grounds might be “- PIT.”The three letter lake code is primarily derived from the first three letters of the name, except asstated below or to avoid duplications (e.g., Alamo Lake = ALA). Ignore the word “Lake” if it is the first name of the lake (e.g., Lake Havasu = HAV) Use the first letter of the second name if multiple words (e.g., Soldier’s Annex Lake = SAL)If the abbreviation is already used <strong>for</strong> a lake within the watershed, do the following to derive aunique code: Use the next letter in the name or Use a number (last resort).10.5.2.3 Canal IDing and Code AbbreviationsCanals are special cases requiring unique protocols to identify monitoring points. River milemonitoring points cannot properly be applied to canals because the conventions associated withrivers are not consistent with canals. Consequently, a convention has been adopted <strong>for</strong> canal IDsthat uses a special descriptor with a mix of both text and integers <strong>for</strong> the monitoring point todistinguish canals from both streams and lakes.<strong>Water</strong>shed codes are applied to canal monitoring points as with any other site in the database.Codes are assigned to canals or their laterals, but not to drainage return flows. (The return flowsare not considered a “surface water” as defined by <strong>Surface</strong> <strong>Water</strong> Quality <strong>Standard</strong>s.) Canals codesare a composite of: The first code is a letter – generally the first letter of the name, The second code is a number from 1-9, and The letter C <strong>for</strong> canal.Example: Atwater Canal = A1CThe monitoring point <strong>for</strong> any canal follows the following protocol:Determine the cadastral section number the monitoring point falls within from a USGSquadrangle or other map source. The section number comprises the second and third characters ofthe monitoring point (single digit section numbers shall be prefaced with a “0”).REVISED SEPTEMBER 2012 216
STANDARD OPERATING PROCEDURES FOR SURFACE WATER QUALITY SAMPLINGDetermine the quarter (Q), the quarter-quarter (QQ), and the quarter-quarter-quarter (QQQ)section designation <strong>for</strong> the part of the section the monitoring point falls within. AZMapper has atool to assist with this operation. Generally, each successively smaller quarter is designated asfollows:“A” – Northeast quarter“B” – Northwest quarter“C” – Southwest quarter“D” – Southeast quarterThese three characters (<strong>for</strong> the quarter, quarter-quarter, quarter-quarter-quarter respectively)comprise the fourth, fifth, and sixth characters of the monitoring point.If the site is the first or only site within a unique QQQ <strong>for</strong> the canal water body ID and watershed,preface the monitoring point designation with an “X”. If the site is the second within the sameQQQ, preface the monitoring point with a “Q”. Either of these letters will occupy the firstcharacter of the monitoring point.For example, a fictitious monitoring point associated with the example code above might bedeveloped in the following fashion. If the monitoring point is the first in the extreme northwestQQQ of section 22 <strong>for</strong> the Middle Gila watershed, its code would be MG-A1C-X22BBB (dashesadded <strong>for</strong> illustration purposes only). A site on the Middle Gila’s portion of the Arizona Canalfalling just to the southwest of the center of Section 9 and the second one within the QQQ wouldbe MG-AZC-Q09CAAWhile it is theoretically possible that codes could be duplicated with this protocol, the likelihood isnot high that this would occur. As of 2010, only approximately 60 canal sites are recorded statewidein the WQDB. Following the protocol will yield unique and identifiable site ID codes withinherent locational in<strong>for</strong>mation content that differ in <strong>for</strong>mat from both stream codes and lakecodes.10.6 DATA MANAGEMENT QUALITY CONTROL10.6.1 OVERVIEW AND TIMEFRAMESAll data entered into the WQDB must undergo quality control. This is done by someone otherthan the sampler in a timely manner (30 days) so that the lab can rerun samples if there is aproblem. The quality control review includes everything fromlooking <strong>for</strong> odd values to seeing if there are any problems withblanks or duplicates. This process will be explained in detail below.Once the data has been reviewed the reviewer may approve the databy clicking the "Approve" button on the test results screen. Clicking the approval button will lockthe records from further editing and can only be unlocked by a supervisor.REVISED SEPTEMBER 2012 217
STANDARD OPERATING PROCEDURES FOR SURFACE WATER QUALITY SAMPLING10.6.2 DATA REVIEW PROCESSAt a minimum, the data review process must include the following steps: Check results versus water quality standards to see if there were any exceedances (Section10.6.2.1) Review data <strong>for</strong> suspicious values (unit errors, transcription errors, wrong STORET, etc.)(Section 10.6.2.2) Check split or duplicate values Check blank values Verify if electronic upload successful (if applicable) Update "EVENTS" Run the QC Report in WQDB (streams) Have all lab qualifiers been entered. Do the lab results match what was on the Chain of Custody/Lab Submittal <strong>for</strong>m and the<strong>Sampling</strong> and Analysis Plan? Approve the data in the WQDBFIGURE 10.21 shows an example data review <strong>for</strong>m used by the ambient stream program.REVISED SEPTEMBER 2012 218
STANDARD OPERATING PROCEDURES FOR SURFACE WATER QUALITY SAMPLINGFIGURE 10.21. WQDB entry checklist <strong>for</strong> quality control purposes.REVISED SEPTEMBER 2012219
STANDARD OPERATING PROCEDURES FOR SURFACE WATER QUALITY SAMPLINGREVISED SEPTEMBER 2012 220
STANDARD OPERATING PROCEDURES FOR SURFACE WATER QUALITY SAMPLING10.6.2.1 Determine and Report <strong>Surface</strong> <strong>Water</strong> Quality <strong>Standard</strong> Exceedances<strong>Water</strong> quality data should be reviewed and compared to surface water quality standards as soon aspossible after receipt of analytical results from the laboratory to determine whether there are anyexceedances of surface water quality standards.<strong>Surface</strong> water quality standards are located in Title 18, Chapter 11, Article 1 of the ArizonaAdministrative Code (A.A.C.). <strong>Standard</strong>s are available on the internet athttp://www.azsos.gov/public_services/Table_of_Contents.htm.Procedure to determine if there has been a <strong>Surface</strong> <strong>Water</strong> Quality Exceedance1. Determine applicable designated uses <strong>for</strong> the stream reach where the sample was collectedfrom Appendix B of the <strong>Surface</strong> <strong>Water</strong> Quality <strong>Standard</strong>s rules. This in<strong>for</strong>mation mayhave already been determined and placed in the <strong>Sampling</strong> and Analysis Plan. Manysurface waters are specifically listed in A.A.C. Appendix B by major river basin. Look tosee if the surface water that you sampled is listed in Appendix B. If the surface water yousampled is not listed in Appendix B, consult the tributary rule at A.A.C. R18-11-105 todetermine designated uses.2. Compare water quality data from laboratory report to the applicable water qualitystandards. Highlight any water quality standards that are exceeded. Remember tocompare water quality data to both acute and chronic aquatic life criteria. The standardsin FIGURE 10.21 are just some of the more common chemical parameters. The original(and most current) rule should be consulted to determine a specific standard.3. Note if any of the water quality standards exceedances were based on suspicious values orqualified data. Could any exceedance be related to natural background conditions?4. If an exceedance is of a surface water quality standard intended to protect human health(i.e., the domestic water source (DWS), fish consumption (FC), full body contact recreation(FBC) or the partial body contact recreation (PBC) designated uses) a Notice of Exceedanceletter (FIGURE 10.22) should be prepared and sent to the Director of the County HealthDepartment of the county where the sampling site is located and the property owner.Do not send notices to the County Health Director when the exceedance is <strong>for</strong> a waterquality standard to protect aquatic life.5. File a copy of the Notice of Exceedance in the site file and reading file. Add the event"Exceedance at Time of <strong>Sampling</strong>" to the sample page in the WQDB. This should be doneeven if the exceedance is <strong>for</strong> an aquatic use.REVISED SEPTEMBER 2012 221
STANDARD OPERATING PROCEDURES FOR SURFACE WATER QUALITY SAMPLINGFIGURE 10.22. Notice of Exceedance.10.6.2.2 Comparing Hardness Dependent <strong>Standard</strong>sWhen reviewing laboratory data special attention must be given when comparing the results to thesurface water quality standards that are hardness dependent. Several hardness dependent dissolvedmetal standards (copper, zinc, cadmium, and lead) may fall below standard method reportinglimits (MRL) at low hardness values. As an example, the dissolved copper (chronic aquatic andwildlife, warmwater) standard equals 9.94 ug/L at a hardness of 113 mg/L; the typical MRL <strong>for</strong>copper (EPA 200.7) is 10 ug/L. Additional examples are shown in TABLE 10.5 There<strong>for</strong>e a nondetectresult (ND) at a hardness of 113 mg/L may or may not be an exceedance. When laboratoryMRL values are above the applicable standard it may be appropriate to request estimated values toREVISED SEPTEMBER 2012 222
STANDARD OPERATING PROCEDURES FOR SURFACE WATER QUALITY SAMPLINGbe reported by the laboratory. These values, when entered into the database, would be assignedthe appropriate lab data qualifier. If data consistently is qualified a trace level analytical methodmay need to be sought.Dissolved Metal MRL (method) Hardness Value Applicable <strong>Standard</strong>Copper 0.010 (200.7) 113 0.00994Zinc 0.05 (200.7) 36 0.0493Cadmium 0.0010 (200.9) 228 0.00099Lead 0.005 (200.9) 188 0.00497Nickel 0.10 (200.7) 216 0.09977Silver 0.001 (200.9) 50 0.00098TABLE 10.5. Dissolved Metal <strong>Standard</strong> and MRL comparison. All units are mg/L. <strong>Standard</strong> based on A&Wchronic, except silver which is A&W acute.10.6.2.2 Review <strong>for</strong> Errors, Omissions, and Dubious or Unusual DataCompare the data entered to the hard copy files to be sure that the entries are accurate andcomplete. Contact the lab to verify data if necessary.Data review includes checking that: Sample times and dates are <strong>for</strong>matted correctly and lab and field data match (date, time,sites). Lab data are complete and no tests are missing. Correct decimal placement. No missing data. No erroneous values. All pertinent field comments were entered, using appropriate event codes and comments. All pertinent lab comments were entered, using appropriate lab data qualifiers. Appropriate "lab notations" were used and lab reporting limits and units were provided. Compared to prior records, no unusual or dubious data. Field measurements that are not representative of surface water conditions. Field measurements on equipment that was not functioning properly.Dubious or questionable data values are more easily identified when the data reviewer hasfamiliarity with past analytical results from the sample site. All results are scrutinized and anydubious or questionable values that are found are tracked back to the lab or field sheets <strong>for</strong>possible transcription errors or misreported values. Conversations with laboratory personnel maybe necessary to resolve the problem.Some field equipment readings are not representative of surface water conditions. Forexample, dissolved oxygen may be very low in a stream due to groundwater upwelling.Such data should be rejected and pulled from the database.Review field measurements collected with equipment that was not functioning properly. Adding acomment that the equipment was not functioning properly is probably not enough if the standardsREVISED SEPTEMBER 2012 223
STANDARD OPERATING PROCEDURES FOR SURFACE WATER QUALITY SAMPLINGwere not met. You should reject this data and delete it from the database. Note in the Eventsscreen which parameter was deleted and why.In select cases, where suspicious values are present have the test rerun. Keep a written record ofany values or comments that need further verification. You will need to follow up on these itemsbe<strong>for</strong>e the review is complete.If the data is rejected, normally the sample data should be removed from the database.But if the sample results are left in the database, contact the Assessment Program sothe data is clearly flagged as in the assessment comment field.Keeping and rejecting data is frequently a professional judgment. Recognize that such decisionsmay affect other programs and potentially even other agencies that use the data.10.6.2.3 Compare Results from Split and Duplicate SamplesPrecision <strong>for</strong> split and duplicate samples is determined by calculating a Relative Percent Difference(RPD), or coefficient of variation, of the duplicate samples. The smaller the RPD, the moreprecise the measurement is. The relative percent difference is calculated using the followingequation:( X1 X2)RPD 100( X X ) / 212Where X1 is the larger of the two values and X2 is the smaller of the two values.In general, acceptable relative percent difference between split or duplicate samples is 10 % or lessif the value of the results of the duplicate samples are greater than 2 times the method reportinglimit (MRL). Values at or near the detection limit may have a RPD greater than 10% and still beacceptable.Exceptions: Trace metals, Analytes whose averages are less than two times the MRL, and Splits/duplicates where one result is reported as a non-detect and the other value is abovethe detection limit.The trace metal values are reported in μg/L and are generally small. There<strong>for</strong>e, a slight variation innumbers may cause a one-hundred percent difference which would be non-indicative of a realproblem. A five-hundred percent difference may be more indicative of a true problem. Useprofessional judgment.Analytes close to the detection limit are also more likely to show a large percentage differencewhen the absolute magnitude of the difference is small. In these cases, the 10% rule of thumbshould be disregarded.REVISED SEPTEMBER 2012 224
STANDARD OPERATING PROCEDURES FOR SURFACE WATER QUALITY SAMPLINGWhere one duplicate or split is reported as a non-detect, and the other a value above the detectionlimit, ADEQ has adopted the ADHS protocol of acceptance of the duplicate or split results if thereported value in such a case is less than two times the detection limit.In select cases, where splits or duplicates have widely-differing results, have the testrerun.Rejecting Data Based on Duplicates or SplitsIn general data is acceptable if +/- 10% difference from the mean. This works <strong>for</strong> most cations,anions, and nutrients.As discussed above, a much larger variation is acceptable when working with trace metals, analyteswhose averages are less than two times the detection level, and splits or duplicates where one isreported as a non-detect.Unacceptable data should be removed from the database. All data <strong>for</strong> the parameterthat was unacceptable should be removed <strong>for</strong> the entire sampling run or batch.10.6.2.4 Determine if Equipment Blanks were “Clean.”Detection of contaminants in equipment blanks should be carefully noted with the data. If apollutant is detected in the equipment blank, an exceedance of that standard in the sample maynot be valid. Rejecting the data will depend on the level of contamination in the blank.Rejecting Data Based on Contaminated BlanksWhen blanks demonstrate that contamination occurred, the Project Lead must consider on a caseby-casebasis if the contamination is significant enough to reject the data. When deciding whetheror not the data need to be rejected the Project Lead should consider the following: If the objective is to detect minute changes in variable concentrations then even smalllevels of contamination reduce the ability to interpret the data with confidence. In the case where the contamination values approach the real data values, the datacollected during the particular sample trip may be invalid. If the purpose of the study is to monitor <strong>for</strong> large variations, then small levels ofcontamination are not significant. In this case, a correction of the data can be made(subtract blank data values from the sample data values to get the reported value).10.6.2.5 QC RatiosThe WQDB has a built in quality control report to determine various ratios and balances. Thereare two options <strong>for</strong> the report, dissolved and total. ADEQ typically uses the total concentrationsof cations and anions. As of September 2012, the WQDB QC Ratio report is not functioning.Use the ‘LiveWQDB.mxb’ <strong>Standard</strong> Methods QA Report instead.Do not censor or restrict the data use on the basis of the ratio alone. To reject thedata, you need corroborating evidence of a problem from another source (e.g., post-REVISED SEPTEMBER 2012 225
STANDARD OPERATING PROCEDURES FOR SURFACE WATER QUALITY SAMPLINGtrip calibrations out of bounds, field notes indicating equipment problems, labqualifiers, etc.). Exceeding holding times is not sufficient supporting evidence. If thedata is rejected, normally the sample data should be removed from the database. But ifthe sample results are left in the database, contact the Assessment Program so the datais clearly flagged.What to do when a ratio or balance is outside the "acceptable" value Check values in the database against the lab report <strong>for</strong> errors. Check to be sure that all the parameters needed to run the QC check are present. Check historic ratios at this site to determine if the ratio is normal <strong>for</strong> this site. Long-termsites have a compilation sheet showing historic QC values in the site file. Refer to thesheet <strong>for</strong> a determination of historic trend data. Check to see if the sample was collected under unusual conditions (i.e. flood, drought,incoming pollutants, high algae content, etc). This can potentially throw ion balances outof the acceptable range. Have the lab provide you with their ion balances as well as other internal checks that labsper<strong>for</strong>m to assure the quality of their data. If the lab has a problem with the ion balances,they will often state this on the cover sheet or in the remarks area provided on the labreports. Typically, if the lab has problems, they will have already tried to resolve them andhave found that they cannot be resolved. For the TDS/Conductivity ratio check bicarbonate and sulfate values to see if they areexceedingly high or low compared to past data at the site. Calculate the values by hand and see if the WQDB report is reporting the right value Call lab to check on reported lab values or have tests rerun. If all the checks still point to the data being outside the acceptable range then qualify thedata using the Event code in TABLE 10.2.FIGURE 10.23. QC Report screen.REVISED SEPTEMBER 2012 226
STANDARD OPERATING PROCEDURES FOR SURFACE WATER QUALITY SAMPLINGThe report provides the following in<strong>for</strong>mation.FIGURE 10.24. QC Report.10.6.2.5.1 Lab and Field Specific Conductivity RatioThe ratio between the field and lab specific conductivity = field conductivity ÷ lab conductivity. Unacceptable Below 0.90 Acceptable Between 0.90 and 1.10 Unacceptable Above 1.1010.6.2.5.2 Lab and Field pH RatioThe ratio between the field pH and lab pH = field pH ÷ lab pH Unacceptable Below 0.90 Qualified Between 0.90 to 0.95 Acceptable Between 0.95 to 1.05 Qualified Between 1.05 to 1.10 Unacceptable Above 1.10For example, if the field pH is 7.6 and the Lab pH is 7.1, then the ration is 7.6 ÷ 7.1 = 1.07. Thisratio is within the qualified range. The pH values should be investigated more closely, as adifference of 0.5 standard units represents a sizable shift in the acidic-basic character of the water.Further investigation is advised.Effluent dominated waters, industrial sewage, and other highly polluted samples willhave more problems with the pH ratio than ambient water samples. The pH of asample may change very rapidly if the sample contains large amounts of algae,microbes or air bubbles. Over-zealous churning of the churn splitter can also cause achange in pH by aerating a sample that may have been anaerobic when fieldmeasurements were taken. Floods or drought have little negative impact on thisQA/QC ratio.10.6.2.5.3 TDS and Specific Conductivity RatioREVISED SEPTEMBER 2012 227
STANDARD OPERATING PROCEDURES FOR SURFACE WATER QUALITY SAMPLINGThe TDS and Specific Conductivity Ratio = lab TDS ÷ lab conductivity. This ratio should rangefrom 0.55 to 0.75 (Hem, 1998). The reason this ratio is not equal to 1.0 is that some constituentsthat are reflected in the lab EC are not detected in the lab TDS.For example, if TDS is 388 and lab EC is 439, the ratio is 388 ÷ 439 = 0.88. Since the acceptablerange is between 0.55 to 0.75, this value is not acceptable without additional investigation.Some ambient waters in the state will consistently have values that fall outside thisratio. This is acceptable if the trend is established and obvious as observed in historicsample results.10.6.2.5.4 TDS and Calculated Sum of Constituent RatiosThe TDS and calculated sum of constituent ratios = lab TDS ÷ the sum of the major constituents(lab values <strong>for</strong> Ca, Mg, Na, K, SO 4 , F, NO 3 +NO 2 and Cl in mg/L plus hardness as CaCO 3 at 0.6times its reported value). An acceptable ratio is 1.0 to 1.2.For example:The sum of Ca+Mg+Na+K+F+(NO 2 +NO 3 ) +SO 4 +Cl = 108.5 mg/L,Hardness as CaCO 3 = 350 mg/LSum of major constituents = 108.5 + (0.6 * 350) = 318.5TDS = 388There<strong>for</strong>e the ratio is 388 ÷ 318.5 = 1.2This value falls at the limit of the range and is acceptable.10.6.2.5.5 Cation and Anion BalanceThe sum of five major cations should be roughly equivalent to the sum of six major anions in asample, when measured in milliequivalents per liter (meq/L).Cations: calcium, magnesium, sodium, potassium, and ammonia.Anions: fluoride, carbonate, bicarbonate, sulfate, chloride, and nitrate-nitrite.The cation/anion values are converted from mg/L (milligrams per liter) to meq/L by using thefollowing conversion factors obtained from <strong>Standard</strong> Methods <strong>for</strong> the Examination of <strong>Water</strong> andWastewater - 20th Edition.<strong>Standard</strong> Methods outlines the following acceptance criteria <strong>for</strong> ion balance calculations:Anion Sum (meq/l)Acceptable Difference0 - 3.0 meq +/- 0.2 meq/l3.0 - 10.0 +/- 2%10.0 – 800 +/- 5%TABLE 10.6. Acceptable differences <strong>for</strong> cation/anion ratios.REVISED SEPTEMBER 2012 228
STANDARD OPERATING PROCEDURES FOR SURFACE WATER QUALITY SAMPLINGSimply look at the last column of the WQDB report to determine if the cation/anion balance ismet. The cation, anion, percent difference, and absolute difference columns are there todocument the "YES!" or "NO:(".10.6.3 DATA APPROVALClicking the approval button is a statement by the reviewer that the data is ready to be sent on toSTORET, used <strong>for</strong> assessments, listing decisions, or TMDL development (FIGURE 10.24).Clicking the approve button also means the following: The data has been checked <strong>for</strong> exceedances. The data has been reviewed <strong>for</strong> errors, omissions and dubious or unusual data Results from duplicates and splits were compared. Results from blanks were assessed. The QC Ratio Report was run All the appropriate EVENTS and QUALIFIERS have been added.FIGURE 10.24. The approval button (upper right) locks the records in the test results screen.The records are locked once the data is approved. A supervisor must "unapprove" the data <strong>for</strong>changes to the records to be made.10.7 SITE FILESMonitoring site in<strong>for</strong>mation and data from the <strong>Surface</strong> <strong>Water</strong> Monitoring and the TMDL Unitsare contained in individual files <strong>for</strong> each sampling site. Sites are grouped by watershed. Individualsite files are housed on the 5th Floor at the central Phoenix office. Lateral file cabinets arededicated to housing the site files.10.7.1 SITE FILE CONTENTSEach site file should contain the following in<strong>for</strong>mation starting with the inside cover of the file.Site In<strong>for</strong>mation sheetThe Site In<strong>for</strong>mation sheet can be copied from the <strong>Water</strong> Quality Data Base. It will havein<strong>for</strong>mation regarding the site, such as the name of the site, DEQ Database number, site location,and, if applicable, a signed written permission <strong>for</strong>m from the property owner to enter the propertyand collect samples. Ownership of the land should not be assumed to be public land and shouldbe investigate during the reconnaissance stage of site selection.Road Log and MapREVISED SEPTEMBER 2012 229
STANDARD OPERATING PROCEDURES FOR SURFACE WATER QUALITY SAMPLINGA detail road log should be written during the reconnaissance stage of site selection. In addition,any special comments such as locked gates, 4x4 roads, or other access issues need to be attached tothe log.Correspondence/Exceedances Any miscellaneous correspondence with the property owner All correspondence on <strong>Surface</strong> <strong>Water</strong> Quality <strong>Standard</strong>s exceedances that apply to the site Any contractual or sampling agreements pertaining to the site All internal and external correspondence regarding the sitePhotographsArchive-quality slides, prints or digital images of site taken at each site visit. For sites with a lot ofphotos, consider taking a few representative photos and storing the rest on a CD.Biological DataAll field and taxonomy laboratory data sheets pertaining to macroinvertebrate or other biologicalcollections.Stream Channel Physical AssessmentsHabitat Assessment Field Data Sheet <strong>for</strong> Cold and Warm <strong>Water</strong> Streams, Stream EcosystemMonitoring Data Sheets and any other data sheets describing the physical condition of the streamchannel. Use EDAS to print out the habitat data <strong>for</strong> each site.Field Notes Field data sheets and field measurements from each site visit A flow calculation sheet Any historic copies of field notes from each site visit Sketches or diagrams representing the site<strong>Water</strong> Quality Chemical Data Located on inside back cover of site file All analytical laboratory data from each site visit <strong>Water</strong> Quality <strong>Standard</strong>s Exceedance and QA/QC check off sheet Cation/Anion report10.7.2 FILING SYSTEMThere are three separate filing systems <strong>for</strong> streams, lakes, and TMDL.Stream site files are filed in the lateral file cabinets by hydrologic basin. There are ten majorbasins:1. Colorado-Grand canyon (CG)2. Colorado-Lower Gila (CL)3. Little Colorado River Basin (LC)4. Verde River Basin (VR)REVISED SEPTEMBER 2012 230
STANDARD OPERATING PROCEDURES FOR SURFACE WATER QUALITY SAMPLING5. Salt River Basin (SR)6. Upper Gila River Basin (UG)7. Middle Gila River Basin (MG)8. San Pedro River Basin (SP)9. Santa Cruz River Basin (SC)10. Bill Williams River Basin (BW)Site files are sorted within each file cabinet drawer in alphabetical order by a 2 character basincode (e.g. UG <strong>for</strong> Upper Gila River) and a 3-character stream identification code (e.g. ETK). Sortstreams with the same name numerically by the river mile.Lake site files are organized by basin and then by lake.10.7.3 SITE FILE SECURITYSite files contain unique and irreplaceable in<strong>for</strong>mation, thus are kept in locked lateral file cabinetsto provide security against loss. The lateral file cabinets are located on the west wall on the 5thFloor. Access to the SWS site file cabinets is limited to SWS personnel and all others by specialarrangement. SWS staff is responsible <strong>for</strong> site files that are removed to their work areas. Theymust be returned and properly filed in alphanumeric order after usage.It is recommended that site files be returned to the file cabinet after one week. If files need to beused <strong>for</strong> a longer period of time, an “OUT CARD” should be placed in the file with the user’sname and cubicle number.10.7.4 SIGNING OUT FILESNon-SWS staff may check out site files to their work areas <strong>for</strong> an 8-hour work day, but the filesmust not be removed from the 5th floor and must be returned by 5:00 p.m. Files may be signedout from the <strong>Surface</strong> <strong>Water</strong> Section secretary or TMDL or Monitoring unit manager. An “OUTCARD” must be filled out with the date, name, telephone extension and cubicle number wherethe file will be kept during the work day.10.7.5 PUBLIC REVIEW OF SITE FILESThe data and in<strong>for</strong>mation in SWS site files are public records and they may be viewed by membersof the public upon request during regular business hours. Members of the public who wish toreview a site file must make arrangements with the ADEQ Records Center.10.7.6 RECORDS RETENTION AND ARCHIVING FILESMonitoring site files (chemistry and biocriteria) do not have a "destruction date" in accordancewith our retention schedule (FIGURE 10.25). This means that facility data should be kept withthe file throughout time. Old data can be shipped to the State Archives. See the section secretary<strong>for</strong> the appropriate <strong>for</strong>ms and instructions <strong>for</strong> archiving files.REVISED SEPTEMBER 2012 231
STANDARD OPERATING PROCEDURES FOR SURFACE WATER QUALITY SAMPLINGFIGURE 10.25. Records retention schedule.REVISED SEPTEMBER 2012 232
STANDARD OPERATING PROCEDURES FOR SURFACE WATER QUALITY SAMPLINGAPPENDIX A CHECKLISTSAMBIENT STREAMSLAB/OFFICEMetersHydrolab/YSI (need barometer?)Dissolved Oxygen Titration KitChlorine MeterThermometerSample EquipmentSample Bottles : per site-1 wide mouth-2 one litter small mouth-3 500ml small mouthBottles <strong>for</strong> a Duplicate or Blank(blanks need DI water)TubingFiltersGlovesNitric Acid and StickersSulfuric Acid and StickersTapeBacteriaIncubatorSealerBottlesTraysReagentsBlack LightOffice SuppliesClipboard (Pens and Pencils)Field FormsCamera (Extra AA Bateries)Truck Keys/ Bluebook/Gas CardMapsLab Forms and Tracking NumberGPS (Extra AA Batteries)Sample Plan and SOPsCAGEMetersTurbidityFlow MeterSample EquipmentGeo PumpWading RodMeasuring TapeDH-81 Rod and NozzleChain PinsFloat BottleFlaggingIce ChestsChurn SplitterBackpack, Bucket, or Duffel BagWaders, Hip Boots, or IrrigationBootsFirst Aid/ SafetyFirst Aid KitShovelDrinking <strong>Water</strong>Bug RepellantCell or Satellite PhoneBug SuppliesBug NetBucket and SieveWide Mouth Bug JarsAlcoholBug Bag (pebble count ruler, densitometer,watch, spoon, tape, and labels)REVISED SEPTEMBER 2012 233
STANDARD OPERATING PROCEDURES FOR SURFACE WATER QUALITY SAMPLINGLAKESOfficeDetermine depth of lake, if possible,so you can decide which length ofrope to bringCurrent or historical problems at thelake?Lake mapList of site ID names and GPSlocationsPlan # of samples to take at each siteand order bottlesReserve truckMake reservationsPaperwork and LogisticsClipboardSite files/mapsField <strong>for</strong>msTruck logbookTruck keys and Gas cardPontoon keysRouting <strong>for</strong>m/float planChain of custody and lab <strong>for</strong>msTracking, PCA, and Index #sPermission FormsAZ AtlasForest Service mapsLabelsTable <strong>for</strong> DO/elevationTape <strong>for</strong> labelsExtra pencils, pens and sharpiesSOPsPersonal GearHip or chest wadersSeal skin glovesHand sanitizerSafetyFirst Aid kitLife jacketsSunscreenBug repellantDrinking waterRain gearSquincher drinkSatellite phoneVHF radioFlashlightTool boxFire extinguisherFiltered metalsTubingCapsule filtersGeopumpBattery if using geopumpMetersYSIYSI cableBarometer if using the Hydrolab<strong>Sampling</strong> EquipmentSecchi disk with sufficient ropeDepth finderBeta bottle with sufficient ropeSediment corer or Eckman dredgewith sufficient ropeSediment scoopsSediment glass containerSediment noses piecesSediment catchersGPSCameraIce chests with iceBacteria incubatorBacteria sealerBacteria bottlesBacteria additiveBacteria traysBlack lightWhirlpacksREVISED SEPTEMBER 2012 234
STANDARD OPERATING PROCEDURES FOR SURFACE WATER QUALITY SAMPLINGPlastic bags <strong>for</strong> sample bottlesGarbage bags<strong>Sampling</strong> bottlesDuplicate sampling bottlesAcid stickersAcidMeasuring tapeExtra batteriesBoat EquipmentAnchorExtra ropeAdapterBoat lockBleach <strong>for</strong> de-contaminationOarsMotor flushInflatable RaftPumpSeattrawling motorBattery and battery coverBattery chargerAluminum boat2” ball hitch2 stroke Outboard motor oilPontoonKeysGet gasHitch with 2” drop if taking a Ford250, 2” ballTMDL - GENERALOffice and PaperworkField data sheetsCell/satellite phoneField notebookLaptop (with necessary cables)Keys (equipment and access)SAP (site maps, safety plan)Digital CameraClipboard (pens, Sharpies)GPSEquipment manualsWeather radioCopies of routing <strong>for</strong>mTracking # __________P.O #______________Index #____________Personal GearHip or chest wadersIrrigation bootsSeal skin glovesRain GearPFDSafetyREVISED SEPTEMBER 2012 235
STANDARD OPERATING PROCEDURES FOR SURFACE WATER QUALITY SAMPLINGFirst Aid kitSunscreenBug repellantDrinking waterSquincher drinkTool boxHand sanitizerFiltered metalsTubingCapsule filtersNitric acid vialsSample Bottles1-liter bottlesSSC bottlesSpecialty bottlesClean metalsAutosampler bottlesEquipment from CageShovel5-gal bucketFlow Meter (SN_________)Wading rodHydrolab (SN_________)Turbidity Meter (SN_________)DH-81 rod, nozzle, and capGeopumpIce chest(s)Tape measureSteel ArrowsRopeBackpack(s)<strong>Water</strong> Laboratory SuppliesDI CarboyField BoxGlovesBuffer solutionsBatteriesZiploc BagsGarbage bagsCubitanersREVISED SEPTEMBER 2012 236
STANDARD OPERATING PROCEDURES FOR SURFACE WATER QUALITY SAMPLINGSulfuric acid vialsAutosampler batteriesBacteriaBacteria incubatorBacteria sealerBacteria bottlesBacteria additiveBacteria traysBlack lightInverterIceTMDL - AUTOSAMPLERPre-trip - Make sure equipment to install is functioning properly be<strong>for</strong>e leaving ADEQ Tools Drill with appropriate drill bits Generator with extension cord and gas Tool kit Anchor bolts Clamps (2” fence post <strong>for</strong> 2” well casing/float switch, 1” PVC U or C-clamps <strong>for</strong> securing1” PVC tubing) Saws Sledgehammer Wire crimpers Wire nuts Electrical tape Wire cable, ferrules, and swag Extra wireAutosampler specific Autosampler New pump and distributor arm tubing installed <strong>for</strong> each deployment Bottles (Bottle racks and bags if using disposable bottle packs) Intake tubing Charged Battery(ies) Bottle retaining ring Intake strainer ½ cables if needed <strong>for</strong> float switches Padlock Cable to lock autosampler to tree, etc. Cable(s) to secure autosamplerREVISED SEPTEMBER 2012 237
STANDARD OPERATING PROCEDURES FOR SURFACE WATER QUALITY SAMPLINGCeramic knifeAutosampler program1” PVC pipe (glue, caps, elbows)Float switchLevel/Stage Logger specificLevel loggerLaptop to program logger2” PVC well screen (caps, elbows)1” PVC pipe (glue, caps, elbows)Equipment Enclosure (outdoor electrical box, etc.)CameraGPS, unless existing siteSURVEYING EQUIPMENT Laser level Extendable Rod Laser receiving unit Tripod Rolls of flagging Stake flags Field data sheets GPS-Garmin GPS-GeoExplorer Auto Levels Rods & rod levels Measuring tape reel , 1/10 ft Cross-section and caps Short & long-handled sledgehammers Machetes Tightening strap and chaining pin Bank pins Toe pins and caps Scour chains, duckbills, and driver Boltcutters DH-76 or DH-74 SSC sampler w/ glass jars 3" Helly Smith bedload sampler w/ 500micron mesh bag Bedload jars or bags 6" Helly Smith bedload sampler w/ 500micron mesh bag A" and "B" reels <strong>for</strong> use on cableways Shovels, monuments, galvanized steel pipe and concrete Bucket setup <strong>for</strong> bar samples Set of sieves and scale Lathe stakes BEHI equipment (16' rod, meter stick w/ line level, angle measure or calculator)REVISED SEPTEMBER 2012 238
STANDARD OPERATING PROCEDURES FOR SURFACE WATER QUALITY SAMPLINGMetal tagsWalkie talkiesClipboards w/ reference documentsDigital camera or 35mm CameraREVISED SEPTEMBER 2012 239
STANDARD OPERATING PROCEDURES FOR SURFACE WATER QUALITY SAMPLINGAPPENDIX B MACROINVERTEBRATE LAB REQUIREMENTSThe procedures followed at the consultant taxonomic laboratory are not part of the fieldprocedures <strong>for</strong> collecting and preserving macroinvertebrate samples. However, this section isincluded to explain practices and requirements <strong>for</strong> documentation and future reference.SAMPLE RECEIPTUpon receipt of the samples, the laboratory will check and adjust the preservation in each sample,catalog the samples, check the attached inventory <strong>for</strong> accuracy, and sign the chain of custodypapers. The consultant will then notify ADEQ of the receipt of samples, any damaged samples, ordiscrepancies between the inventory and actual sample labels.SAMPLE PROCESSINGSamples must be sorted to separate the invertebrates from the sample matrix. The entire sampleshould be floated in water in a white plastic tray. Large debris is rinsed and removed from thesample until all organic matter and invertebrates are floated off the mineral residue. The mineralresidue is then searched <strong>for</strong> stone-cased caddisflies and mollusks.SUB-SAMPLINGArizona samples typically contain thousands of invertebrates and must be sub-sampled into equalsquares <strong>for</strong> results to meet a minimum count of 500 organisms. A Caton Tray is be used torandomly obtain fractions of the total sample from which all the invertebrates are removed andcounted. Additional fractions are selected until the 500 target level is reached after which thenumber of squares subsampled are recorded. Terrestrial insects and non-benthic insects (e.g.corixidae, other swimmers, mosquitoes, or surface tension dwellers) should not be included in thecount. Additional fractions are examined if one fraction is dominated by a single species. Afterthe target number of specimens has been achieved, the entire unsorted sample is scanned <strong>for</strong> largeor rare taxa, which may aid in identification of smaller instars or may expand the taxa list <strong>for</strong> thatsample. The remaining unsorted sample is re-preserved with 70% ethanol in individual containersand archived at the laboratory <strong>for</strong> one year from the date of sample receipt, after which time thelaboratory will contact ADEQ prior to disposal.SORTINGThe sorting of invertebrates from the sample matrix shall be per<strong>for</strong>med by trained technicians,using dissecting scopes with a minimum magnification of 6X. After identifications have beenmade, the sorted specimens, including the separated Chironomidae, should be archived <strong>for</strong> oneyear or incorporated into the reference or voucher specimen set. The laboratory shall keep logs <strong>for</strong>each sample sorted, the fraction sorted, sample matrix problems, etc. in addition to bench sheetsof the taxa identified in each sample.REVISED SEPTEMBER 2012 240
STANDARD OPERATING PROCEDURES FOR SURFACE WATER QUALITY SAMPLINGSORTING EFFICACYThe laboratory shall check the sample residues to insure a sorting efficacy of 95% or better. Astatement of sorting efficacy <strong>for</strong> the ADEQ batch of samples should be presented in the laboratoryreport.TAXONOMIC IDENTIFICATIONInvertebrate identifications shall be per<strong>for</strong>med by a trained and experienced taxonomist. Thetaxonomy contractor is responsible <strong>for</strong> obtaining the most accurate, consistently achievableidentifications <strong>for</strong> ADEQ samples. Specialists are used as needed to obtain identifications to thegeneral taxonomic levels listed in TABLE 1. The specific identifications are presented on theADEQ Macroinvertebrate Master Taxa List (TABLE 2).Invertebrate GroupAquatic insectsChironomidaeSemi-aquatic insectsArachnida (Mites)Cladocera, Copepoda, OstracodaAmphipoda, Decapoda, IsopodaNematoda, NematomorphaTurbellariaAnnelidaLevel of taxonomy requiredGenus or species, where consistently identifiableGenus levelFamilyClassClassClassPhylumClassClassMolluscaFamily or GenusTABLE 1. ADEQ Taxonomic levels of identification <strong>for</strong> macroinvertebratesREFERENCE COLLECTION AND STORAGEA set of reference or voucher specimens shall be prepared from the batch of samples each year <strong>for</strong>incorporation into ADEQ’s reference specimen collection. The reference specimen collection ismaintained <strong>for</strong> several reasons: 1) the voucher collection supports all research conducted by theDepartment, 2) <strong>for</strong> per<strong>for</strong>ming interlaboratory taxonomy QC checks on voucher specimens, and 3)<strong>for</strong> training and in-house taxonomic identifications. Several specimens shall be preserved <strong>for</strong> eachnew taxon and the best or largest larval instars of other taxa shall be preserved to represent the taxafound that year and to update the historic reference collection at ADEQ. The Contractor shallmake recommendations <strong>for</strong> archiving any important specimens, if verification of identification bynational specialists is required.REVISED SEPTEMBER 2012 241
STANDARD OPERATING PROCEDURES FOR SURFACE WATER QUALITY SAMPLINGREPORTINGLaboratory reports containing taxonomic identifications and counts <strong>for</strong> all samples <strong>for</strong> that yearshall be submitted to ADEQ in electronic <strong>for</strong>mat. The electronic data shall be submitted inACCESS database <strong>for</strong>mat or Excel spreadsheets <strong>for</strong>matted <strong>for</strong> database uploading. TheContractor shall per<strong>for</strong>m quality control checks on the electronic data prior to submittal toADEQ. The data set should contain at a minimum the Station Identification (ID), waterbodyname and location, habitat, collection date, laboratory tracking number, complete taxa ID fromphylum to lowest level ID, raw number of individuals, and the portion of sample analyzedincluding field splits where applicable, and adjusted final counts, which are corrected <strong>for</strong> subsamplesize and field splits. Other attribute data should also be provided <strong>for</strong> any new taxa whichare not currently in ADEQ’s EDAS database, such as tolerance value, functional feeding group,and habit.QUALITY CONTROL TASKSADEQ may conduct Laboratory audits as needed. ADEQ may also periodically request thelaboratory to examine quality control reconstituted samples or voucher specimens from anotherlab and produce a short letter regarding the accuracy of identifications.QUALITY CONTROL FIELD AND LABORATORY PROCEDURESQuality control procedures <strong>for</strong> macroinvertebrate sample collection consist of controls inequipment type, sampling methodology, selection of appropriate sampling habitats andtimeframes, replicate sampling, detailed sorting and subsampling lab methods, use of taxonomyspecialists <strong>for</strong> macroinvertebrate identifications, and re-identification of samples in the lab. Adetailed list of these biological field and laboratory quality control procedures and per<strong>for</strong>mancecharacteristics is provided in TABLE 3.In addition to these QC procedures, a decontamination protocol <strong>for</strong> macroinvertebrate fieldcollection equipment has now been added to this document to prevent transport of biologicalagents among streams. The D-frame dip net, bucket, and sieve should be rinsed and scrubbed witha brush to dislodge small invertebrates, egg masses, and organic material, prior to leaving any givensite and all sampling equipment should be sprayed with an acetic acid (vinegar) or bleach solutionto decontaminate equipment.Procedure<strong>Sampling</strong> devicePer<strong>for</strong>manceCharacteristicPrecision - repeatability ina habitatBias - exclusion of certaintaxa (mesh size)Interferences -matrix/physicallimitationsDescriptionThe D-frame dip net is a good choice <strong>for</strong> use in Arizona streams, as it canbe used in riffle habitats with virtually all substrate sizes. The precision ofsampling with this net is repeatable because a timed sampling ef<strong>for</strong>t isused which applies across different stream substrate types.The D-frame sampler is outfitted with a 500 mesh size net opening,which retains organisms of a consistent size <strong>for</strong> identification.Excess filamentous algae can foul a sample, but it is considered part ofthe organic matter of a sample and is packaged with the biologicalsample.REVISED SEPTEMBER 2012 242
STANDARD OPERATING PROCEDURES FOR SURFACE WATER QUALITY SAMPLINGProcedure<strong>Sampling</strong> methodField SampleProcessingPer<strong>for</strong>manceCharacteristicPrecision - variable metricsor measures amongreplicate samples at a siteBias - exclusion of certaintaxa or habitatsPer<strong>for</strong>mance range -limitations in certainhabitats or substratesInterferences - high riverflows, training ofpersonnelBias - efficiency of locatingsmall organisms in sampletransferPer<strong>for</strong>mance range -sample preservation andholding timeInterferences - WeatherconditionsAccuracy - of sampletransfer process andlabelingDescriptionMeasurement error is quantified by replicate sampling at 10% of oursampling sites each year. Samples are processed and analyzed separatelyand their metrics and IBI score compared to obtain a measure of themethod precision. This is an estimate of the precision of the entiremethod which includes variability due to small-scale spatial variabilitywithin a site, operator consistency and bias, and laboratory consistency.Riffle only, 500 mesh sizeRiffle only, sample edge vegetation <strong>for</strong> sandy substrates riffles<strong>Sampling</strong> not per<strong>for</strong>med during high flows <strong>for</strong> safety reasons. Themethod has only been tested on a limited basis <strong>for</strong> large river sampling.The sieve is carefully rinsed after straining a sample. The sieve is washedprior to leaving a sample site.Sample preserved with isopropanol and capful of <strong>for</strong>malin <strong>for</strong> betterpreservation in Arizona heat. Formalin also allows longer holding time.Sample taking maybe per<strong>for</strong>med during light rains and slightly elevatedflows, but not during bankfull or greater flows.There is a standard <strong>for</strong>mat <strong>for</strong> sample labels which includes streamname, site id, date, habitat sampled, collector info, whether sample wasfield split and # of jars in sample.TABLE 3. Biological field quality control procedures and per<strong>for</strong>mance characteristics.BIOASSESSMENTS AS APPLIED TO PROJECTS BY OTHER ENTITIES(NPDES PERMITS)The application of bioassessments to projects by other entities than ADEQ must adhere to thefollowing requirements:A bioassessment should occur concurrently with ambient water monitoringA bioassessment survey plan should be completed and submitted to ADEQ by December31st of each year. The plan should contain sample dates, locations of background andstudy sites, sampling personnel and qualifications, name and location of contractlaboratory, biological and habitat sampling protocols and method of analysis ADEQ sampling and analysis protocols should be followed as closely as possible whileusing the most updated Quality Assurance Program Plan Laboratory protocols should follow ADEQ recommendations in TABLE 4The bioassessment report should be submitted to ADEQ <strong>for</strong> review. The report shouldcontain: an executive summary, introduction, study area description table, including mapsand photos, methods, results and discussion, literature cited, and appendices withcomplete taxa lists and copies of completed field <strong>for</strong>ms <strong>for</strong> each site. The results anddiscussion section should cover a physical characterization of the sites, a habitatREVISED SEPTEMBER 2012 243
STANDARD OPERATING PROCEDURES FOR SURFACE WATER QUALITY SAMPLINGassessment, water quality, fish and wildlife, macroinvertebrates, and long term trends at thestudy sites.Macroinvertebrate analyses should contain: a list of taxa and abundances, the calculatedwarm or cold water IBI score, the benthic habitat score, and graphs indicating acomparison of reference and study site IBI scores <strong>for</strong> the current year, changes in thereference and study IBI scores over a permit period and changes in the reference and studysite habitat scores or habitat values over the permit period.The first bioassessment shall be subject to a quality assurance review to be conducted byADEQ. The voucher specimens from the laboratory should be submitted to ADEQ <strong>for</strong> aquality control review of the taxonomic identifications by the ADEQ contract taxonomist.Major revisions should be incorporated into the final bioassessment report.ProcedureLaboratorysampleprocessingTaxonomicenumerationPer<strong>for</strong>manceCharacteristicPrecision - split samplesBias - sorting certaintaxonomic groups ororganism sizeInterferences - distractions,equipmentAccuracy - sorting method,lab equipmentPrecision - split samplesBias - counts andidentifications <strong>for</strong> certaintaxonomic groupsInterferences -appropriateness oftaxonomic keysSensitivity - level oftaxonomy related to type ofstressorAccuracy - identificationand countsDescriptionDuplicate samples are collected at the rate of 10% of the total # of samplesduring each year's index period. This is a test of the labs ability to createconsistent IDs.Large specimens are removed first from the sample. All organisms,regardless of size are sorted <strong>for</strong> ID from each 1/32 section of the sample.Field and lab equipment, such as sieves and nets, are thoroughly washedbetween sites and samples.Caton Tray used <strong>for</strong> consistent method of sorting samples, especially wherethousands of insects per sample are found.The similarity of duplicate samples is verified using the Arizona warm waterand cold water IBI's, rather than the individual taxonomic identifications.Our taxonomist offers 500 counts of insects per sample, which exceeds thenumber of specimens counted by many other states. Where a particular taxais dominant in the sample, that taxon is not included in the 500 count.Our laboratory has used a number of nationally recognized specialists toprovide confirmed identifications of specimens <strong>for</strong> our reference/vouchercollection.List of taxonomic keys used by our laboratory is included in our SOP's.Our standard taxonomic ef<strong>for</strong>t (identifications to genus in most cases, withmidges at family level) is generally used <strong>for</strong> all samples. Identification ofChironomidae to genus can be done on an as-needed basis <strong>for</strong>samples/sites found to be impaired.Use of nationally recognized specialists to create the Arizona referencecollection, by which all other samples are identified.TABLE 4. Biological laboratory quality control procedures and per<strong>for</strong>mance characteristics.REVISED SEPTEMBER 2012 244
STANDARD OPERATING PROCEDURES FOR SURFACE WATER QUALITY SAMPLINGAPPENDIX C WATERSHED DELINEATION METHODThis tool allows the user to select a point of interest on the screen and automatically create ashapefi1e displaying the watershed area in square miles above that point.To run the tool:1. Start Grid from the start button in Windows (Programs-ArcGIS-ArcInfo WorkStation-Grid).2. Position the command window at the bottom of your desktop and reduce the size so thatonly 3 or 4 lines will be seen.3. At the prompt, type in:&r s:\common\WDRs\AMLs\delinapNote the space after the "r".REVISED SEPTEMBER 2012 245
STANDARD OPERATING PROCEDURES FOR SURFACE WATER QUALITY SAMPLING4. You should see a small menu appear on top of the GRID display window in the leftcorner.(Steps listed on menus other than the "Zoom" option must be followed sequentially <strong>for</strong> a successfuldelineation.)5. Click the Display menu and select "Set Variables". This sets pathnames <strong>for</strong> the locations ofgrids and coverages needed to display and work with the watersheds.6. Select the "Display watershed" option from the Display menu. A sidebar menu will beinvoked. Select one of the ten ADEQ-defined watersheds in the state. The digital elevationmodel <strong>for</strong> the watershed will be displayed, along with stream networks, towns, and majorroads. Streams defined in blue have a minimum threshold watershed size defined (thusconstituting the more major water bodies). Streams defined in red do not meet thethreshold size. The color difference was included to help the user gain an orientation whilenavigating within the watershed.7. Once the watershed has loaded, the user may zoom to the area of interest using one of theoptions in the Zoom menu. Options include: Zoom in (2X) Zoom out (2X) Pan (recenters about the point clicked) Zoom window Zoom extent (returns the view to the entire watershed)REVISED SEPTEMBER 2012 246
STANDARD OPERATING PROCEDURES FOR SURFACE WATER QUALITY SAMPLING8. Select the Delineate menu choice. Select the only item on this menu: "Select delineationpoint"9. Control will be transferred to a set of crosshairs on the GRID display window. Set yourcrosshairs on the stream point you wish to delineate from. (Note: A 200 meter allowancehas been built into the delineation command, so that selection of a point within this rangewill find the corresponding stream and delineate accurately.) Click once on the point youwish to choose.You must then press '9' on your number keypad to signal GRID that the interactiveinput is complete. The watershed will begin delineating.10. Watch the prompts on the command screen. After a successful delineation, the displaywindow will recenter and zoom to the extent of the delineated watershed, and a coloredpolygon will be laid over the relief map. Hit "Enter" to proceed with the rest of theprogram.11. The Grid display window will close, and after a few commands execute, the user will beprompted to enter the DEQ site number on the Grid command line. Enter this value.You can also just enter 999999.12. The user will then be prompted to enter the DEQ Site lD. Enter this value as well. Noquotes are necessary.REVISED SEPTEMBER 2012 247
STANDARD OPERATING PROCEDURES FOR SURFACE WATER QUALITY SAMPLINGUse underscores instead of periods. Ex:: LCNUT012.99 will be typed in asLCNUT012_9913. The rest of the program should execute without problems, and the user will be returned tothe Arc command line. Close the menu remaining, and enter 'q' to quit Arc INFO.14. Created shapefiles are deposited in the following directory:S: \common\watersheddatarepositories\WSGenShapefiles.Shapefiles will carry basic identifying in<strong>for</strong>mation, area in square meters, and area in square milesin their attribute tables. Shapefiles are then available <strong>for</strong> independent use <strong>for</strong> other GISapplications or analyses, or <strong>for</strong> importing/loading into the watershed data repositories.REVISED SEPTEMBER 2012 248
STANDARD OPERATING PROCEDURES FOR SURFACE WATER QUALITY SAMPLINGAPPENDIX DSTORET CODESThis appendix contains common STORET codes, arranged alphabetically by parameter name. It isnot a complete listing. If you have access, it is preferable to use the “SW STORET” look-up tablein the <strong>Water</strong> Quality Database.STORETCODETo choose a STORET code, the parameter name, unit, media, and analysis type mustall be correct.PARAMETER NAME UNIT MEDIAANALYSISTYPE50624 (1S*,2R*,5R*,7S*)-2,4-DIMETHYL-7-ETHYL-6M8-DI, TOTAL WATER UG/L <strong>Water</strong> Total77562 1,1,1,2-TETRACHLOROETHANE, TOTAL WATER UG/L <strong>Water</strong> Total34506 1,1,1-TRICHLOROETHANE TOTAL WATER UG/L <strong>Water</strong> Total34516 1,1,2,2-TETRACHLOROETHANE, TOTAL WATER UG/L <strong>Water</strong> Total77652 1,1,2-TRICHLORO-1,2,2-TRIFLUOROET, TOTAL WATER UG/L <strong>Water</strong> Total34511 1,1,2-TRICHLOROETHANE, TOTAL WATER UG/L <strong>Water</strong> Total34496 1,1-DICHLOROETHANE, TOTAL WATER UG/L <strong>Water</strong> Total34501 1,1-DICHLOROETHYLENE, TOTAL WATER UG/L <strong>Water</strong> Total77168 1,1-DICHLOROPROPENE, TOTAL WATER UG/L <strong>Water</strong> Total99941 1,2,2-TRICHLORO-1,2-DIFLUOROETHANE UG/L <strong>Water</strong> Total77613 1,2,3-TRICHLOROBENZENE, TOTAL WATER UG/L <strong>Water</strong> Total77443 1,2,3-TRICHLOROPROPANE, TOTAL WATER UG/L <strong>Water</strong> Total77221 1,2,3-TRIMETHYLBENZENE, TOTAL WATER UG/L <strong>Water</strong> Total77734 1,2,4,5-TETRACHLOROBENZENE, TOTAL WATER UG/L <strong>Water</strong> Total34551 1,2,4-TRICHLOROBENZENE, TOTAL WATER UG/L <strong>Water</strong> Total77222 1,2,4-TRIMETHYLBENZENE, TOTAL WATER UG/L <strong>Water</strong> Total34556 1,2,5,6-DIBENZANTHRACENE. TOTAL WATER UG/L <strong>Water</strong> Total77651 1,2-DIBROMOETHANE, TOTAL WATER UG/L <strong>Water</strong> Total34536 1,2-DICHLOROBENZENE, TOTAL WATER UG/L <strong>Water</strong> Total34531 1,2-DICHLOROETHANE, TOTAL WATER UG/L <strong>Water</strong> Total32103 1,2-DICHLOROETHANE, TOTAL WATER, UG/L UG/L <strong>Water</strong> Total34541 1,2-DICHLOROPROPANE, TOTAL WATER UG/L UG/L <strong>Water</strong> Total82626 1,2-DIPHENYLHYDRAZINE, WATER, TOTAL RECOVERABLE, UG/L <strong>Water</strong> TotalUG/L77226 1,3,5-TRIMETHYLBENZENE, TOTAL WATER, UG/L UG/L <strong>Water</strong> Total34566 1,3-DICHLOROBENZENE, TOTAL WATER UG/L UG/L <strong>Water</strong> Total77173 1,3-DICHLOROPROPANE , TOTAL WATER, UG/L UG/L <strong>Water</strong> Total77163 1,3-DICHLOROPROPENE-1, TOTAL WATER, UG/L UG/L <strong>Water</strong> Total34571 1,4-DICHLOROBENZENE, TOTAL WATER UG/L UG/L <strong>Water</strong> Total50283 112-TRICHLORO-122-TRIFLUOROETHANE, WATER, PG/KG <strong>Water</strong> TotalUNFILTERED, N2ATM PG/KG77275 1-METHYL-2-CHLOROBENZENE (O-CHLOR), TOTAL WATER, UG/L <strong>Water</strong> TotalUG/L77220 1-METHYL-2-ETHYLBENZENE, TOTAL WATER, UG/L UG/L <strong>Water</strong> Total77277 1-METHYL-4-CHLOROBENZENE (P-CHLOR),TOTAL WATER, UG/L <strong>Water</strong> TotalUG/L77356 1-METHYL-4-ISOPROPYLBENZENE, TOTAL WATER, UG/L UG/L <strong>Water</strong> Total77170 2,2-DICHLOROPROPANE, TOTAL WATER, UG/L UG/L <strong>Water</strong> Total39741 2,4,5-T, BOTTOM DEPOSITS, DRY SOLIDS, UG/KG UG/KG Sed/soil Calculated39742 2,4,5-T, FILTERED, WATER, UG/L UG/L <strong>Water</strong> Dissolved39743 2,4,5-T, SUSPENDED, WATER, UG/L UG/L <strong>Water</strong> Suspended39740 2,4,5-T, TOTAL WATER, UG/L UG/L <strong>Water</strong> Total34621 2,4,6-TRICHLOROPHENOL, TOTAL WATER, UG/L UG/L <strong>Water</strong> Total39731 2,4-D, BOTTOM DEPOSITS, DRY SOLIDS, UG/KG UG/KG Sed/soil CalculatedREVISED SEPTEMBER 2012 249
STANDARD OPERATING PROCEDURES FOR SURFACE WATER QUALITY SAMPLINGSTORETCODEPARAMETER NAME UNIT MEDIAANALYSISTYPE39732 2,4-D, FILTERED, WATER, UG/L UG/L <strong>Water</strong> Dissolved39733 2,4-D, SUSPENDED, WATER, UG/L UG/L <strong>Water</strong> Suspended39730 2,4-D, TOTAL WATER, UG/L UG/L <strong>Water</strong> Total38746 2,4-DB, WATER, DISSOLVED, UG/L UG/L <strong>Water</strong> Dissolved34601 2,4-DICHLOROPHENOL, TOTAL WATER, UG/L UG/L <strong>Water</strong> Total34606 2,4-DIMETHYLPHENOL, TOTAL WATER, UG/L UG/L <strong>Water</strong> Total34616 2,4-DINITROPHENOL, TOTAL WATER, UG/L UG/L <strong>Water</strong> Total34611 2,4-DINITROTOLUENE, TOTAL WATER, UG/L UG/L <strong>Water</strong> Total82183 2,4-DP (DICHLORPROP), TOTAL WATER UG/L <strong>Water</strong> Total34626 2,6-DINITROTOLUENE, TOTAL WATER UG/L <strong>Water</strong> Total73547 2-BUTENE, 1,4-DICHLORO-, TOTAL WATER UG/L <strong>Water</strong> Total34581 2-CHLORONAPHTHALENE, TOTAL WATER UG/L <strong>Water</strong> Total34586 2-CHLOROPHENOL, TOTAL WATER UG/L <strong>Water</strong> Total77103 2-HEXANONE TOTAL WATER UG/L <strong>Water</strong> Total34591 2-NITROPHENOL TOTAL WATER UG/L <strong>Water</strong> Total73570 2-PROPENOIC ACID, 2-METHYL-, ETHYL ESTER, TOTAL UG/L <strong>Water</strong> TotalWATER34631 3,3'-DICHLOROBENZIDINE, TOTAL WATER UG/L <strong>Water</strong> Total34636 4-BROMOPHENYL PHENYL ETHER, TOTAL WATER UG/L <strong>Water</strong> Total34641 4-CHLOROPHENYL PHENYL ETHER, TOTAL WATER UG/L <strong>Water</strong> Total78133 4-METHYL-2-PENTANONE, WATER UG/L <strong>Water</strong> Total34646 4-NITROPHENOL, TOTAL WATER UG/L <strong>Water</strong> Total34253 A-BHC-ALPHA, DISSOLVED UG/L <strong>Water</strong> Dissolved61726 ABSORBANCE, UV, ORGANIC CONSTITUENTS, 280 NM, UNITS/CM <strong>Water</strong> TotalPATHLENGT34205 ACENAPHTHENE, TOTAL WATER UG/L <strong>Water</strong> Total49429 ACENAPHTHENE, DRY WEIGHT, SEDIMENT, SIEVE UG/KG Sed/soil Calculated34200 ACENAPHTHYLENE, TOTAL WATER UG/L <strong>Water</strong> Total34203 ACENAPHTHYLENE, DRY WEIGHT, BOTTOM DEPOSITS UG/KG Sed/soil Calculated49428 ACENAPHTHYLENE, DRY WEIGHT, SEDIMENT, SIEVE UG/KG Sed/soil Calculated49260 ACETOCHLOR, RECOVERABLE, WATER, FILTERED UG/L UG/L <strong>Water</strong> <strong>Standard</strong>81552 ACETONE, TOTAL WATER, UG/L UG/L <strong>Water</strong> Total81553 ACETOPHENE, TOTAL WATER UG/L <strong>Water</strong> Total90410 ACID NEAUTRALIZING CAPACITY(LAB MEASUREMENT OF MG/L <strong>Water</strong> CalculatedALKALINITY) CACO3, MG?L00435 ACIDITY, TOTAL (mg/L AS CACO3) MG/L <strong>Water</strong> Total49315 ACIFLUORFEN, RECOVERABLE, FILTERED, WATER, GF,0.7U, UG/L <strong>Water</strong> <strong>Standard</strong>UG/L49430 ACRIDINE, DRY WEIGHT, SEDIMENT, SIEVE UG/KG Sed/soil Calculated34210 ACROLEIN, TOTAL WATER, UG/L UG/L <strong>Water</strong> Total34215 ACRYLONITRILE, TOTAL WATER, UG/L UG/L <strong>Water</strong> Total46342 ALACHLOR (LASSO), WATER, DISSOLVED, UG/L UG/L <strong>Water</strong> Dissolved49313 ALDICARB SULFONE, RECOVERABLE, FILTERED, GF,0.7U, UG/L <strong>Water</strong> <strong>Standard</strong>UG/L49314 ALDICARB SULFOXIDE,RECOVERABLE, FILTERED, GF,0.7U, UG/L <strong>Water</strong> <strong>Standard</strong>UG/L49312 ALDICARB, RECOVERABLE, FILTERED, WATER, GF,0.7U, UG/L <strong>Water</strong> <strong>Standard</strong>UG/L39333 ALDRIN, BOTTOM DEPOSITS (UG/KILOGRAM DRY SOLIDS) UG/KG Sed/soil Calculated39331 ALDRIN, FILTERED, WATER, UG/L UG/L <strong>Water</strong> Dissolved39332 ALDRIN, SUSPENDED, WATER, UG/L UG/L <strong>Water</strong> Suspended39330 ALDRIN, TOTAL WATER, UG/L UG/L <strong>Water</strong> Total49319 ALDRIN, DRY WEIGHT, SEDIMENT, SIEVE UG/KG Sed/soil Calculated49353 ALDRIN, WET WEIGHT, TISSUE, WHOLE ORG, RECV UG/KG Tissue Calculated60050 ALGAE, TOTAL (CELLS/ML) #/ML <strong>Water</strong> Total00425 ALKALINITY, BICARBONATE (MG/L AS CACO3) MG/L <strong>Water</strong> Total00430 ALKALINITY, CARBONATE (MG/L AS CACO3) MG/L <strong>Water</strong> TotalREVISED SEPTEMBER 2012 250
STANDARD OPERATING PROCEDURES FOR SURFACE WATER QUALITY SAMPLINGSTORETCODEPARAMETER NAME UNIT MEDIAANALYSISTYPE00419 ALKALINITY, CARBONATE, INCREMENTAL TITRATION, FIELD MG/L <strong>Water</strong> TotalMG/L39036 ALKALINITY, FILTERED, WATER, AS CACO3 MG/L MG/L <strong>Water</strong> Total00417 ALKALINITY, FIXED ENDPOINT TITRATION, USGS LAB MG/L MG/L <strong>Water</strong> Total00420 ALKALINITY, HYDROXIDE (MG/L AS CACO3) MG/L <strong>Water</strong> Other00415 ALKALINITY, PHENOLPHTHALEIN (MG/L) MG/L <strong>Water</strong> Total00410 ALKALINITY, TOTAL (MG/L AS CACO3) MG/L <strong>Water</strong> Total29801 ALKALINITY, WATER, DISSOLVED, FIXED ENDPOINT, LAB, AS MG/L <strong>Water</strong> DissolvedCACO3, MG/L29802 ALKALINITY, WATER, DISSOLVED, GRAN TITRATION, FIELD, MG/L <strong>Water</strong> DissolvedAS CACO3, MG/L39086 ALKALINITY, WATER, DISSOVED, INCREMENTAL TITRATION, MG/L <strong>Water</strong> OtherFIELD, AS CACO3, MG/L78109 ALLYLCHLORIDE, TOTAL, WATER UG/L UG/L <strong>Water</strong> Total39337 ALPHA BENZENE HEXACHLORIDE, TOTAL WATER, UG/L UG/L <strong>Water</strong> Total80045 ALPHA GROSS PARTICLE ACTIVITY IN WATER, TOTAL PC/L PC/L <strong>Water</strong> Total75986 ALPHA GROSS, 1 SIGMA PRC EST AS NAT U, DISSOLVED, UG/L <strong>Water</strong> DissolvedWATER, UG/L75965 ALPHA GROSS, 1 SIGMA PRC EST AS NAT U, SUSPENDED UG/G Sed/soil SuspendedSEDIMENT UG/G75987 ALPHA GROSS, 1 SIGMA PRC EST AS TH230, DISSOLVED, PCI/L <strong>Water</strong> DissolvedWATER PCI/L75955 ALPHA GROSS, 1 SIGMA PRC EST AS TH230, SUSPENDEDSEDIMENT, PCI/GPCI/G Sed/soil SuspendedTotal76004 ALPHA GROSS, 1 SIGMA PRC EST AS TH230, SUSPENDED PCI/L <strong>Water</strong> SuspendedWATER PCI/L01515 ALPHA, DISSOLVED GROSS, AS URANIUM-NATURAL, PCI/L PCI/L <strong>Water</strong> Dissolved04126 ALPHA, DISSOLVED, WATER (AS TH-230),PCI/L PCI/L <strong>Water</strong> <strong>Standard</strong>04125 ALPHA, DRY WEIGHT, SEDIMENT (AS TH-230), PCI/G PCI/G Sed/soil Total80030 ALPHA, GROSS, DISSOLVED, AS URANIUM-NATURAL, UG/L UG/L <strong>Water</strong> Other01507 ALPHA, GROSS, SEDIMENT (PCI/G OF DRY SOLIDS) PCI/G Sed/soil Calculated01516 ALPHA, GROSS, SUSPENDED, AS URANIUM NATURAL, PCI/L PCI/L <strong>Water</strong> Suspended80040 ALPHA, GROSS, SUSPENDED AS URANIUM NATURAL, UG/L UG/L <strong>Water</strong> Suspended01501 ALPHA, TOTAL PCI/L <strong>Water</strong> Total01502 ALPHA, TOTAL, COUNTING ERROR PC/L <strong>Water</strong> Total49275 ALPHA-BHC, D6, DRY WT, SIEVE PERCENT Sed/soil Other49261 ALPHA-BHC, D6, WET WT, TISSUE, WHOLE ORG PERCENT Tissue Calculated49338 ALPHA-BHC, DRY WEIGHT, SEDIMENT, SIEVE PERCENT Sed/soil Calculated49366 ALPHA-BHC, WET WEIGHT, TISSUE, WHOLE ORG, RECV UG/KG Tissue <strong>Standard</strong>01106 ALUMINUM, DISSOLVED (UG/L AS AL) UG/L <strong>Water</strong> Dissolved49237 ALUMINUM, DRY WEIGHT, TISSUE/BIOTA, RECV MG/KG Tissue Calculated34792 ALUMINUM, SEDIMENT, BOTTOM MATERIAL,
STANDARD OPERATING PROCEDURES FOR SURFACE WATER QUALITY SAMPLINGSTORETCODEPARAMETER NAME UNIT MEDIAANALYSISTYPE34795 ANTIMONY, SED, BOT,
STANDARD OPERATING PROCEDURES FOR SURFACE WATER QUALITY SAMPLINGSTORETCODEPARAMETER NAME UNIT MEDIAANALYSISTYPE39120 BENZIDINE, TOTAL WATER, UG/L UG/L <strong>Water</strong> Total34526 BENZO(A)ANTHRACENE1,2-BENZANTHRACENE, TOTAL UG/L <strong>Water</strong> TotalWATER, UG/L49458 BENZO(B)FLUORANTHENE, DRY WEIGHT, SIEVE, UG/KG UG/KG Sed/soil Calculated34230 BENZO(B)FLUORANTHENE, TOTAL WATER, UG/L UG/L <strong>Water</strong> Total49468 BENZO(C)CINNOLINE, SEDIMENT, BED MATERIAL, WET SIEVE PERCENT Sed/soil Calculated49408 BENZO(G,H,I)PERYLENE, DRY WEIGHT, SIEVE, UG/KG UG/KG Sed/soil Calculated34521 BENZO(GHI)PERYLENE1,12-BENZOPERYLENE, TOTAL WATER, UG/L <strong>Water</strong> TotalUG/L49397 BENZO(K)FLUORANTHENE, DRY WEIGHT, SIEVE, UG/KG UG/KG Sed/soil Calculated34242 BENZO(K)FLUORANTHENE, TOTAL, WATER, UG/L UG/L <strong>Water</strong> Total34247 BENZO-A-PYRENE, TOTAL WATER, UG/L UG/L <strong>Water</strong> Total01013 BERYLLIUM, BOTTOM DEPOSITS, DRY WEIGHT, MG/KG MG/KG Sed/soil Calculated01010 BERYLLIUM, DISSOLVED (UG/L AS BE) UG/L <strong>Water</strong> Dissolved49248 BERYLLIUM, DRY WEIGHT, TISSUE/BIOTA, RECV MG/KG Tissue Calculated50097 BERYLLIUM, ICAP TEST METHOD, TOTAL RECV MG/L <strong>Water</strong> Total01312 BERYLLIUM, POTENTIALLY, DISSOLVED, WATER MG/L <strong>Water</strong> Dissolved34812 BERYLLIUM, SEDIMENT, BOTTOM DEPOSITS, DRY MG/KG Sed/soil DissolvedSIEVE,
STANDARD OPERATING PROCEDURES FOR SURFACE WATER QUALITY SAMPLINGSTORETCODEPARAMETER NAME UNIT MEDIAANALYSISTYPE49264 BIPHENYL, 3, 5-DICHLORO-, WET WEIGHT, TISSUE, WHOLE PERCENT Sed/soil <strong>Standard</strong>ORGANISM, RECOVERABLE49391 BIQUINOLINE,2,2'-, DRY WEIGHT, SEDIMENT, SIEVE, UG/KG UG/KG Sed/soil Calculated34278 BIS (2-CHLOROETHOXY) METHANE, TOTAL WATER, UG/L UG/L <strong>Water</strong> Total34273 BIS (2-CHLOROETHYL) ETHER, TOTAL WATER, UG/L UG/L <strong>Water</strong> Total34283 BIS (2-CHLOROISOPROPYL) ETHER, TOTAL WATER, UG/L UG/L <strong>Water</strong> Total39100 BIS(2-ETHYLHEXYL) PHTHALATE, TOTAL WATER, UG/L UG/L <strong>Water</strong> Total01015 BISMUTH, DISSOLVED (UG/L AS BISMUTH) UG/L <strong>Water</strong> Dissolved34817 BISMUTH, SEDIMENT, BOTTOM DEPOSITS, DRY SIEVE,
STANDARD OPERATING PROCEDURES FOR SURFACE WATER QUALITY SAMPLINGSTORETCODEPARAMETER NAME UNIT MEDIAANALYSISTYPE82032 CALCIUM, TOTAL (UG/L AS CA) UG/L <strong>Water</strong> Total77177 CAPROLACTAM, TOTAL WATER UG/L <strong>Water</strong> Total82680 CARBARYL, 0.7 UM FILTER, TOTAL RECOVERABLE UG/L <strong>Water</strong> <strong>Standard</strong>49310 CARBARYL, RECOVERABLE, FILTERED, WATER, GF,0.7U UG/L <strong>Water</strong> Dissolved49449 CARBAZOLE, DRY WEIGHT, SEDIMENT, SIEVE, UG/KG UG/KG Sed/soil <strong>Standard</strong>82674 CARBOFURAN, 0.7 UM FILTER, TOTAL RECOVERABLE, UG/L <strong>Water</strong> <strong>Standard</strong>WATER UG/L49309 CARBOFURAN, RECOVERABLE, FILTERED, WATER, UG/L <strong>Water</strong> DissolvedGF,0.7U,UG/L00405 CARBON DIOXIDE (MG/L AS CO2) MG/L <strong>Water</strong> Total77041 CARBON DISULFIDE, TOTAL WATER, UG/L UG/L <strong>Water</strong> Total32102 CARBON TETRACHLORIDE, TOTAL WATER, UG/L UG/L <strong>Water</strong> Total00681 CARBON, DISSOLVED ORGANIC (MG/L AS C) MG/L <strong>Water</strong> Dissolved49269 CARBON, INORGANIC, DRY WEIGHT, SEDIMENT, PERCENT Sed/soil OtherRECOVERABLE, SIEVE49270 CARBON, INORGANIC, DRY WEIGHT, SEDIMENT, PERCENT Sed/soil UnknownRECOVERABLE, SIEVE00686 CARBON, INORGANIC, IN BED MATERIAL (GM/KG AS C) MG/KG Sed/soil Unknown49266 CARBON, ORGANIC, DRY WEIGHT, SEDIMENT, PERCENT Sed/soil CalculatedRECOVERABLE, SIEVE49271 CARBON, ORGANIC, DRY WEIGHT, SEDIMENT, PERCENT Sed/soil TotalRECOVERABLE, SIEVE00687 CARBON, ORGANIC, IN BED MATERIAL (GM/KG AS C) MG/KG Sed/soil Other50465 CARBON, ORGANIC, SEDIMENT, SUSPENDED,RECOVERABLE, PERCENT Sed/soil TotalAS C, PERCENT00693 CARBON, ORGANIC & INORGANIC, BOTTOM MATERIAL MG/KG Sed/soil Calculated49264 CARBON, ORGANIC & INORGANIC, DRY WEIGHT, PERCENT Sed/soil <strong>Standard</strong>RECOVERABLE, SIEVE49272 CARBON, ORGANIC & INORGANIC, DRY WEIGHT, PERCENT Sed/soil CalculatedRECOVERABLE, SIEVE30244 CARBON, SEDIMENT, SUSPENDED, PERCENT PERCENT Sed/soil Suspended00688 CARBON, SUSPENDED INORGANIC (MG/L AS C) MG/L <strong>Water</strong> Suspended00689 CARBON, SUSPENDED ORGANIC (MG/L AS C) MG/L <strong>Water</strong> Suspended00694 CARBON, SUSPENDED TOTAL (MG/L AS C) MG/L <strong>Water</strong> Suspended00690 CARBON, TOTAL (MG/L AS C) MG/L <strong>Water</strong> Other00685 CARBON, TOTAL INORGANIC (MG/L AS C) MG/L <strong>Water</strong> <strong>Standard</strong>00680 CARBON, TOTAL ORGANIC (MG/L AS C) MG/L <strong>Water</strong> Total82081 CARBON-13 / CARBON-12 STABLE ISOTOPE RATIO PER MIL NO UNITS <strong>Water</strong> Total49934 CARBON-14, COUNTING ERROR, DISSOLVED, WATER PERCENT <strong>Water</strong> Dissolved49933 CARBON-14, DISSOLVED, WATER PERCENT <strong>Water</strong> Dissolved99445 CARBONATE MG/L AS CO3 MG/L <strong>Water</strong> Total00445 CARBONATE ION (MG/L AS CO3) MG/L <strong>Water</strong> Total00447 CARBONATE, INCREMENTAL TITRATION, (CO3) FIELD, MG/L MG/L <strong>Water</strong> Total00452 CARBONATE, INCREMENTAL TITRATION, DISSOLVED, MG/L <strong>Water</strong> DissolvedWATER, FIELD, AS CO3, MG/L04225 CATION AND ANION SUMMATION, QC CHECK, % DIFFER PERCENT WATER OTHER04226 CATIONS, SUM, TOTAL, WATER MEQ/L WATER OTHER34835 CERIUM, SEDIMENT, BOTTOM DEP,
STANDARD OPERATING PROCEDURES FOR SURFACE WATER QUALITY SAMPLINGSTORETCODEPARAMETER NAME UNIT MEDIAANALYSISTYPE49380 CHLORDANE, CIS-, WET WT, TISSUE, WHOLE ORG, RECV UG/KG TISSUE Total49321 CHLORDANE, TRANS- DRY WT, SEDIMENT, SIEVE PERCENT SED/SOIL Calculated49379 CHLORDANE, TRANS-, WET WT, TISSUE, WHOLE ORG, RECV UG/KG TISSUE Total39062 CHLORDANE-CIS ISOMER, TOTAL WATER, UG/L UG/L <strong>Water</strong> Total39065 CHLORDANE-TRNS ISOMER, TOTAL WATER, UG/L UG/L <strong>Water</strong> Total00940 CHLORIDE, TOTAL, WATER, MG/L MG/L <strong>Water</strong> Total50064 CHLORINE, FREE AVAILABLE (MG/L) MG/L <strong>Water</strong> Other50060 CHLORINE, TOTAL RESIDUAL (MG/L) MG/L <strong>Water</strong> Total34301 CHLOROBENZENE, TOTAL WATER, UG/L UG/L <strong>Water</strong> Total39460 CHLOROBENZILATE, IN WHOLE WATER UG/L WATER TOTAL77297 CHLOROBROMOMETHANE, TOTAL WATER, UG/L UG/L <strong>Water</strong> Total73085 CHLOROBROMOMETHANE, TOTAL, WATER, UG/L UG/L <strong>Water</strong> Total34311 CHLOROETHANE, TOTAL WATER, UG/L UG/L <strong>Water</strong> Total32106 CHLOROFORM, TOTAL WATER, UG/L UG/L <strong>Water</strong> Total49322 CHLORONEB, DRY WT, SEDIMENT SIEVE PERCENT SED/SOIL OTHER49455 CHLOROPHENYL, 4-PHENYL ETHER, SEDIMENT, SIEVE UG/KG SED/SOIL Total34581 CHLORONAPHTHALENE (2-), TOTAL WATER, UG/L UG/L <strong>Water</strong> Total34586 CHLOROPHENOL (2-), TOTAL WATER, UG/L UG/L <strong>Water</strong> Total34641 CHLOROPHENYL PHENYL ETHER (4-), TOTAL WATER, UG/L UG/L <strong>Water</strong> Total49455 CHLOROPHENYL, 4-PHENYL ETHER, SEDIMENT, SIEVE UG/KG Sed/soil Calculated32230 CHLOROPHYLL A (MG/L) MG/L <strong>Water</strong> Total32228 CHLOROPHYLL A, PERIPHYTON, SPECTRO, MG/M2 OTHERS <strong>Water</strong> <strong>Standard</strong>32231 CHLOROPHYLL B (MG/L) MG/L <strong>Water</strong> Total32226 CHLOROPHYLL B, PERIPHYTON, SPECTRO, MG/M2 OTHERS <strong>Water</strong> <strong>Standard</strong>32216 CHLOROPHYLL, TOTAL UG/L TRICHROMATIC UG/L <strong>Water</strong> TotalUNCORRECTED32232 CHLOROPHYLL C MG/L WATER TOTAL32227 CHLOROPHYLL C, PERIPHYTON SPECTRO, MG/M2 MG/M2 WATER STANDARD32216 CHLOROPHYLL, TOTAL, UG/L TRICHROMATIC UNCORRECT UG/L WATER Total32211 CHLOROPHYLL A, UG/L, SPECTRO, ACID. METHOD UG/L WATER Total46460 CHLOROPHYLL-A, SPECTRO,CORRECT FOR PHEOPHYTIN UG/L <strong>Water</strong> Total70955 CHLOROPHYLL-A, PERIDHYTON, UG/L, CHROMO-SPECTRO UG/L <strong>Water</strong> <strong>Standard</strong>99855 CHLOROPHYLL A, PERIHYTON, CHROMO-SPECTRO, MG/M2 MG/M2 WATER STANDARD70957 CHLOROPHYLL-A, PERIPHYTON, UG/L, CHROMO-FLUORO UG/L <strong>Water</strong> Other99857 CHLOROPHYLL-A,PERIPHYTON,CHROMO-FLUORO70953 CHLOROPHYLL-A, PHYTOPLANKTON, CHROMO-FLUORO UG/L <strong>Water</strong> Total70958 CHLOROPHYLL-B, PERIPHYTON, UG/L, CHROMO-FLUORO UG/L <strong>Water</strong> Total70956 CHLOROPHYLL-B, PERIPHYTON, UG/L, CHROMO-SPECTRO UG/L <strong>Water</strong> Total99858 CHLOROPHYLL-B,PERIPHYTON,CHROMO-FLUORO UG/L <strong>Water</strong> Total99856 CHLOROPHYLL-B,PERIPHYTON,CHROMO-SPECTRO UG/L <strong>Water</strong> Total70954 CHLOROPHYLL-B, PHYTOPLANKTON, CHROMO-FLUORO UG/L <strong>Water</strong> Total32215 CHLOROPHYLL-C, SPECTROPHOTOMETRIC 430MU METH UG/L <strong>Water</strong> Total32214 CHLOROPHYLL-C, UG/L, TRICHROMATIC UNCORRECTED UG/L <strong>Water</strong> Total49306 CHLOROTHALONIL, RECOVERABLE, FILTERED, WATER, UG/L <strong>Water</strong> <strong>Standard</strong>GF,0.7U,UG/L99943 CHLOROTRIFLUOROETHYLENE UG/L UG/L <strong>Water</strong> <strong>Standard</strong>38932 CHLOROPYRIFOS, TOTAL RECOVERABLE UG/L <strong>Water</strong> Total38933 CHLORPYRIFOS, DISSOLVED UG/L <strong>Water</strong> Dissolved01118 CHROMIUM, TOTAL RECOVERABLE IN WATER UG/L WATER TOTAL01030 CHROMIUM, DISSOLVED (UG/L AS CR) UG/L <strong>Water</strong> Dissolved01032 CHROMIUM, HEXAVALENT (UG/L AS CR) UG/L <strong>Water</strong> <strong>Standard</strong>01220 CHROMIUM, HEXAVALENT, DISSOLVED IN (UG/L AS CR) UG/L WATER Dissolved34842 CHROMIUM, SEDIMENT, BOTTOM DEPOSITS, UG/G (MG/KG) UG/G Sed/soil Dissolved29829 CHROMIUM, SEDIMENT, SUSPENDED UG/G (MG/KG) UG/G Sed/soil Suspended01031 CHROMIUM, SUSPENDED (UG/L AS CR) UG/L <strong>Water</strong> SuspendedREVISED SEPTEMBER 2012 256
STANDARD OPERATING PROCEDURES FOR SURFACE WATER QUALITY SAMPLINGSTORETCODEPARAMETER NAME UNIT MEDIAANALYSISTYPE49240 CHROMIUM, DRY WEIGHT, TISSUE/BIOTA, RECV MG/KG TISSUE Total01034 CHROMIUM, TOTAL (UG/L AS CR) UG/L <strong>Water</strong> Total49061 CHROMIUM, TOTAL, WATER, TCLP MG/L WATER Total01314 CHROMIUM, TRIVALENT, POTENTIALLY, DISS, WATER MG/L MG/L WATER Dissolved50101 CHROMIUM, ICAP TEST METHOD, TOTAL RECOVERABLE MG/L WATER Total34842 CHROMIUM, SEDIMENT, BOTTOM DEPOSITS UG/G SED/SOIL Total01029 CHROMIUM, TOTAL, BOTTOM DEPOSITS, DRY WEIGHT MG/KG Sed/soil Calculated49450 CHRYSENE, DRY WEIGHT, SEDIMENT, SIEVE, UG/KG UG/KG Sed/soil Calculated34320 CHRYSENE, TOTAL WATER, UG/L UG/L <strong>Water</strong> Total77093 CIS-1,2-DICHLOROETHYLENE, TOTAL WATER, UG/L UG/L <strong>Water</strong> Total34704 CIS-1,3-DICHLOROPROPENE, TOTAL, WATER, UG/L UG/L <strong>Water</strong> Total50798 CIS-1,4-DICHLORO-2-BUTENE UG/L WATER Total49305 CLOPYRALID, RECOVERABLE, FILTERED, WATER, UG/L <strong>Water</strong> <strong>Standard</strong>GF,0.7U,UG/L01038 COBALT, BOTTOM DEPOSITS (MG/KG AS CO DRY WEIGHT) MG/KG Sed/soil Calculated01035 COBALT, DISSOLVED (UG/L AS CO) UG/L <strong>Water</strong> Dissolved34847 COBALT, SEDIMENT, BOTTOM DEPOSITS, UG/G Sed/soil Dissolved01036 COBALT, SUSPENDED (UG/L AS CO) UG/L <strong>Water</strong> Suspended35031 COBALT, SUSPENDED, SEDIMENT UG/G UG/G Sed/soil Suspended01037 COBALT, TOTAL (UG/L AS CO) UG/L <strong>Water</strong> Total34845 COBALT, SEDIMENT, BOTTOM DEPOSIT MG/KG SED/SOIL Total34847 COBALT, SEDIMENT, BOTTOM DEPOSIT UG/G SED/SOIL Total49062 COBALT, TOTAL, WATER, TCLP MG/L WATER Total49250 COBALT, DRY WEIGHT, TISSUE/BIOTA, RECV MG/KG TISSUE Total00335 COD, .025N K2CR2O7, MG/L MG/L <strong>Water</strong> Total00340 COD, .25N K2CR2O7, MG/L MG/L <strong>Water</strong> Total00339 COD, BOTTOM DEPOSITS, DRY WEIGHT MG/KG MG/KG Sed/soil Calculated31501 COLIFORM, TOTAL, MEMBRANE FILTER, IMMED. M-ENDO #/100 ML <strong>Water</strong> TotalMED, 35C31505 COLIFORM, TOTAL, MPN, CONFIRMED TEST, 35C (TUBE OTHERS <strong>Water</strong> Total31506)00080 COLOR (PLATINUM-COBALT UNITS) OTHERS <strong>Water</strong> Total01043 COPPER, BOTTOM DEPOSITS (MG/KG AS CU DRY WEIGHT) MG/KG Sed/soil Calculated01040 COPPER, DISSOLVED (UG/L AS CU) UG/L <strong>Water</strong> Dissolved34852 COPPER, SEDIMENT, BOTTOM DEPOSITS,
STANDARD OPERATING PROCEDURES FOR SURFACE WATER QUALITY SAMPLINGSTORETCODEPARAMETER NAME UNIT MEDIAANALYSISTYPE39730 D (2,4-), TOTAL WATER, UG/L UG/L <strong>Water</strong> Total49304 DACTHAL, RECOVERABLE, FILTERED, WATER, GF,0.7U UG/L UG/L <strong>Water</strong> Dissolved38746 DB (2,4-), WATER, DISSOLVED, UG/L UG/L <strong>Water</strong> Dissolved82682 DCPA, 0.7 UM FILTER, TOTAL RECOVERABLE, WATER,UG/L UG/L <strong>Water</strong> <strong>Standard</strong>39316 DDD (O,P'-) BOTTOM DEPOSITS, DRY SOLIDS, UG/KG UG/KG Sed/soil Calculated39311 DDD (P,P'-), BOTTOM DEPOSITS, DRY SOLIDS, UG/KG UG/KG Sed/soil Calculated39310 DDD (P,P'-), TOTAL WATER, UG/L UG/L <strong>Water</strong> Total39363 DDD, BOTTOM DEPOSITS, (UG/KILOGRAM DRY SOLIDS) UG/KG Sed/soil Calculated39361 DDD, FILTERED FRAC. OF WATER, UG/L UG/L <strong>Water</strong> Dissolved39362 DDD, SUSPENDED FRAC. OF WATER, UG/L UG/L <strong>Water</strong> Suspended39360 DDD, TOTAL WATER, UG/L UG/L <strong>Water</strong> Total39328 DDE (O,P'-), BOTTOM DEPOS , DRY SOLIDS, UG/KG UG/KG Sed/soil Calculated39321 DDE (P,P'-), BOTTOM DEPOSITS, DRY SOLIDS, UG/KG UG/KG Sed/soil Calculated34653 DDE (P,P'-), DISSOLVED, UG/L UG/L <strong>Water</strong> Dissolved49325 DDD,O,P '-, DRY WEIGHT, SEDIMENT, SIEVE PERCENT SED/SOIL Calculated49374 DDD,O,P'-, WET WEIGHT,TISSUE, WHOLE ORG, RECV UG/KG TISSUE TOTAL49326 DDD,P,P'-, DRY WEIGHT, SEDIMENT, SIEVE PERCENT SED/SOIL Calculated49375 DDD,P,P'-, WET WEIGHT, TISSUE, WHOLE ORG, RECV UG/KG TISSUE TOTAL39320 DDE (P,P'-), TOTAL WATER, UG/L UG/L <strong>Water</strong> Total39368 DDE, BOTTOM DEPOSITS (UG/KILOGRAM DRY SOLIDS) UG/KG Sed/soil Calculated39366 DDE, FILTERED FRAC. OF WATER, UG/L UG/L <strong>Water</strong> Dissolved39367 DDE, SUSPENDED FRAC. OF WATER, UG/L UG/L <strong>Water</strong> Suspended39365 DDE, TOTAL WATER, UG/L UG/L <strong>Water</strong> Total49327 DDE,O,P'-, DRY WEIGHT, SEDIMENT, SIEVE PERCENT SED/SOIL Calculated49373 DDE,O,P'-, WET WEIGHT, TISSUE, WHOLE ORG, RECV UG/KG TISSUE Total49328 DDE,P,P'-, DRY WEIGHT, SEDIMENT, SIEVE PERCENT SED/SOIL Calculated49372 DDE,P,P', WET WT, TISSUE, WHOLE ORG, RECV UG/KG TISSUE Total39306 DDT (O,P'-), BOTTOM DEPOSITS, DRY SOLIDS, UG/KG UG/KG Sed/soil Calculated39301 DDT (P,P'-), BOTTOM DEPOSITS, DRY SOLIDS, UG/KG UG/KG Sed/soil Calculated39300 DDT (P,P'-), TOTAL WATER, UG/L UG/L <strong>Water</strong> Total39373 DDT, BOTTOM DEPOSITS (UG/KILOGRAM DRY SOLIDS) UG/KG Sed/soil Calculated39371 DDT, FILTERED FRAC. OF WATER, UG/L UG/L <strong>Water</strong> Dissolved39372 DDT, SUSPENDED FRAC. OF WATER, UG/L UG/L <strong>Water</strong> Suspended39370 DDT, TOTAL WATER, UG/L UG/L <strong>Water</strong> Total49329 DDT,O,P'-, DRY WT, SEDIMENT, SIEVE PERCENT SED/SOIL Calculated49377 DDT,O,P', WET WT, TISSUE, WHOLE ORG, RECV UG/KG TISSUE Total49330 DDT,P,P'-, DRY WT, SEDIMENT, SIEVE PERCENT SED/SOIL Calculated49376 DDT,P,P', WET WEIGHT,TISSUE, WHOLE ORG, RECV UG/KG TISSUE Total04040 DEETHYL ATRAZINE,DISSOLVED,WATER,TOTAL REC UG/L UG/L <strong>Water</strong> Dissolved34259 DELTA BENZENE HEXACHLORIDE TOTAL WATER, UG/L UG/L <strong>Water</strong> Total00064 DEPTH OF STREAM, MEAN (FT) FT <strong>Water</strong> <strong>Standard</strong>00205 DEPTH, MAXIMUM OF LAKE OR RESERVOIR (METERS) M WATER Calculated82082 DEUTERIUM/PROTIUM (H-2/H-1) STABLE ISOTOPE RATIO NO UNITS <strong>Water</strong> Total39571 DIAZINON IN BOT. DEPOSITS (UG/KILOGRAM DRY SOLIDS) UG/KG Sed/soil Calculated39572 DIAZINON, FILTERED FRAC. OF WATER, UG/L UG/L <strong>Water</strong> Dissolved39573 DIAZINON, SUSPENDED FRAC. OF WATER, UG/L UG/L <strong>Water</strong> Suspended39570 DIAZINON, TOTAL WATER, UG/L UG/L <strong>Water</strong> Total49461 DIBENZ(A,H)ANTHRACENE, DRY WEIGHT, SIEVE UG/KG Sed/soil Calculated34556 DIBENZANTHRACENE(1,2,5,6-), TOTAL WATER UG/L UG/L <strong>Water</strong> Total49452 DIBENZOTHIOPHENE, DRY WEIGHT, SEDIMENT, SIEVE UG/KG Sed/soil Calculated32105 DIBROMOCHLOROMETHANE, TOTAL WATER, UG/L UG/L <strong>Water</strong> Total82625 DIBROMOCHLOROPROPANE, WATER,TOTAL RECOV UG/L <strong>Water</strong> Total77651 DIBROMOETHANE (1,2-), TOTAL WATER, UG/L UG/L <strong>Water</strong> Total30217 DIBROMOMETHANE, WATER, TOTAL, RECOVERABLE UG/L UG/L <strong>Water</strong> <strong>Standard</strong>49381 DIBUTYLPHTHALATE, DRY WEIGHT, SEDIMENT, SIEVE UG/KG Sed/soil CalculatedREVISED SEPTEMBER 2012 258
STANDARD OPERATING PROCEDURES FOR SURFACE WATER QUALITY SAMPLINGSTORETCODEPARAMETER NAME UNIT MEDIAANALYSISTYPE38442 DICAMBA (BANVEL), WATER,DISSOLVED, UG/L UG/L <strong>Water</strong> Dissolved49303 DICHLOBENIL, RECOVERABLE, FILTERED, WATER, GF,0.7U UG/L <strong>Water</strong> <strong>Standard</strong>34536 DICHLOROBENZENE (1,2-), TOTAL WATER UG/L UG/L <strong>Water</strong> Total34566 DICHLOROBENZENE (1,3-), TOTAL WATER UG/L UG/L <strong>Water</strong> Total34571 DICHLOROBENZENE (1,4-), TOTAL WATER UG/L UG/L <strong>Water</strong> Total34631 DICHLOROBENZIDINE (3,3'-), TOTAL WATER, UG/L UG/L <strong>Water</strong> Total50282 DICHLORODIFLUOROMENTHANE, WATER, UNFILTERED, N2 PG/KG <strong>Water</strong> TotalATM PG/KG34668 DICHLORODIFUOROMETHANE, TOTAL WATER, UG/L UG/L <strong>Water</strong> Total34496 DICHLOROETHANE (1,1-), TOTAL WATER, UG/L UG/L <strong>Water</strong> Total34531 DICHLOROETHANE (1,2-), TOTAL WATER UG/L UG/L <strong>Water</strong> Total32103 DICHLOROETHANE (1,2-), TOTAL WATER, UG/L UG/L <strong>Water</strong> Total34501 DICHLOROETHYLENE (1,1-), TOTAL WATER, UG/L UG/L <strong>Water</strong> Total34601 DICHLOROPHENOL (2,4-), TOTAL WATER, UG/L UG/L <strong>Water</strong> Total34541 DICHLOROPROPANE (1,2-), TOTAL WATER UG/L UG/L <strong>Water</strong> Total77173 DICHLOROPROPANE (1,3-), TOTAL WATER, UG/L UG/L <strong>Water</strong> Total77170 DICHLOROPROPANE (2,2-), TOTAL WATER, UG/L UG/L <strong>Water</strong> Total77168 DICHLOROPROPENE (1,1-), TOTAL WATER, UG/L UG/L <strong>Water</strong> Total77163 DICHLOROPROPENE-1(1,3-), TOTAL WATER, UG/L UG/L <strong>Water</strong> Total49302 DICHLORPROP, RECOVERABLE, FILTERED, WATER, GF,0.7U UG/L <strong>Water</strong> <strong>Standard</strong>39383 DIELDRIN, BOTTOM DEPOSITS (UG/KILOGRAM DRY SOL.) UG/KG Sed/soil Calculated39381 DIELDRIN, FILTERED FRAC. OF WATER, UG/L UG/L <strong>Water</strong> Dissolved39382 DIELDRIN, SUSPENDED FRAC. OF WATER, UG/L UG/L <strong>Water</strong> Suspended39380 DIELDRIN, TOTAL WATER, UG/L UG/L <strong>Water</strong> Total49331 DIELDRIN,DRY WEIGHT,SEDIMENT,SIEVE PERCENT SED/SOIL Calculated49371 DIELDRIN,WET WEIGHT,TISSUE,WHOLE ORG,RECV UG/KG WATER Total81576 DIETHYL ETHER TOTAL WATER, UG/L UG/L <strong>Water</strong> Total34336 DIETHYL PHTHALATE, TOTAL WATER, UG/L UG/L <strong>Water</strong> Total82660 DIETHYLANILINE, 2, 6-,0.7UM FILTER, TOTAL RECOV, WATER UG/L <strong>Water</strong> <strong>Standard</strong>49383 DIETHYLPHTHALATE, DRY WEIGHT, SEDIMENT, SIEVE UG/KG Sed/soil Calculated81577 DIISOPROPYL ETHER, TOTAL WATER, UG/L UG/L <strong>Water</strong> Total34341 DIMETHYL PHTHALATE, TOTAL WATER, UG/L UG/L <strong>Water</strong> Total50624 DIMETHYL-7-ETHYL-6M8-DI ((1S*,2R*,5R*,7S*)-2,4-), TOTAL UG/L <strong>Water</strong> Total34606 DIMETHYLPHENOL (2,4-), TOTAL WATER, UG/L UG/L <strong>Water</strong> Total49384 DIMETHYLPHTHALATE, DRY WEIGHT, SEDIMENT, SIEVE UG/KG Sed/soil Calculated39110 DI-N-BUTYL PHTHALATE, TOTAL WATER, UG/L UG/L <strong>Water</strong> Total34616 DINITROPHENOL (2,4-), TOTAL WATER, UG/L UG/L <strong>Water</strong> Total34611 DINITROTOLUENE (2,4-), TOTAL WATER, UG/L UG/L <strong>Water</strong> Total34626 DINITROTOLUENE (2,6-), TOTAL WATER, UG/L UG/L <strong>Water</strong> Total34596 DI-N-OCTYL PHTHALATE,TOTAL WATER, UG/L UG/L <strong>Water</strong> Total49301 DINOSEB, RECV, FILTERED, WATER, GF, 0.7U, UG/L UG/L <strong>Water</strong> <strong>Standard</strong>49382 DIOCTYLPHTHALATE, DRY WEIGHT, SEDIMENT, SIEVE UG/KG Sed/soil Calculated82626 DIPHENYLHYDRAZINE (1,2-), WATER, TOTAL RECOVERABLE UG/L <strong>Water</strong> Total82677 DISULFOTON, 0.7 UM FILTER, TOTAL RECOV, WATER UG/L <strong>Water</strong> <strong>Standard</strong>49300 DIURON, RECV,FILTERED, WATER, GF, 0.7U,UG/L UG/L <strong>Water</strong> <strong>Standard</strong>34657 DNOC (4,6-DINITRO-ORTHO-CRESOL), TOTAL WATER, UG/L UG/L <strong>Water</strong> Total82183 DP (2,4-) (DICHLORPROP), TOTAL WATER, UG/L UG/L <strong>Water</strong> Total31648 E. COLI MTEC-MF N0/100ML CFU/100 WATER Total31633 E.COLI,THERMOTOL, MF, M-TEC, IN SITU UREASE #/100ML #/100 ML WATER Total50922 ECOLI, NA+MUG ,4 HOURS ,35C ,COL MPN/100ML CFU/100 WATER Total78151 EDTA MG/L <strong>Water</strong> Total00062 ELEVATION, RESERVIOR SURFACE WATER IN FEET FT WATER Calculated49332 ENDOSULFAN I, DRY WEIGHT, SEDIMENT, SIEVE PERCENT SED/SOIL Calculated34351 ENDOSULFAN SULFATE, TOTAL WATER, UG/L UG/L <strong>Water</strong> Total34361 ENDOSULFAN, ALPHA, TOTAL WATER, UG/L UG/L <strong>Water</strong> TotalREVISED SEPTEMBER 2012 259
STANDARD OPERATING PROCEDURES FOR SURFACE WATER QUALITY SAMPLINGSTORETCODEPARAMETER NAME UNIT MEDIAANALYSISTYPE34356 ENDOSULFAN, BETA, TOTAL WATER, UG/L UG/L <strong>Water</strong> Total39389 ENDOSULFAN, BOTTOM DEPOSITS, DRY SOLIDS, UG/KG UG/KG Sed/soil Calculated82354 ENDOSULFAN, DISSOLVED,WATER, UG/L UG/L <strong>Water</strong> Dissolved39388 ENDOSULFAN, TOTAL WATER, UG/L UG/L <strong>Water</strong> Total34366 ENDRIN ALDEHYDE, TOTAL WATER, UG/L UG/L <strong>Water</strong> Total39393 ENDRIN, BOTTOM DEPOSITS (UG/KILOGRAM DRY SOLIDS) UG/KG Sed/soil Calculated39391 ENDRIN, FILTERED FRAC. OF WATER, UG/L UG/L <strong>Water</strong> Dissolved39392 ENDRIN, SUSPENDED FRAC. OF WATER, UG/L UG/L <strong>Water</strong> Suspended39390 ENDRIN, TOTAL WATER, UG/L UG/L <strong>Water</strong> Total49335 ENDRIN, DRY WEIGHT, SEDIMENT, SIEVE PERCENT SED/SOIL Calculated49370 ENDRIN, WET WEIGHT, TISSUE, WHOLE ORG, RECV UG/KG TISSUE Total82668 EPTC, 0.7 UM FILTER, TOTAL RECOVERABLE, WATER,UG/L UG/L <strong>Water</strong> <strong>Standard</strong>99906 E. COLI (ESCHERICHIA COLI) (COLILERT) (IN WATER) CFU/100 WATER99909 E. COLI (ESCHERICHIA COLI) (COLILERT) (IN SEDIMENT) CFU/100 SED/SOIL Total99918 E. COLI (ESCHERICHIA COLI) (COLILERT) (IN WASTE) CFU/G WASTE Total82663 ETHALFLURALIN, 0.7 UM FILTER, TOTAL RECOV, WATER UG/L <strong>Water</strong> <strong>Standard</strong>39399 ETHION, BOTTOM DEPOSITS, DRY SOLIDS, UG/KG UG/KG Sed/soil Calculated39398 ETHION, TOTAL WATER, UG/L UG/L <strong>Water</strong> Total82672 ETHOPROP, 0.7 UM FILTER, TOTAL RECOV, WATER UG/L <strong>Water</strong> <strong>Standard</strong>34371 ETHYLBENZENE, TOTAL WATER, UG/L UG/L <strong>Water</strong> Total77023 ETHYLENE GLYCOL, WHOLE WATER, UG/L UG/L WATER Total34855 EUROPIUM, SEDIMENT, BOTTOM DEPOSITS,
STANDARD OPERATING PROCEDURES FOR SURFACE WATER QUALITY SAMPLINGSTORETCODEPARAMETER NAME UNIT MEDIAANALYSISTYPE04095 FONOFOS, DISSOLVED, WATER, TOTAL RECOVERABLE, UG/L UG/L <strong>Water</strong> Dissolved71880 FORMALDEHYDE, MG/L MG/L WATER Total01120 GALLIUM, DISSOLVED (UG/L AS GA) UG/L WATER Total34860 GALLIUM, SEDIMENT, BOT,
STANDARD OPERATING PROCEDURES FOR SURFACE WATER QUALITY SAMPLINGSTORETCODEPARAMETER NAME UNIT MEDIAANALYSISTYPE01046 IRON, DISSOLVED (UG/L AS FE) UG/L <strong>Water</strong> Dissolved49242 IRON, DRY WEIGHT, TISSUE / TIOTA, RECOV MG/KG TISSUE Total50103 IRON, ICAP TEST METHOD, TOTL RECOVERABLE MG/L WATER Total99926 IRON, PORE WATER, TOTAL MG/L PORE Total01317 IRON, POTENTIALLY, DISSOLVED, WATER MG/L WATER Dissolved34882 IRON, SEDIMENT, BOT DEP,
STANDARD OPERATING PROCEDURES FOR SURFACE WATER QUALITY SAMPLINGSTORETCODEPARAMETER NAME UNIT MEDIAANALYSISTYPE01319 MANGANESE, POTENTIALLY, DISSOLVED, WATER MG/L WATER Dissolved99929 MANGANESE, SED, LEACHED MG/KG SED/SOIL Total71883 MANGANESE, TOTAL ELEMENTAL UG/L WATER Total49044 MANGANESE, TOTAL, SEDIMENT, TCLP UG/L SED/SOIL Total49065 MANGANESE, TOTAL, WATER, TCLP MG/L WATER Total50106 MANGANESE, ICAP TEST METHOD, TOTAL RECOV, MG/L MG/L WATER Total34905 MANGANESE, SED, BOT,
STANDARD OPERATING PROCEDURES FOR SURFACE WATER QUALITY SAMPLINGSTORETCODEPARAMETER NAME UNIT MEDIAANALYSISTYPE39601 METHYL PARATHION IN BOT DEPOSITS, DRY SOLIDS, UG/KG UG/KG Sed/soil Calculated82667 METHYL PARATHION, 0.7 UM FILTER, TOTAL RECOV, WATER UG/L <strong>Water</strong> <strong>Standard</strong>39602 METHYL PARATHION, FILTERED FRAC. WATER SAMP, UG/L UG/L <strong>Water</strong> Dissolved39603 METHYL PARATHION, SUSPENDED, WATER SAMP, UG/L UG/L <strong>Water</strong> Suspended39600 METHYL PARATHION, TOTAL WATER, UG/L UG/L <strong>Water</strong> Total46491 METHYL TERTIARY BUTYL ETHER (MTBE), TOTAL, WATER UG/L <strong>Water</strong> Total39791 METHYL TRITHION, BOTTOM DEPOSITS, DRY SOLIDS, UG/KG UG/KG Sed/soil Calculated39790 METHYL TRITHION, TOTAL WATER, UG/L UG/L <strong>Water</strong> Total77275 METHYL-2-CHLOROBENZENE (1-) (O-CHLOR) , TOTAL WATER UG/L <strong>Water</strong> Total77220 METHYL-2-ETHYLBENZENE (1-), TOTAL WATER, UG/L UG/L <strong>Water</strong> Total78133 METHYL-2-PENTANONE (4-), WATER UG/L UG/L <strong>Water</strong> Total77277 METHYL-4-CHLOROBENZENE (1-) (P-CHLOR),TOTAL WATER UG/L <strong>Water</strong> Total77356 METHYL-4-ISOPROPYLBENZENE (1-), TOTAL WATER, UG/L UG/L <strong>Water</strong> Total49398 METHYL-9H-FLUORENE, DRY WEIGHT, SIEVE UG/KG Sed/soil Calculated49389 METHYLBENZO(A)PYRENE, DRY WEIGHT, SEDIMENT, SIEVE, UG/KG Sed/soil CalculatedUG/KG34423 METHYLENE CHLORIDE, TOTAL WATER, UG/L UG/L <strong>Water</strong> Total49390 METHYLINDENO(1,2,3-CD)PYRENE, DRY WEIGHT,SIEVE UG/KG Sed/soil Calculated49410 METHYLPHENANTHRENE, DRY WEIGHT, SIEVE UG/KG Sed/soil Calculated49388 METHYLPYRENE, DRY WEIGHT, SEDIMENT, SIEVE UG/KG Sed/soil Calculated39415 METOLACHLOR, WATER, DISSOLVED UG/L UG/L <strong>Water</strong> Dissolved82630 METRIBUZIN (SENCOR), WATER, DISSOLVED, UG/L UG/L <strong>Water</strong> Dissolved39758 MIREX, BOTTOM MATERIAL, DRY SOLIDS, UG/KG UG/KG Sed/soil Calculated39756 MIREX, DISSOLVED, UG/L UG/L <strong>Water</strong> Dissolved39755 MIREX, TOTAL, UG/L UG/L <strong>Water</strong> Total00495 MOISTURE CONTENT (PERCENT OF TOTAL DRY WEIGHT) PERCENT SED/SOIL Calculated82671 MOLINATE, 0.7 UM FILTER, TOTAL RECOV, WATER, UG/L UG/L <strong>Water</strong> <strong>Standard</strong>01060 MOLYBDENUM, DISSOLVED (UG/L AS MO) UG/L <strong>Water</strong> Dissolved49252 MOLYBDENUM, DRY WEITHT, TISSUE/BIOTA, RECOV MG/KG TISSUE TOTALE4915 MOLYBDENUM, SEDIMENT, BOT DEP,
STANDARD OPERATING PROCEDURES FOR SURFACE WATER QUALITY SAMPLINGSTORETCODEPARAMETER NAME UNIT MEDIAANALYSISTYPE01066 NICKEL, SUSPENDED (UG/L AS NI) UG/L <strong>Water</strong> Suspended01067 NICKEL, TOTAL (UG/L AS NI) UG/L <strong>Water</strong> Total01068 NICKEL, TOTAL, BOTTOM DEPOSITS (MG/KG, DRY WEIGHT) MG/KG Sed/soil Calculated49253 NICKEL, DRY WEIGHT, TISSUE/BIOTA, RECV MG/KG TISSUE Total49066 NICKEL, TOTAL, WATER, TCLP MG/L WATER Total34927 NICKEL, SED, BOT,
STANDARD OPERATING PROCEDURES FOR SURFACE WATER QUALITY SAMPLINGSTORETCODEPARAMETER NAME UNIT MEDIAANALYSISTYPE00557 OIL & GREASE, SED, DRY WT, FREON EXTR-GRAV METH MG/KG SED/SOIL50786 ORTHOPHOSPHATE AS P, WATER (SEE ALSO PHOSPHORUS) MG/L WATERTotalTotal49292 ORYZALIN, RECOVERABLE, FILTERED, WATER, GF, 0.7U UG/L <strong>Water</strong> <strong>Standard</strong>38866 OXAMYLWATER, DISSOLVED, UG/L UG/L <strong>Water</strong> Dissolved00090 OXIDATION REDUCTION POTENTIAL (MILLIVOLTS) MVOLTS <strong>Water</strong> Total99911 OXIDATION REDUCTION POTENTIAL (SEDIMENT) MV MVOLTS SED/SOIL Total46480 OXIDATION REDUCTION POTENTIAL, FIELD MV MVOLTS WATER Total78871 OXYCHLORDANE IN SEDIMENT, DRY WEIGHT, UG/KG UG/KG Sed/soil Calculated00300 OXYGEN, DISSOLVED, MG/L MG/L <strong>Water</strong> Dissolved00301 OXYGEN, DISSOLVED, PERCENT OF SATURATION,PERCENT PERCENT <strong>Water</strong> <strong>Standard</strong>82085 OXYGEN-18/OXYGEN-16 STABLE ISOTOPE RATIO PER MIL NO UNITS <strong>Water</strong> Total77135 O-XYLENE, TOTAL WATER,UG/L UG/L <strong>Water</strong> Total39311 P,P' DDD, BOTTOM DEPOSITS, DRY SOLIDS, UG/KG UG/KG Sed/soil Calculated39310 P,P' DDD, TOTAL WATER, UG/L UG/L <strong>Water</strong> Total39321 P,P' DDE, BOTTOM DEPOSITS, DRY SOLIDS, UG/KG UG/KG Sed/soil Calculated34653 P,P' DDE, DISSOLVED, UG/L UG/L <strong>Water</strong> Dissolved39320 P,P' DDE, TOTAL WATER, UG/L UG/L <strong>Water</strong> Total39301 P,P' DDT, BOTTOM DEPOSITS, DRY SOLIDS, UG/KG UG/KG Sed/soil Calculated39300 P,P' DDT, TOTAL WATER, UG/L UG/L <strong>Water</strong> Total34452 PARACHLOROMETA CRESOL, TOTAL WATER, UG/L UG/L <strong>Water</strong> Total39541 PARATHION IN BOT. DEPOSITS (UG/KILOGRAM DRY SOLIDS) UG/KG Sed/soil Calculated39542 PARATHION, FILTERED FRAC. OF WATER, UG/L UG/L <strong>Water</strong> Dissolved39543 PARATHION, SUSPENDED FRAC. OF WATER, UG/L UG/L <strong>Water</strong> Suspended39540 PARATHION, TOTAL WATER, UG/L UG/L <strong>Water</strong> Total34671 PCB - 1016 TOTAL WATER, UG/L UG/L <strong>Water</strong> Total81648 PCB - 1016/1242, TOTAL WATER UG/L UG/L <strong>Water</strong> Total39488 PCB - 1221, TOTAL WATER UG/L UG/L <strong>Water</strong> Total39492 PCB - 1232, PCB SERIES TOTAL WATER UG/L UG/L <strong>Water</strong> Total39496 PCB - 1242, PCB SERIES TOTAL WATER UG/L UG/L <strong>Water</strong> Total39500 PCB - 1248, PCB SERIES TOTAL WATER UG/L UG/L <strong>Water</strong> Total39504 PCB - 1254, PCB SERIES TOTAL WATER UG/L UG/L <strong>Water</strong> Total39508 PCB - 1260, PCB SERIES TOTAL WATER UG/L UG/L <strong>Water</strong> Total39519 PCBS, BOTTOM DEPOSITS, DRY SOLIDS, UG/KG UG/KG Sed/soil Calculated39517 PCBS, FILTERED FRAC. OF WATER, UG/L UG/L <strong>Water</strong> Dissolved49354 PCB, WET WEIGHT, TISSUE, WHOLE ORG, RECV UG/KG TISSUE Total49459 PCB, DRY WEIGHT, BED MATERIAL, SIEVE PERCENT SED/SOIL Percent39519 PCBS IN BOTTOM DEPOSITS (UG/KG DRY SOLIDS) UG/KG SED/SOIL Total39517 PCBS IN FILT. FRAC. OF WATER SAMPLE UG/L WATER Dissolved39518 PCBS, SUSPENDED FRAC. OF WATER, UG/L UG/L <strong>Water</strong> Suspended39516 PCBS, TOTAL WATER, UG/L UG/L <strong>Water</strong> Total39251 PCNS, BOTTOM DEPOS, DRY SOLIDS, UG/KG UG/KG Sed/soil Calculated39032 PCP (PENTACHLOROPHENOL) TOTAL WATER,UG/L UG/L <strong>Water</strong> Total49451 P-CRESOL, DRY WEIGHT, SEDIMENT, SIEVE, UG/KG UG/KG Sed/soil Calculated82669 PEBULATE, 0.7 UM FILTER, TOTAL RECOVERABLE, WATER UG/L <strong>Water</strong> <strong>Standard</strong>82683 PENDIMETHALIN, 0.7 UM FILTER, TOTAL RECOV, WATER UG/L <strong>Water</strong> <strong>Standard</strong>49460 PENTACHLOROANISOLE, DRY WT, BED MATERIAL, SIEVE UG/KG Sed/soil Calculated61209 PERCHLORATE (CLO4) UG/L WATER TOTAL61210 PERCHLORATE (CLO4) MG/KG SED/SOIL TOTAL82687 PERMETHRIN, CIS, 0.7 UM FILTER, TOTAL RECOV, WATER UG/L <strong>Water</strong> <strong>Standard</strong>82348 PERTHANE, DISSOLVED IN WATER UG/L UG/L <strong>Water</strong> Dissolved81886 PERTHANE, SEDIMENT, DRY WEIGHT, UG/KG UG/KG Sed/soil Calculated39034 PERTHANE, TOTAL WATER, UG/L UG/L <strong>Water</strong> Total00400 PH (STANDARD UNITS) SU <strong>Water</strong> <strong>Standard</strong>00406 PH, FIELD SU <strong>Water</strong> Total00403 PH, LAB SU <strong>Water</strong> TotalREVISED SEPTEMBER 2012 266
STANDARD OPERATING PROCEDURES FOR SURFACE WATER QUALITY SAMPLINGSTORETCODEPARAMETER NAME UNIT MEDIAANALYSISTYPE49409 PHENANTHRENE, DRY WEIGHT, SIEVE UG/KG Sed/soil Calculated34461 PHENANTHRENETOTAL WATER, UG/L UG/L <strong>Water</strong> Total34694 PHENOL(C6H5OH)- SINGLE COMPOUND, TOTAL WATER UG/L <strong>Water</strong> Total49424 PHENOL, C8-ALKYL-, DRY WEIGHT, SEDIMENT, SIEVE UG/KG Sed/soil Calculated49413 PHENOL, DRY WEIGHT, SEDIMENT, SIEVE, UG/KG UG/KG Sed/soil Calculated32730 PHENOLICS, TOTAL, RECOVERABLE, UG/L UG/L <strong>Water</strong> Total32218 PHEOPHYTIN-A UG/L SPECTROPHOTOMETRIC ACID. METH. UG/L <strong>Water</strong> Total82664 PHORATE, 0.7 UM FILTER, TOTAL RECOVERABLE, WATER UG/L <strong>Water</strong> <strong>Standard</strong>00660 PHOSPHATE, ORTHO (MG/L AS PO4) MG/L <strong>Water</strong> Other00650 PHOSPHATE, TOTAL (MG/L AS PO4) MG/L <strong>Water</strong> Total00653 PHOSPHATE, TOTAL SOLUBLE (MG/L) MG/L <strong>Water</strong> Dissolved70505 PHOSPHATE, TOTAL, COLORIMETRIC METHOD (MG/L AS P) MG/L <strong>Water</strong> Total30292 PHOSPHOROUS, SEDIMENT, SUSPENDED, PERCENT PERCENT Sed/soil Suspended00666 PHOSPHORUS, DISSOLVED (MG/L AS P) MG/L <strong>Water</strong> Dissolved00671 PHOSPHORUS, DISSOLVED ORTHOPHOSPHATE (MG/L AS P) MG/L <strong>Water</strong> <strong>Standard</strong>34937 PHOSPHORUS, SEDIMENT, BOTTOM DEPOSITS,
STANDARD OPERATING PROCEDURES FOR SURFACE WATER QUALITY SAMPLINGSTORETCODEPARAMETER NAME UNIT MEDIAANALYSISTYPE09510 RADIUM 226, DISSOLVED, PLANCHET COUNT PCI/L <strong>Water</strong> Dissolved09511 RADIUM 226, DISSOLVED, RADON METHOD PCI/L <strong>Water</strong> Dissolved75944 RADIUM 226, SUSPENDED, SEDIMENT PCI/G PCI/G Sed/soil Suspended11504 RADIUM 226 + RADIUM 228,TOTAL,COUNTING ERROR PC/L PC/L WATER Calculated09507 RADIUM 226 IN SEDIMENT (PC/G OF DRY SOLIDS) PCI/G SED/SOIL Total09503 RADIUM 226, DISSOLVED PCI/L WATER Dissolved09501 RADIUM 226, TOTAL PCI/L WATER Total76000 RADIUM 228, 1 SIGMA PRC EST, DISSOLVED, WATER,PCI/L PCI/L <strong>Water</strong> Dissolved75948 RADIUM 228, 1 SIGMA PRC EST, SUSPENDED, SEDIMENT PCI/G Sed/soil Suspended75937 RADIUM 228, SUSPENDED, SEDIMENT PCI/G PCI/G Sed/soil Suspended81366 RADIUM-228, DISSOLVED (PCI/L AS RA-228) PCI/L <strong>Water</strong> Dissolved76002 RADON 222, 1 SIGMA PRC EST, TOTAL, WATER, PCI/L PCI/L <strong>Water</strong> Other82303 RADON 222, TOTAL IN WATER, PCI/L PCI/L <strong>Water</strong> Total00500 RESIDUE, TOTAL (MG/L) MG/L <strong>Water</strong> Total00515 RESIDUE, TOTAL FILTRABLE (DRIED AT 105C),MG/L MG/L <strong>Water</strong> Dissolved00530 RESIDUE, TOTAL NONFILTRABLE (MG/L) MG/L <strong>Water</strong> Suspended70300 RESIDUE,TOTAL FILTRABLE (DRIED AT 180C), MG/L MG/L <strong>Water</strong> Dissolved00520 RESIDUE, VOLATILE FILTRABLE (MG/L) MG/L WATER Dissolved00535 RESIDUE, VOLATILE NONFILTRABLE (MG/L) MG/L WATER Suspended34947 SCANDIUM, SEDIMENT, BOTTOM DEPOSITS,
STANDARD OPERATING PROCEDURES FOR SURFACE WATER QUALITY SAMPLINGSTORETCODEPARAMETER NAME UNIT MEDIAANALYSISTYPE39046 SIMAZINE IN, BOTTOM DEPOS MG/KG Sed/soil Calculated04035 SIMAZINE, DISSOLVED, WATER, TOTAL RECOVERABLE UG/L UG/L <strong>Water</strong> Dissolved39025 SIMAZINE,COULSON CONDUCTIVITY,WATER, UG/L UG/L <strong>Water</strong> Total04030 SIMETRYN, DISSOLVED, WATER, TOTAL RECOVERABLE UG/L UG/L <strong>Water</strong> Dissolved00931 SODIUM ADSORPTION RATIO NO UNITS <strong>Water</strong> Other91053 SODIUM, DISOLVED (UG/L AS NA) UG/L <strong>Water</strong> <strong>Standard</strong>00930 SODIUM, DISSOLVED (MG/L AS NA) MG/L <strong>Water</strong> Dissolved00932 SODIUM, PERCENT PERCENT <strong>Water</strong> Calculated34962 SODIUM, SED, BOT DEP,
STANDARD OPERATING PROCEDURES FOR SURFACE WATER QUALITY SAMPLINGSTORETCODEPARAMETER NAME UNIT MEDIAANALYSISTYPE34790 SURFACTANTS, AS CTAS, WATER MG/L WATER Total70337 SUS SED FALL DIA(DISTLD WATER)%FINER THAN .002MM PERCENT Sed/soi Suspended70338 SUS SED FALL DIA(DISTLD WATER)%FINER THAN .004MM PERCENT Sed/soi Suspended70339 SUS SED FALL DIA(DISTLD WATER)%FINER THAN .008MM PERCENT Sed/soi Suspended70340 SUS SED FALL DIA(DISTLD WATER)%FINER THAN .016MM PERCENT Sed/soi Suspended70341 SUS SED FALL DIA(DISTLD WATER)%FINER THAN .031MM PERCENT Sed/soi Suspended70331 SUSPENDED SED SIEVE DIAMETER,% FINER THAN .062MM PERCENT Sed/soi Suspended70336 SUSPENDED SED SIEVE DIAMETER,% FINER THAN 2.00MM PERCENT Sed/soi Suspended99913 SUSPENDED SEDIMENT CONCENTRATION (GRAVIMETRIC), MG/L WATER SuspendedFINE FRACTION99914 SUSPENDED SEDIMENT CONCENTRATION (GRAVIMETRIC) MG/L WATER SuspendedCOARSE FRACTION39741 T (2,4,5-), BOTTOM DEPOSITS, DRY SOLIDS, UG/KG UG/KG Sed/soil Calculated39742 T (2,4,5-), FILTERED, WATER, UG/L UG/L <strong>Water</strong> Dissolved39743 T (2,4,5-), SUSPENDED, WATER, UG/L UG/L <strong>Water</strong> Suspended39740 T (2,4,5-), TOTAL WATER, UG/L UG/L <strong>Water</strong> Total34977 TANTALUM, SEDIMENT, BOTTOM DEPOSITS,
STANDARD OPERATING PROCEDURES FOR SURFACE WATER QUALITY SAMPLINGSTORETCODEPARAMETER NAME UNIT MEDIAANALYSISTYPE01100 TIN, DISSOLVED (UG/L AS SN) UG/L WATER34985 TIN,SED,BOT,
STANDARD OPERATING PROCEDURES FOR SURFACE WATER QUALITY SAMPLINGSTORETCODEPARAMETER NAME UNIT MEDIAANALYSISTYPE82079 TURBIDITY, LAB NEPHELOMETRIC TURBIDITY UNITS, NTU NTU <strong>Water</strong> Total75992 URANIUM 234, 1 SIGMA PRC EST, DISSOLVED, WATER PCI/L PCI/L <strong>Water</strong> Dissolved75941 URANIUM 234, 1 SIGMA PRC EST, SUSPENDED, SED, PCI/G PCI/G Sed/soil Suspended22610 URANIUM 234, DISSOLVED, PCI/L PCI/L <strong>Water</strong> Dissolved75942 URANIUM 234, SUSPENDED, SEDIMENT PCI/G PCI/G Sed/soil Suspended75994 URANIUM 235, 1 SIGMA PRC EST, DISSOLVED, WATER PCI/L PCI/L <strong>Water</strong> Dissolved75947 URANIUM 235, 1 SIGMA PRC EST, SUSPENDED, SED PCI/G PCI/G Sed/soil Suspended22620 URANIUM 235, DISSOLVED, PCI/L PCI/L <strong>Water</strong> Dissolved75975 URANIUM 235, SUSPENDED, WATER PCI/L PCI/L <strong>Water</strong> Suspended75991 URANIUM 238, 1 SIGMA PRC EST, DISSOLVED, WATER PCI/L PCI/L <strong>Water</strong> Dissolved22603 URANIUM 238, DISSOLVED, PCI/L PCI/L <strong>Water</strong> <strong>Standard</strong>75940 URANIUM 238, SUSPENDED, SEDIMENT, PCI/G PCI/G Sed/soil Suspended80015 URANIUM, DISSOLVED, EXTRACTION FLUOROMETRIC, PCI/L PCI/L <strong>Water</strong> Dissolved80020 URANIUM, DISSOLVED, EXTRACTION FLUOROMETRIC, UG/L UG/L <strong>Water</strong> Dissolved75990 URANIUM, NATURAL, 1 SIGMA PRC EST, DISS, WATER,UG/L UG/L <strong>Water</strong> Calculated75993 URANIUM, NATURAL, 1 SIGMA PRC EST, TOTAL, WATER UG/L <strong>Water</strong> Total22703 URANIUM, NATURAL, DISSOLVED UG/L <strong>Water</strong> Dissolved28011 URANIUM, NATURAL, TOTAL,UG/L AS U UG/L <strong>Water</strong> Total35002 URANIUM, SEDIMENT, BOT DEP,
STANDARD OPERATING PROCEDURES FOR SURFACE WATER QUALITY SAMPLINGSTORETCODEPARAMETER NAME UNIT MEDIAANALYSISTYPE01303 ZINC, POTENTIALLY DISSOLVED WATER MG/L MG/L WATER Dissolved35020 ZINC, SED, BOT,
STANDARD OPERATING PROCEDURES FOR SURFACE WATER QUALITY SAMPLINGAPPENDIX E QUERYING DATA USING MICROSOFT ACCESSThis procedure will enable you to query any field in any combination and filter data to get theresults you want.A FEW IMPORTANT THINGS TO KNOWI have already set up the relationships and some basic queries in access. You do not need torecreate this part. If you are interested, the linked WQDB tables are located under the “Tables”object on the left. Relationships between the tables can be viewed by clicking the relationshipbutton . .Many of the existing queries are based off of the query called SW-BASIC.I have added two important fields. NewResult and NewDetectionLimit are numericfields while Result and Detection Limit are text fields. Use the NewResult andNewDetectionLimit fields when running queries that require numbers (like Arsenic >0.01 mg/L).I use a naming convention to make finding a query easier. SW = <strong>Surface</strong> <strong>Water</strong>. GW= Groundwater. zz = a subquery.BASIC NAVIGATION1. Navigate to “Live WQDB.mdb” located at J:\WQD\<strong>Surface</strong> <strong>Water</strong> Section\MonitoringUnitSave a copy of the Live WQDB.mdb to your computer so that you don’t muck upthings <strong>for</strong> other users.2. Open the “Live WQDB”. You’ll see a splash screen with some useful links when you startthe database. Click “Start Querying Data”.REVISED SEPTEMBER 2012 274
STANDARD OPERATING PROCEDURES FOR SURFACE WATER QUALITY SAMPLING3. Click the “Queries” object on the left.4. Single Click the SW – BASIC <strong>for</strong> surface water data or single click GW – BASIC <strong>for</strong>groundwater data.REVISED SEPTEMBER 2012 275
STANDARD OPERATING PROCEDURES FOR SURFACE WATER QUALITY SAMPLING5. Click Design. This allows you to specify criteria. If you double clicked you run the query.Not to worry though. You can still click the design button (upper left).6. Access takes you here. These are the key features.4123Features:1) Tables in the query and how they are related. All available fields are listed.2) Fields in your query. Common fields are already populated. Do you want one that isn’tlisted? Just drag and drop a field from the tables above (1) down to the fields below (2)3) Criteria. This row lets you pick how to filter the data. The example above will querydata that has a water body code of “S” <strong>for</strong> stream <strong>for</strong> the site_ID SRTON052.28. See“Examples of criteria” below <strong>for</strong> additional in<strong>for</strong>mation.4) This button runs your query.7. This is what you see when you run your query.REVISED SEPTEMBER 2012 276
STANDARD OPERATING PROCEDURES FOR SURFACE WATER QUALITY SAMPLING8. To return to your query you can click the design button .9. To export your data to excel select all the records by clicking on the upper left hand cell.Don’t do this if you have more than 66,000 records. Excel 2003 can’t handle thatmuch data on one sheet.REVISED SEPTEMBER 2012 277
STANDARD OPERATING PROCEDURES FOR SURFACE WATER QUALITY SAMPLING10. Copy the data by hitting CTRL+C. Depending on the amount of data selected this maytake a minute or two.11. Paste it into excel CTRL+V.Always check your query against the WQDB and make sure that the records match up.If your relationships are wrong, your query will be too. Also missing data can impactyour query. For example if staff don't enter "AMB" <strong>for</strong> the sample program, you willnot get all the available data.REVISED SEPTEMBER 2012 278
STANDARD OPERATING PROCEDURES FOR SURFACE WATER QUALITY SAMPLINGAPPENDIX FBASIC DATA MANIPULATIONThe WQDB, Microsoft Query and the <strong>Water</strong> Quality data warehouse will give you data in a row<strong>for</strong>mat such as:SITE_ID Date LN Result RESULT UNIT CHEMICAL_NAMELCBEN002.57 11/15/2006 ND ALKALINITY, PHENOLPHTHALEINLCBEN002.57 11/15/2006 0.039 0.039 MG/L AMMONIA AS NITROGENLCBEN002.57 11/15/2006 ND ANTIMONY - TOTALLCBEN002.57 11/15/2006 ND ANTIMONY - DISSOLVEDLCBEN002.57 11/15/2006 ND ARSENIC, INORGANICLCECL021.13 11/14/2006 137 137 UMHOS/CM LAB SPECIFIC CONDUCTIVITYLCECL021.13 11/14/2006 160 160 UMHOS/CM FIELD SPECIFIC CONDUCTIVITYLCECL021.13 11/14/2006 44 44 FT STREAM WIDTHLCECL021.13 11/14/2006 ND SULFATELCECL021.13 11/14/2006 6 6 MG/L SUSPENDED SOLIDS / SEDIMENTSTABLE 1. Un<strong>for</strong>matted data from the WQDB in a row <strong>for</strong>mat.It is helpful to manipulate this kind of data into a tabular <strong>for</strong>mat so that each column is a differentparameter. This enables easy analysis using programs such as Arc Map and SYSTAT (TABLE 2).SITEID SAMPDATE HARDCACO3(mg/L)ALKCACO3(mg/L)CA-T(mg/L)CHLORIDE(mg/L)DO-(mg?l)LCBEN002.57 11/15/2006 85.0 110.0 21.0 ND 9.00 79.9LCBEN002.57 4/5/2007 64.0 77.0 15.0 ND 8.29 75.6LCBEN002.57 5/9/2007 58.0 73.0 13.0 ND 9.33 73.2LCBRB000.27 11/14/2006 58.0 57.0 11.0 0.5 10.03 106.3LCBRB000.27 5/1/2007 39.0 37.0 8.3 ND 11.41 107.1LCBRB000.27 5/16/2007 50.0 52.0 11.0 ND 7.39 89.4LCBRB006.74 11/28/2006 77.0 76.0 16.0 0.5 8.90 88.3LCBRB006.74 6/18/2007 43.0 46.0 9.0 ND 8.83 93.2LCCHC060.61 11/15/2006 120.0 130.0 30.0 0.5 9.46 97.3LCCHC060.61 4/25/2007 81.0 87.0 20.0 12 11.15 117.0LCCHC081.26 11/15/2006 120.0 130.0 29.0 0.5 7.37 71.9TABLE 2. Formatted data in a tabular or columnar <strong>for</strong>mat after it has been manipulated.DO-(%)GETTING THE DATA INTO THE "RIGHT" FORMATExcel has a powerful tool called a Pivot Table. This tool enables you to organize large quantities ofdata quickly. One limitation of a Pivot Table is that it really wants to summarize data, which isn'tsomething we want when it comes to displaying results <strong>for</strong> water chemistry. In order to workaround this issue each parameter must be made to be unique. For example, you must distinguishbetween total and dissolved antimony or field and lab specific conductivity to make thistrans<strong>for</strong>mation work. We could use STORET numbers to accomplish this, but the problem is thatno one knows what that number means without looking it up in a table. This method gives you adescriptive name <strong>for</strong> each parameter that we'll use later.REVISED SEPTEMBER 2012 279
STANDARD OPERATING PROCEDURES FOR SURFACE WATER QUALITY SAMPLINGMAKING EACH PARAMETER UNIQUE1) In Excel, add a new column to the right of "CHEMICAL NAME" and call it "Parameter".2) Sort by lab method code.3) Add the <strong>for</strong>mula =CONCATENATE(N2, " ",H2). This should combine the "chemicalname" field with the "analysis type". This solves problems with total and dissolved metals.4) Use the fill down function (CTRL+D) to add to all selected records. Select the columnParameter. CTRL+C. Right Click. Paste Special. Check "values". Paste. This gets rid ofthe <strong>for</strong>mula.5) Sort by "EVAL_PURPOSE_TYPE".6) Concatenate "Parameter" with "Eval_Purpose_Type". This solves duplicate versus regularsamples.7) Use the fill down function (CTRL+D) to add to all selected records. Select the columnParameter. CTRL+C. Right Click. Paste Special. Check "values". Paste. This gets rid ofthe <strong>for</strong>mula.8) Concatenate "Parameter" with "Lab_Method_Code".9) The goal is to verify that each chemical name is unique. Create a pivot table from yourdata by going to "Data" "Pivot Table and Pivot Chart Report". Go through the wizardusing the default settings (as long as all of your data is selected you should be ok). Set upthe pivot table the following way. All the numbers should be 1. If not then double clickon the number greater than one to see what the problem is. If you are not very familiarwith how pivot tables work, you can get up to speed at: http://office.microsoft.com/enus/training/CR061831141033.aspxColumnParameterRowSite IDSample DateParameter(Count)DataADDING A NEGATIVE TO THE LONGITUDE FIELDArcMap likes to have a negative value <strong>for</strong> the longitude field.1) Add a column to the right of "LONGITUDE_DEGREES". Call it "Longitude"2) Insert the <strong>for</strong>mula "=-B2". Fill down. Replace <strong>for</strong>mulas with values.3) Delete the "LONGITUDE_DEGREES" column.If you are going to use the data <strong>for</strong> statistical analysis you should consider how tohandle your non-detect values now. Some people use 50% of the detection limit andplace use that value when running statistical tests. USGS has developed a morecomplicated procedure <strong>for</strong> dealing with this problem. Statistical analysis is beyond thescope of this procedures manual.REVISED SEPTEMBER 2012 280
STANDARD OPERATING PROCEDURES FOR SURFACE WATER QUALITY SAMPLINGCREATE A PIVOT TABLE TO DISPLAY YOUR RESULTS1) Select all records.2) Create a pivot table from your data by going to "Data" "Pivot Table and Pivot ChartReport". Go through the wizard using the default settings (as long as all of your data isselected you should be ok). Set up the pivot table the following way. We use the "sum"function because there is only one value in each cell, which is why it was important tocreate unique records earlier. You could also use the average function.ColumnParameterRowSite IDSample DateResult withNDs (Sum)DataLat & LongHuc & Quarter3) Hide all totals and grand totals by right clicking on them and clicking "hide".PREPARING TO IMPORT YOUR DATA1) Copy the values in the Pivot Table to a new sheet. CTRL+A, CTRL+C, go to newworkbook. Right click, Paste Special. Check Values (this is the important part). Paste.2) Delete extra rows (rows 1 to 3).3) Format the cells <strong>for</strong> each column and pick the maximum number of decimal pointsdisplayed <strong>for</strong> each column. Format the date as a number with no decimals.4) Fill down all the site_IDs, dates, lat and longs <strong>for</strong> each site.5) Change each parameter name to something simple and short such as in TABLE 3. Noteall Duplicates with DUP as a suffix. Pick shorter names <strong>for</strong> all habitat values.From WQDB and ExcelChange to:LATITUDE_DEGREESLatitudeLongitudeLongitudeSAMPLE_DATESampleDateALKALINITY, PHENOLPHTHALEIN TOTALAlk-PhenoAMMONIA AS NITROGEN TOTALNH3ANTIMONY DISSOLVEDSbDANTIMONY TOTALSbTARSENIC, INORGANIC DISSOLVEDAsDARSENIC, INORGANIC TOTALAsTBERYLLIUM AND COMPOUNDS DISSOLVEDBeDBERYLLIUM AND COMPOUNDS TOTALBeTBORON (BORON AND BORATES ONLY) TOTALBTCADMIUM DISSOLVEDCdDCADMIUM TOTALCdTREVISED SEPTEMBER 2012 281
STANDARD OPERATING PROCEDURES FOR SURFACE WATER QUALITY SAMPLINGFrom WQDB and ExcelChange to:CALCIUM CARBONATE STANDARDHardCOCO3CALCIUM CARBONATE TOTALAlkCOCO3CALCIUM TOTALCaTCARBONATE TOTALCO3CHLORIDE TOTALClCHROMIUM TOTALCRTCOPPER DISSOLVEDCuDCOPPER TOTALCuTFLUORIDE TOTALFTHARDNESS (CACO3 + MGCO3) CALCULATEDHardCalHYDROGEN CARBONATE TOTALHCO3KJELDAHL NITROGEN TOTALTKNLEAD AND COMPOUNDS (INORGANIC) DISSOLVEDPbDLEAD AND COMPOUNDS (INORGANIC) TOTALPbTMAGNESIUM TOTALMgTMANGANESE TOTALMnTMERCURY, ELEMENTAL DISSOLVEDHgDMERCURY, ELEMENTAL TOTALHgTNITRATE + NITRITE TOTALNitrateNitriteNITRATE AS N TOTALNitrateNITRITE AS N TOTALNitritePH TOTALpHLabPHOSPHORUS TOTALPTPOTASSIUM TOTALKTSELENIUM AND COMPOUNDS TOTALSeTSODIUM TOTALNaTSPECIFIC CONDUCTIVITY STANDARDSpCondLabSULFATE TOTALSO4SUSPENDED SOLIDS / SEDIMENTS SUSPENDEDSSCSUSPENDED SOLIDS / SEDIMENTS SUSPENDED - COARSE FRACTIONSSCCourseSUSPENDED SOLIDS / SEDIMENTS SUSPENDED - FINE FRACTIONSSCFineTOTAL DISSOLVED SOLIDS DISSOLVEDTDSLabZINC DISSOLVEDZnDZINC TOTALZnTE. COLI FIELD EcoliSTREAM WIDTH FIELDStreamWidthDEPTH FIELDStreamDepthFLOW FIELDFlow-ft/sCROSS-SECTIONAL AREA FIELDCrossareaE. COLI FIELD TOTAL EcoliTEMPERATURE FIELD STANDARDTemp-AirTEMPERATURE FIELD TOTALTemp-<strong>Water</strong>DISSOLVED OXYGEN FIELD DISSOLVEDDO-mg/lDISSOLVED OXYGEN FIELD STANDARDDO-%TOTAL DISSOLVED SOLIDS FIELD DISSOLVEDTDS-FieldSPECIFIC CONDUCTIVITY FIELD STANDARDSpCond-FieldPH FIELD TOTALPh-FieldREVISED SEPTEMBER 2012 282
STANDARD OPERATING PROCEDURES FOR SURFACE WATER QUALITY SAMPLINGFrom WQDB and ExcelTURBIDITY FIELD STANDARDChange to:Turbidity6) Maximize all column widths.IMPORTING DATA INTO ARCMAP1) Select the Latitude and Longitude columns.2) Select all the data you want to export.3) Save the file as a DBF4 file. DBF's are very picky. Here are some things to keep in mind:A) Maximize all columns and make sure your column names are unique and under 8charactersB) Make sure you specify the number of decimal places <strong>for</strong> each column.C) Make sure all results are displayed as numbersD) If you are importing a column that has a blank value at the top and it is supposedto be numeric you will need to put a "0" at the top. Otherwise it will be convertedinto a text file. You will need to remember a "0" is equivalent to a blank whendisplaying your data. In other words, only values with a nonzero number weresampled.4) Open your map in ArcMap. Be sure you already have stuff loaded such as the watersheds.This establishes the datum in NAD83.5) Using Arc Catalog, import the DBF file into arcmap by dragging and dropping into thelayers panel.6) Right click on the table in the layer panel in ArcMap and select "Display X Y Data".Longitude should be in the x field, latitude in the y field.7) All of our data is in NAD83. Under "Coordinate System of Input Coordinates" selectEdit. Click Geographic Coordinates North America North American Datum 1983.Click OK on all screens.8) Your data should be displayed on the map. If not you may need to readjust column namesin the DBF table or <strong>for</strong>mat the lat/long fields correctly. Sometime you need to tinker withit to get it to load properly.9) Once you get it loaded you should create a shapefile and make it permanent. To do thisright click on the newly displayed cover. Select Export Data. Chose a great place on yourcomputer and name the shapefile. You can now remove the DBF table from your map.IMPORTING DATA INTO SYSTAT1) Open SYSTAT. Make sure your Excel file is closed or SYSTAT won't be able to open it.2) Go to "File" > "Open" > Data.3) Select "excel" <strong>for</strong> the file type. Pick the excel file you saved earlier. Pick the sheet with the<strong>for</strong>matted data. Remember don't try and import the pivot table. You want to import thetable with the data already <strong>for</strong>matted.REVISED SEPTEMBER 2012 283
STANDARD OPERATING PROCEDURES FOR SURFACE WATER QUALITY SAMPLINGAPPENDIX G SEPTIC SYSTEM DETECTION USING OPTICALBRIGHTENERSMonitoring <strong>for</strong> optical brighteners can be used to determine whether inadequate septic systems orother domestic wastewater discharges are impacting surface water quality. Optical brighteners arefluorescent white dyes that are added to almost all laundry soaps and detergents and are there<strong>for</strong>efound in domestic wastewaters that include laundry effluent. When optical brighteners are appliedto cotton fabrics, they absorb ultraviolet rays in sunlight and release them as blue rays. These bluerays interact with the natural yellowish color of cotton to give the appearance of being “whiter thanwhite.”Optical brighteners are removed from surface water by absorption onto soil and organic materialsand by photo decay (exposure to sunlight). The recovery of optical brighteners in surface water orground water is direct evidence that the cleansing of wastewater is ineffective.It is recommended that discharge measurements be taken when deploying the sample kits.EQUIPMENTThe following equipment is needed to collect optical brightener samples:EquipmentRigid, non-metal or vinyl coated racksStakes and tiesUseHolds cotton pad in the waterSecure racks in the stream and secure pad in therackCollects optical brightenersPound stakes into stream bedWhen handling racks and padsCotton padsHammerDisposable glovesWaders or rubber boots (optional)FlaggingMark sites – have to locate a week laterKnifeRemove ties or fishing linePlastic bagsFor cotton pads once collected<strong>Water</strong>proof markerLabel plastic bags with sample site infoBlack plastic lined box or other darkened Transportation of samples back to labcontainerMonofilament line (fishing line) and pins Drying cotton padsUltra-violet light, darkened roomLook <strong>for</strong> fluorescence(Colilert reading equipment works well)Be<strong>for</strong>e going in the field, check that equipment is clean and that the cotton pads and equipmentdo not fluoresce under ultra-violet light conditions.REVISED SEPTEMBER 2012 284
STANDARD OPERATING PROCEDURES FOR SURFACE WATER QUALITY SAMPLINGPLACEMENTOptical brightener sampling is best suited <strong>for</strong> small streams and drainages under base flowconditions (primarily ground water). Larger volumes of water (ponds, lakes, rivers, or runoffconditions) will likely dilute the concentration of optical brighteners to such a degree that itcannot be qualitatively detected. This is a presence / absence test.Use disposable plastic gloves to secure a cotton pad in a clean wire rack using plastic ties.Use metal stake, ties, or monofilament fishing line so the sampling rack holding the cotton padwill remain: Securely in place while allowing water to easily pass through it. Submerged within the flow of water <strong>for</strong> the next week. In a shaded location (sunlight naturally decays the brighteners). Almost invisible to a casual passerby.Mark the site with flagging tape so you will be able to find it in a week. Avoid placing the kitswhere a passerby may notice it, as they may tamper with the equipment.The optical brightener sample is generally exposed <strong>for</strong> seven (7) days to allow sufficient time <strong>for</strong>contact with optical brighteners. If background interference (sediment, algae, rust) or dryingconditions occur, the exposure time can be shortened. The exposure time can also be lengthened.SUPPORTING DATAThe reliability and sensitivity of this testing procedure, and conditions needed to detect opticalbrighteners in Arizona’s surface waters, are still being evaluated; there<strong>for</strong>e, other supporting dataand in<strong>for</strong>mation will be needed to properly interpret the optical brightener positive/negative tests.Collect and record the following additional in<strong>for</strong>mation:Flow data at each site when placing the sample kits.E. coli bacteria samples.Total nitrogen (TKN + nitrite/nitrate) and total phosphorus.Weather conditions when setting and in<strong>for</strong>mation concerning weather during the time thekits were exposed.Change in flow during the week (qualitative only).Field observations concerning sources.If this is a new site, record latitude and longitude and other site access in<strong>for</strong>mation needed tolocate the site.Photo document the site, taking upstream and downstream photos when setting out and whencollecting the samples.REVISED SEPTEMBER 2012 285
STANDARD OPERATING PROCEDURES FOR SURFACE WATER QUALITY SAMPLINGSAMPLE RETRIEVAL AND PROCESSINGUse single use gloves when handling the samples. Rinse the pads in the surface water to removeexcess sediment. If pads have become frail, rinse them while they remain in the rack.Gently remove the cotton pads, place them in plastic bags, and label the bags with sitein<strong>for</strong>mation. Label should show location, day of placement, and day of removal.Place pads in a dark place during transportation (remember sun will degrade the brighteners).Directions indicate that pads should be dried overnight on monofilament line. Be sure that padsremain labeled. Watch out <strong>for</strong> cross-contamination as most labeling papers and cotton stringcontain whiteners.DATA ANALYSES AND INTERPRETATIONView each pad under ultra-violet fluorescent light in a dark room on a clean table. Turn off lights,close doors, and take all measure possible to prevent ambient light from entering the analysesroom.Compare each pad to a non-exposed sampling pad and a pad exposed to optical brighteners as acontrol.Report results as: Positive (fluorescence – it glows), Negative (no fluorescence – just like the control), or Inconclusive.In some instances only a portion of the pad will fluoresce. This is usually due to uneven exposureof the pad to the dye in the watercourse. It should be considered positive.Specks or spots of fluorescence on the sample or control pads are likely due to paper or cottondust and do not indicate a positive result.When in doubt, call it “inconclusive”.Record results on the Optical Brightener Data Sheet.The presence or absence of optical brighteners in a stream can be used to determine TMDLimplementation or <strong>Water</strong> Quality Improvement Grant Project effectiveness.However, the absence of optical brighteners should be interpreted based on supporting evidencesuch as flow conditions, bacteria samples, potential sources, and precipitation. For example, higherstream flows could have diluted dyes, resulting in negative tests.REVISED SEPTEMBER 2012 286
STANDARD OPERATING PROCEDURES FOR SURFACE WATER QUALITY SAMPLINGADEQ Optical Brightener Data SheetMonitoring Project Name: ________________________________________________________________________________________________<strong>Surface</strong> <strong>Water</strong>(s): _______________________________________________________________________________________________________Date Equipment Placed: ____________________ Date Equipment Retrieved: _____________________________ Days in Stream ____________Method of flow: __________________________ NAD <strong>for</strong> Lat/Long ________________Monitoring Staff: _______________________________________________________________________________________________________Comments: ____________________________________________________________________________________________________________Site Name Site IDs LatitudeLongitudeFlow(cfs)BacteriaResults(CFU)Optical Brightener(Pos/Neg/Inconclusive)Field ObservationsREVISED SEPTEMBER 2012 287
STANDARD OPERATING PROCEDURES FOR SURFACE WATER QUALITY SAMPLINGAPPENDIX H FLOAT SWITCH CONSTRUCTIONThe current basic float switch design used to trigger deployed autosamplers is outlined below, seeFIGURE 1 <strong>for</strong> complete float switched housed on two-inch well casing. The design is open torefinement and redesign based on specific project needs.Materials needed <strong>for</strong> one float switchFloat Switch (Grainger part number 4YM35)2” PVC slotted well screen (1.5-2’ length)1” PVC cap5/32” drill bit3/8” drill bit#6 1.5” length screw with nut, wing nut, and washerTools NeededDrillRadial sawScrewdriverPliersConstructionFloat switch assemblyDrill 3/8” hole in bottom of 1” PVC cap;Thread float switch into hole- should screw in; if loose use glue/caulking/sealant to affix to cap;Drill 5/32” hole into upper third of 1” PVC cap;Insert #6 screw through hole so that the threads are exposed on the outside of the cap; andTighten nut onto screw- if loose the wing nut will not tighten properly.Well CasingUse a radial or circular saw to cut slot in solid portion of well casing leaving approximately 2-3” onboth sides of the slot.Complete AssemblyInsert float switch assembly into well casing by placing exposed screw threads through the slot inthe well casing; andPlace washer and wing nut onto screw threads and tighten.REVISED SEPTEMBER 2012 288
STANDARD OPERATING PROCEDURES FOR SURFACE WATER QUALITY SAMPLINGFIGURE 1. Float switch assembly installed into well screen PVC pipeFLOAT SWITCH INSTALLATIONFloat switches are intended to enable autosampler programs as water levels rise causing the float tocomplete the circuit. The float switches are connected to the autosamplers via half cables (ISCOpart # 790 and Sigma part #541), normally 25’ in length. The half cables are connected directly tothe float switch wires or via a two-wire junction wire. The ISCO half cables consist of only twowires whereas the Sigmas contain six (6). It does not matter how the ISCO half cables areconnected to the two wires on the float switch. However, when using the Sigma half cables, theblue and black wires must be connected to the float switch wires.The float switch consists of a donut-shaped float that moves up and down a rod with a retainingclip on the bottom. The ISCO and Sigma autosampler programs are triggered when the circuitcreated by the half cable and float switch is either opened (ISCO) or closed (Sigma). In order tochange whether the circuit is opened or closed under “dry” conditions, the donut-shaped float canbe removed, reversed and reinstalled. A test trigger should be conducted to ensure that the floatswitch is functioning properly prior to final installation and during maintenance events.The float switches are placed in the stream bottom and set to trigger the autosampler when thewater level rises sufficiently to engage the float. The float switch assembly can be mounted oneither a bedrock outcrop (preferred) or on a masonry brick or garden paver using 2” fence postmounting brackets. Ideally access to the float switch assembly will be unobstructed afterinstallation. Periodic cleaning and maintenance may be needed. Mounting to rock or brickrequires a hammer drill, masonry drill bit, generator, sledge hammer, anchor bolts and nuts, andan appropriately sized wrench. Prior to installation proper authorization shall be received inwriting from the land owner or managing entity.REVISED SEPTEMBER 2012 289
STANDARD OPERATING PROCEDURES FOR SURFACE WATER QUALITY SAMPLINGAPPENDIX IPROCEDURESGENERAL LEVEL LOGGER MAINTENANCE FIELDNeeded items Laptop Communication cable Extra battery Equipment keys Field notebook Calibration check pipeDownload/maintenance instructions Update laptop clock to cellular phone or GPS unit Open appropriate program Record device serial number in field notebook Note time difference between logger and laptop in field notebook Download historical data, note number of records in field notebook Save data to file, note file path in field notebook Check file; verify it contains data Delete historical data from logger Clear memory and resynchronize clock Check and note real-time reading in field notebook If needed change battery and note in field notebook, reconnect to laptop and verify properoperationUpon return to office Transfer files to desktop or data disk Delete data from laptopNotes to make in field notebook include: Device serial number Time difference of equipment to laptop Number of records in memory Data file name Note actions taken: Memory cleared, resynchronize clock Battery status (if equipped) Real-time reading General notes- changed battery, observations, etc.REVISED SEPTEMBER 2012 290
STANDARD OPERATING PROCEDURES FOR SURFACE WATER QUALITY SAMPLINGAPPENDIX JAUTOSAMPLER DEFAULT AND RECOMMENDEDPROGRAM SETTINGS FOR TMDL STORM SAMPLINGThe following values are presented as provisionally-recommended program settings <strong>for</strong> Sigma 900and ISCO 6712 samplers used in storm water sample collection. Site and/or project-specificobjectives may differ from the assumptions underlying this template; consequently, site or projectspecificsettings may need to deviate from the settings presented here. The sampler is advised touse this guide as a generic template from which a sampling collection program may be constructedconsistent with the sampler’s objectives.Sigma 900 MaxMain Menu Setup Modify All Items Number of Bottles: 24Bottle Volume: 1000 mlIntake Tube Length: Set <strong>for</strong> project site locationIntake Tube Type: 3/8” VinylProgram Lock: DisabledProgram Delay: DisabledSample Collection: Time proportionalInterval:1 hr 00 min- determined by project needsTake First Sample: ImmediatelyDeliver Each Sampleto All Bottles?: No (or Set <strong>for</strong> project objectives)Choose a Method of Distribution: Bottles per Sample (or Set <strong>for</strong> project objectives)Bottles per Sample: 2Liquid Sensors: EnabledSample Volume: 1000 mlIntake Rinses: 1 (variable)Sample Retries: 3 (variable)Site ID:Not Necessary / BypassDo you wish to access the Advanced <strong>Sampling</strong> Features?: Yes to Setpoint <strong>Sampling</strong> and SelectSetpoint <strong>Sampling</strong>:Type of Control:Input Channel:Delay when inputbecomes active:EnabledStart on SetpointExternal Control00:01 (hrs:min) (or Set <strong>for</strong> project objectives)Loaded Program: 1RS232 Baud Rate: Not Necessary / BypassREVISED SEPTEMBER 2012 291
STANDARD OPERATING PROCEDURES FOR SURFACE WATER QUALITY SAMPLINGExternal Control: Delay: 1 minuteInstalled Memory: Not Necessary / BypassExternal Power: Not Necessary / BypassMemory Mode: Not Necessary / BypassProgram Complete Output: Not Necessary / BypassSpecial Output: Not Necessary / BypassUpset <strong>Sampling</strong>: Not Necessary / BypassISCO 6712 ProgramProgram Name: Not necessary / BypassLength Units: ftNumber of Bottles: 24Bottle Volume: 1000 mlSuction Line Length: Set <strong>for</strong> project site locationAuto Suction Head: Keep as defaultNumber of Rinses: Set from 1-3Number of Retries: Set from 1-3One-part Program: YesTime Paced/Flow Paced:Time pacedDistribution: SequentialSample Volume: 1000 mlEnable: None programmedEnable:Once enabled stay enabledEnable: 0 pauses and resumesNo delay to start: Keep as defaultREVISED SEPTEMBER 2012 292
STANDARD OPERATING PROCEDURES FOR SURFACE WATER QUALITY SAMPLINGAPPENDIX K BORDER AREA CONTACT INFORMATIONTUCSON SECTOR STATIONSAjo Station850 North Highway 85Ajo, AZ 85321-9634Phone: (520) 387-7002Fax: (520) 387-6620Area of Responsibility: The Ajo Station is located nine miles south of Ajo, Arizona, along StateRoute 85, and approximately 120 miles west of the Tucson Sector headquarters. The internationalborder and the Lukeville Port of Entry lie approximately 27 miles south of the station.The Ajo area of responsibility encompasses a total of 64.3 miles along the international border andnearly 7000 square miles of operational area. The border area begins at the Papago Farms on theTohono O’Odham Nation, continuing west through the Organ Pipe Cactus National Monumentand the Lukeville Port of Entry, and ends south of the Granite Mountains on the Cabeza PrietaNational Wildlife Refuge at the Pima County / Yuma County line.Casa Grande Station396 Camino MercadoCasa Grande, AZ 85222Phone: (520) 836-7812Fax: (520) 423-2341Area of Responsibility: Currently (April, 2007), the Casa Grande Station patrols 44.2 miles oflinear border on the Tohono O’odham Nation. Casa Grande Agents also patrol the Eloy andPhoenix metropolitan areas. Agents are assigned to Sky Harbor Airport and the Phoenix Metrobus stations and respond to other Arizona cities such as Globe, Apache Junction, Oracle Junction,and San Manuel.Douglas Station1608 S. Kings HighwayDouglas, AZ 85607Phone: (520) 805-6900Fax: (520) 805-8080Area of Responsibility: The Douglas Station is one of eight stations in the Tucson Sector thatensures the successful implementation of the service’s Southwest Border Strategy. The DouglasStation’s area of responsibility (AOR) covers 40.5 linear miles of the International Border withMexico and includes over 1450 square miles of mountainous terrain, with a few small valleys tothe north of the International Border.Naco Station2136 South Naco HighwayBisbee, AZ 85603REVISED SEPTEMBER 2012 293
STANDARD OPERATING PROCEDURES FOR SURFACE WATER QUALITY SAMPLINGPhone: (520) 432-5121Fax: (520) 432-5219Area of Responsibility: The Naco Border Patrol Station’s area of responsibility (AOR) is locatedwithin Cochise County in south east Arizona covering approximately 1,175 square miles. Thisincludes 32.5 miles of International Boundary with the areas of Agua Prieta, Sonora, Mexico,Naco, Sonora, Mexico, and Cananea, Sonora, Mexico. The station’s AOR commences near PaulSpur west of Douglas, Arizona, continuing west through the San Pedro River Valley to the crest ofthe Huachuca Mountains in the Coronado National Forest. The AOR includes the cities andtowns of Sierra Vista, Arizona, Here<strong>for</strong>d, Arizona, Palominas, Arizona, Huachuca City, Arizona,Whetstone, Arizona, Tombstone, Arizona, Bisbee, Arizona and Naco, Arizona. The Naco BorderPatrol Station is also responsible <strong>for</strong> sections of Arizona State Highways 92, 80, 90, and 82 with atemporary highway checkpoint near milepost 304 on Highway 90.Nogales Station1500 West La Quinta RoadNogales, AZ 85621Phone: (520) 761-2400Fax: (520) 761-2628Area of Responsibility: As of May, 2007, the Nogales Border Patrol Station has become the largestBorder Patrol Station in the United States. Agents are tasked to patrol 1,100 square miles of roughterrain, including 32 miles of International Border. Nogales Station’s area encompasses manyurban areas like Nogales, Rio Rico, Tubac, Patagonia, Amado, and Green Valley. The CoronadoNational Forest is also a large part of the western sector of Nogales area of responsibility.Sonoita StationPO Box 37 (mailing)3225 Highway 82Sonoita, AZ 85637Phone: (520) 455-5051Fax: (520) 455-5807Area of Responsibility: The Sonoita Station is located near the junction of State Routes 82 and 83in Santa Cruz County. The station lies approximately 25 miles north of the international borderand about 49 miles southeast of the Tucson Sector Headquarters. The Station is responsible <strong>for</strong>patrolling 24.3 linear miles of international border and an overall area that encompasses nearly1,000 square miles. This area stretches from the Patagonia Mountains in the west, to theHuachuca Mountains in the east, and near Interstate 10 to the north.Tucson Station2430 S. Swan RoadTucson, AZ 85711Phone: (520) 514-4700Fax: (520) 514-4760Area of Responsibility: The Tucson Station is a very unique station. It is considered a linewatchstation, responsible to patrol the border east and west of Sasabe, Arizona. Because it is located 68REVISED SEPTEMBER 2012 294
STANDARD OPERATING PROCEDURES FOR SURFACE WATER QUALITY SAMPLINGmiles north of the international border, it is also considered an interior station with responsibility<strong>for</strong> the vast majority of Pima County.Willcox Station530 East Grant StreetP.O. Box 909 (For mail)Willcox, AZ 85643Phone: (520) 384-4424Fax: (520) 384-4092Area of Responsibility: The Willcox Station does not have responsibility <strong>for</strong> a border area but islocated in a geographically strategic position to conduct traffic operations on a variety of routes ofegress throughout the corridor. U.S. Interstate 10, Highways 80, 191, and 90 all travel through theWillcox AOR. Willcox also conducts sign-cutting, sensor response, night scope operations, andranch patrol.YUMA SECTORYuma Station4151 S. Avenue AYuma, AZ 85365Phone: (928) 341-2800Fax: (928) 344-1184Area of ResponsibilityThe station has 48 miles of Sonora land border, 10.75 miles of Baja Cali<strong>for</strong>nia land border, and15.25 miles of Baja Cali<strong>for</strong>nia river border, <strong>for</strong> a total of 74 miles.CORONADO NATIONAL FORESTDouglas Ranger District1192 West Saddleview RoadDouglas, AZ 85607(520) 364-3468(520) 364-6667 FAXNogales Ranger District303 Old Tucson Rd.Nogales, AZ 85621(520) 281-2296(520) 281-2396 FAXSaf<strong>for</strong>d Ranger District711 14th Avenue, Suite DSaf<strong>for</strong>d, AZ 85546(928) 428-4150REVISED SEPTEMBER 2012 295
STANDARD OPERATING PROCEDURES FOR SURFACE WATER QUALITY SAMPLING(928) 428-2393 FAXSanta Catalina Ranger District5700 N. Sabino Canyon Rd.Tucson, AZ 85750(520) 749-8700(520) 749-7723 FAXSierra Vista Ranger District5990 S. Hwy. 92Here<strong>for</strong>d, AZ 85615(520) 378-0311(520) 378-0519 FAXCOUNTY SHERIFFSCochise CountyBenson Patrol District126 West 5th StreetBenson, Arizona 85602(520) 586-8150Bisbee Patrol District205 North Judd DriveBisbee, Arizona 85603(520) 432-9500Douglas Patrol District661 G AvenueDouglas, Arizona 85607(520) 805-5670Sierra Vista Patrol District100 Colonia De Salud, Suite 106Sierra Vista, Arizona 85635(520) 803-3850Willcox Patrol District450 South Haskell AvenueWillcox, Arizona 85603(520) 384-7050Pima CountyGreen Valley District Office601 N. La Canada DriveREVISED SEPTEMBER 2012 296
STANDARD OPERATING PROCEDURES FOR SURFACE WATER QUALITY SAMPLINGGreen Valley, Arizona 85614-3440Phone (520) 351-6711Santa Cruz1250 N Hohokam DrNogales, AZ 85621Tel: (928) 761-7869YumaDistrict 1 – Foothills13190 E. South Frontage RoadYuma, AZ 85367Tel: (928) 342-1477Fax: (928) 345-1164District 2 – Westside3620 W. 8th StreetYuma, AZ 85364-2585Tel: (928) 782-3192BUREAU OF LAND MANAGEMENTSaf<strong>for</strong>d Field Office711 14th AvenueSaf<strong>for</strong>d, AZ 85546-3337Phone: (928) 348-4400Fax: (928) 348-4450Tucson Field Office12661 East BroadwayTucson, AZ 85748-7208Phone: (520) 258-7200Fax: (520) 258-7238Yuma Field Office2555 East Gila Ridge RoadYuma, AZ 85365-2240Phone: (928) 317-3200Fax: (928) 317-3250Lower Sonoran Field Office21605 North 7th AvenuePhoenix, AZ 85027-2929623-580-5500Fax: 623-580-5580REVISED SEPTEMBER 2012 297
STANDARD OPERATING PROCEDURES FOR SURFACE WATER QUALITY SAMPLINGREFERENCESADEQ, Bottom Deposits Implementation <strong>Procedures</strong>, 2011.ADEQa, undated. Willow quick ID guideADEQ, 2007. Draft <strong>Surface</strong> <strong>Water</strong> Section Quality Assurance Program Plan. Phoenix, Arizona.ADEQb, undated. Riparian tree quick ID guide.Argus, G.W.1995. Salicaceae: willow family key. Journal of the Arizona-Nevada Academy ofScience 29:1.Arizona Administrative Code Title 18, Chapter 11, Article 1.Armantrout, N.B., compiler. 1998. Glossary of Aquatic Habitat Inventory Terminology.American Fisheries Society, Bethesda, MD.Bain and Stevenson, eds. 1999.Barbour, M.T., J. Gerritsen, B.D. Snyder, and J.B. Stribling. 1999. Rapid bioassessment protocols<strong>for</strong> use in streams and wadeable rivers: periphyton, benthic macroinvertebrates, and fish, Secondedition. EPA 841-B-99-002. U.S. Environmental Protection Agency, Washington, D.C.Bevenger, G.S. and R.M. King. 1995. A Pebble Count Procedure <strong>for</strong> Assessing <strong>Water</strong>shedCumulative Effects. USDA Forest Service Research Paper RM-RO-319, Fort Collins, CO.Brockman, C.F.1968. Trees of North America. Golden Press, New York.Clesceri, L. S., A. E. Greenberg, A. D. Eaton (eds). 1998. <strong>Standard</strong> Methods <strong>for</strong> the Examinationof <strong>Water</strong> and Wastewater 20th Edition. American Public Heath Association. Washington, DC.Corbett, D. M. 1962. Stream-gaging procedure. U.S. Geological Survey, <strong>Water</strong>-Supply Paper 888,Washington, DC.Edwards, T.K. and G.D. Glysson. 1999. Field Methods <strong>for</strong> Measurement of Fluvial Sediment.U.S. Geological Survey, Open File Report 86-531, Reston, VA.Elmore, F.H. and J.R. Janish, 1976. Shrubs and Trees of the southwest uplands. Southwest Parksand Monuments Association, Tucson, AZ.EPA Method 1669, <strong>Sampling</strong> Ambient <strong>Water</strong> <strong>for</strong> Determinations of Metals at EPA <strong>Water</strong> QualityCriteria Levels (undated).REVISED SEPTEMBER 2012 298
STANDARD OPERATING PROCEDURES FOR SURFACE WATER QUALITY SAMPLINGGlobal <strong>Water</strong> Instruments Inc. 2002, User's Manual.Gray, John R., et al. 2000. Comparability of Suspended Sediment Concentration and TotalSuspended Solids Data. U.S. Geological Survey, <strong>Water</strong> Resources Investigations Report 00-4191(August).Hach Company. 1993. Model 2100P Portable Turbidity Instruction Manual. Loveland, CO.Hach Company. 1993. Model DR/700 Portable Colorimeter Instrument Manual. Loveland,CO.Harrelson, C.C., C.L. Rawlins, and J.P. Potyondy. 1994. Stream channel reference sites: anillustrated guide to field technique. Gen. Tech. Rep. RM-245. U.S. Department of Agriculture,Forest Service, Rocky Mountain Forest and Range Experiment Station. 61pp.Hem, J.D., 1989. U.S. Geological Survey <strong>Water</strong>-Supply Paper 2254. Study and Interpretation ofthe Chemical Characteristics of Natural <strong>Water</strong>. U.S. Gov’t. Printing Office, Washington, D.C.http://fisp.wes.army.mil/Instructions%20US_DH-81_010612.pdfHydrolab Corporation. 1997. DataSonde 4 and MiniSonde, <strong>Water</strong> Quality Multiprobes, User’sManual. Austin, TX.In-situ Corporation. 2003. Troll 9000 Level Logger, User's Manual.Lawson, L. and H. Huth, 2003. Lower Cienega Creek Restoration Evaluation Project: AnInvestigation into Developing Quantitative Methods <strong>for</strong> Assessing Stream Channel PhysicalCondition. ADEQ Report #EQR0303, Arizona Department of Environmental Quality, Phoenix,AZ.Lawson, L., 2008. Unpublished data.Lazorchak, J.M., D.J.Klemm, D.V.Peck (editors). 1998. Environmental Monitoring andAssessment Program-<strong>Surface</strong> waters: field operations and methods <strong>for</strong> measuring the ecologicalcondition of wadeable streams.EPA/620/R-94/004F. Environmental Protection Agency,Washington, D.C.Leopold, L.B., M.G. Wolman, and J.P. Miller. 1964. Fluvial Processes in Geomorphology. DoverPublications, Inc., New York.Little, E.L.1968. Southwestern Trees, a guide to the native species of New Mexico and Arizona.Agriculture Handbook #9, USDA, Forest Service, Washington, D.C.REVISED SEPTEMBER 2012 299
STANDARD OPERATING PROCEDURES FOR SURFACE WATER QUALITY SAMPLINGMarsh-McBirney, Inc. 1990. MMI Model 2000 Flo-Mate Portable <strong>Water</strong> Flowmeter InstructionManual. Frederick, MD.Moody, T. and W. Odem. 1999. Regional relationships <strong>for</strong> bankfull stage in natural channels ofCentral and Southern Arizona. Prepared <strong>for</strong> USDA Forest Service and Arizona Department ofEnvironmental Quality.Moody, T., M. Wirtanen, and S.N. Yard. 2003. Channel Stability Assessment <strong>for</strong> Biocriteria Sitesin the Verde River <strong>Water</strong>shed. Prepared <strong>for</strong> the Arizona Department of Environmental Quality,Phoenix, AZ.Moody, T., M. Wirtanen, and S.N. Yard. 2003. Validating the Bank Erodibility Hazard Index inCentral and Southern Arizona. Prepared <strong>for</strong> the Arizona Department of Environmental Quality.Phoenix, AZ.Pfankuch, D.J. 1975. Stream reach inventory and channel stability evaluation. USDA ForestService, R1-75-002. Government Printing Office #696-260/200, Washington, D.C.: 26 pp.Platts, W.S., C. Armour, G.D. Minshall, M. Bryant, J.L. Buf<strong>for</strong>d, P. Cuplin, S. Jensen, G.W.Lienkaemper, G.W. Minshall, S.B. Monsen, R.L. Nelson, J.R. Sedell, and J.S. Tuhy. 1987.Methods <strong>for</strong> evaluating riparian habitats with applications to management. Gen. Tech. ReportINT-221. U.S. Department of Agriculture, Forest Service, Intermountain Research Station.Ogden, Utah. 177 pp.Prescott, G.W. 1978. How to know the freshwater algae, third edition. The pictured key natureseries, Wm. C. Brown Company Publishers, Dubuque, Iowa.Prichard, D., H. Barrett, J. Cagney, R. Clark, J. Fogg, K. Gebhart, P.L. Hansen, B. Mitchell, and D.Tippy. 1993. Riparian Area Management: Process <strong>for</strong> Assessing Proper Functioning Condition.TR 1737-9 (Revised 1998). Bureau of Land Management, BLM/SC/ST-93/003+1737+REV95+REV98, Service Center, CO. 51 pp.Ramey, V. 1995. Aquatic plant identification deck. University of Florida, Institute of Food andAgricultural Sciences publication #SM50. Order by phone at (904) 392-1799.RiverMorph, 2002. RiverMorph User’s Manual v2.0. Louisville, KY (www.RiverMorph.com)Rosgen, D. 2001a. Abridged River assessment and morphology (RAM) <strong>for</strong>ms. WildlandHydrology. Pagosa Springs, CO.Rosgen, D. and H.L. Silvey. 1996. Applied River Morphology. Wildland Hydrology. PagosaSprings, CO.REVISED SEPTEMBER 2012 300
STANDARD OPERATING PROCEDURES FOR SURFACE WATER QUALITY SAMPLINGRosgen, D.L. 1994. A classification of natural rivers. Catena 22:169-199.Rosgen, D.L. 2001. Stream stability and sediment supply assessment protocols. Level III ShortCourse materials. Wildland Hydrology. Pagosa Springs, CO.Rosgen, D.L. 2001a. A stream channel stability assessment methodology. Wildland Hydrology.Pagosa Springs, CO.Rosgen, D.L. 2001c. Stream stability and sediment supply assessment protocols. Level III ShortCourse materials. Wildland Hydrology. Pagosa Springs, CO.Rosgen, D.L. 2003. Seven methods <strong>for</strong> estimating Near-Bank Stress in natural channels. WildlandHydrology. Pagosa Springs, CO.Szaro, R.C. 1989. Desert Plants: Riparian <strong>for</strong>est and scrubland community types of Arizona andNew Mexico. University of Arizona and Boyce Thompson Southwestern Arboretum, Desert Plants9(3-4).U.S.G.S., 2004. National Field Manual <strong>for</strong> the Collection of <strong>Water</strong>-Quality Data. U.S. Dept. ofthe Interior, U.S. Geological Survey Techniques of <strong>Water</strong>-Resources Investigations, Book 9,Handbook <strong>for</strong> <strong>Water</strong>-Resources Investigations, Chapter A3. Cleaning of Equipment <strong>for</strong> <strong>Water</strong><strong>Sampling</strong>. Reston, VA. URL http://Pubs.water.usgs.gov/twri9A/US Code of Federal Regulations (Title 40 Part 122, Section 136, Table II)USDA. 1998. Stream Corridor Restoration, principles, processes, and practices.www.USDA.gov/stream_restoration/newtofc/ .USEPA Method 1669, <strong>Sampling</strong> Ambient <strong>Water</strong> <strong>for</strong> Determinations of Metals at EPA <strong>Water</strong>Quality Criteria Levels (undated).www.IDEXX.com.REVISED SEPTEMBER 2012 301