PDF 8409 KB - TEP.com
PDF 8409 KB - TEP.com
PDF 8409 KB - TEP.com

Create successful ePaper yourself
Turn your PDF publications into a flip-book with our unique Google optimized e-Paper software.
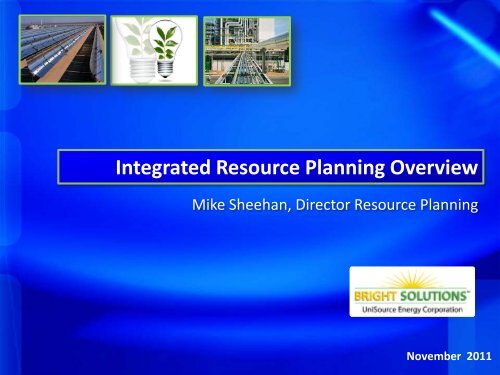
Integrated Resource Planning Overview<br />
Mike Sheehan, Director Resource Planning<br />
November 2011
Website and Contact Info<br />
<strong>TEP</strong> Website<br />
http://www.tep.<strong>com</strong>/Company/News/index.asp<br />
• Presentations will be posted after each workshop<br />
<strong>TEP</strong> Contact<br />
<strong>TEP</strong>IRP@<strong>TEP</strong>.COM<br />
• Questions and Comments<br />
2
Workshop Agenda<br />
Resource Planning Overview<br />
<strong>TEP</strong> History<br />
Load Forecast<br />
Loads and Resources<br />
Energy Efficiency<br />
Renewables and Distributed Generation<br />
Environmental Planning Strategies<br />
Portfolio Strategies<br />
3
Integrated Resource Planning<br />
• A detailed evaluation of Loads and Resources<br />
• Based on current “best view” of the future<br />
• Run market sensitivities around possible future out<strong>com</strong>es<br />
• The basis for a set of near-term actionable items<br />
• A continuous process<br />
Preferred Plan<br />
Contingency<br />
Plan 1<br />
Contingency<br />
Plan 3<br />
Contingency<br />
Plan 5<br />
Contingency<br />
Plan 2<br />
Contingency<br />
Plan 4<br />
2010 2012 2014 2016 2018 2020 2022 2024 2026 2028 2030<br />
4
Why do an IRP<br />
• New Resource Planning Rules<br />
• Ensure system reliability<br />
• Develop strategic long-term business plans<br />
• Take advantage of resource opportunities<br />
• Minimize future costs and risks<br />
5
Input Assumptions<br />
• Future Resource Assumptions<br />
– PACE Global<br />
– Wood MacKenzie<br />
– Electric Power Research Institute (EPRI)<br />
– Black & Veatch<br />
– National Renewable Energy Laboratory (NREL)<br />
– Navigant Consulting<br />
– ICF International<br />
– National Energy Technology Laboratory (NETL)<br />
– Request for Proposals (RFPs)<br />
• Independent Third-Party Data Sources<br />
– Avoid internal biases<br />
– In-depth analysis behind data<br />
– Forward thinking out<strong>com</strong>es
Minimum Planning Requirements<br />
• Demand/Reserve Margin – 15% Planning Reserve<br />
• REST Compliance – 15% by 2025<br />
• Energy Efficiency Targets – 22% by 2020<br />
• Load Serving Capability
Environmental Impacts<br />
Evaluation Criteria<br />
CO 2 SO 2 NO x PM 10 Hg Coal Ash<br />
Water Usage<br />
Financial Requirements<br />
Capital Requirements<br />
Rate Impacts<br />
Economic Development<br />
Support Local Economy<br />
Support Arizona “Green” Industry<br />
8
Managing Portfolio Risk<br />
• Load Forecast & Energy Efficiency Risk<br />
– Short lead times<br />
– Scalable resources<br />
– Wholesale Market flexibility<br />
• Performance Risk<br />
– Proven technologies<br />
– Counterparty diversity<br />
– Intermittent resources<br />
• Fuel & Environmental Risk<br />
– Portfolio diversity<br />
– Target cost effective “zero-emission” resources<br />
9
An Historic Look at Tucson Electric Power<br />
Kevin Battaglia – Resource Planning<br />
November 2011
First Power Plant downtown on N. Church Street
1904 Power Plant moves to 220 W. Sixth Street
Changes in the 60’s<br />
4
Until 1942 <strong>TEP</strong> was an electrical island,<br />
disconnected from other utilities<br />
NEVADA<br />
Davis<br />
Dam<br />
PHOENIX<br />
Tucson
1950 Demoss Petrie 100 MW
Irvington Station first unit 1958<br />
• Eventually, there would be four units producing 422 MW<br />
• Tucson’s population in 1958 was 230,000
1964 Interconnection to Arizona Public Service at Saguaro<br />
PHOENIX<br />
Tucson’s population was 309,000<br />
Saguaro (APS)<br />
TUCSON<br />
Being connected to other utilities allows sales of excess power and it provides outside<br />
support in emergencies.
1969 Four Corners Units 4 & 5 – 110MW<br />
Tucson’s population was 345,000<br />
Participation: Southern California Edison: 48 %<br />
Arizona Public Service: 15 %<br />
Public Service Co. of New Mexico: 13 %<br />
Salt River Project: 10 %<br />
Tucson Electric Power: 7 %
1972 Palo Verde – 521 MW<br />
By 1975, management saw that slower than expected load growth and higher<br />
than forecast costs did not merit the risk of such a large project. In 1975 <strong>TEP</strong>’s<br />
interest in Palo Verde was sold.
Future Expansion requires more Transmission<br />
Tucson’s population was 416,000<br />
The 345 KV San Juan to Vail line is <strong>com</strong>pleted in 1973 at a cost of $89 million
Transmission Resources<br />
San Juan<br />
McKinley<br />
PHOENIX<br />
Saguaro<br />
Greenlee<br />
Tortolita<br />
South<br />
Tucson<br />
Irvington<br />
Vail<br />
November 2011<br />
12
1973 - San Juan Units 1 & 2 - 340 MW<br />
Participation: Public Service Company of NM 50%<br />
Tucson Electric Power 50%
1974 - Navajo - 112 MW<br />
By 1985 Tucson’s population was 612,000<br />
Participation: United States Bureau of Reclamation 24.3%<br />
Salt River Project: 21.7 %<br />
Los Angeles Dept. of Water & Power: 21.2 %<br />
Arizona Public Service: 14 %<br />
Nevada Energy 11.3%<br />
Tucson Electric Power: 7.5 %
Navajo Southern Transmission 500 KV Addition<br />
Navajo<br />
Four Corners<br />
San Juan<br />
Moenkopi<br />
McKinley<br />
Cholla<br />
PHOENIX<br />
West Wing<br />
Greenlee<br />
Saguaro<br />
Tortolita<br />
South<br />
Tucson<br />
Sundt<br />
Vail<br />
15
Springerville Generating Station 1985 – 780MW<br />
Participation: Tucson Electric Power 100% of Units 1 & 2<br />
Tri- State Generation & Transmission 100% of Unit 3<br />
Salt River Project: 100% of Unit 4<br />
16
Springerville Transmission<br />
Navajo<br />
Four Corners<br />
San Juan<br />
NEVADA<br />
Mead<br />
Kingman<br />
Moenkopi<br />
McKinley<br />
Cholla<br />
Springerville<br />
PHOENIX<br />
West Wing<br />
Greenlee<br />
Saguaro<br />
Tucson<br />
Irvington<br />
South<br />
Vail<br />
November 2011<br />
17
Luna Station – 2006- 190MW<br />
Participation: Tucson Electric Power 33.33%<br />
Public Service Company of New Mexico 33.33%<br />
Freeport – McMoRan Copper & Gold 33.33%<br />
18
Population Growth vs. Generation Growth<br />
Generation Capacity KW<br />
Population<br />
1,800,000.00<br />
3,000,000<br />
1,600,000.00<br />
1,400,000.00<br />
2,500,000<br />
Population<br />
1,200,000.00<br />
1,000,000.00<br />
800,000.00<br />
2,000,000<br />
1,500,000<br />
Capacity, kW<br />
600,000.00<br />
1,000,000<br />
400,000.00<br />
200,000.00<br />
500,000<br />
0.00<br />
1900 1910 1920 1930 1940 1950 1960 1970 1980 1990 2000 2010 2020 2030<br />
-
Where we are now<br />
Today <strong>TEP</strong> has over 2,245 MWs of owned Capacity from Coal, Natural Gas and Solar.<br />
We have contracted to purchase additional capacity from Wind and Solar.<br />
Navajo<br />
Four Corners<br />
San Juan<br />
NEVADA<br />
Kingman<br />
Moenkopi<br />
McKinley<br />
Cholla<br />
Yavapai<br />
Springerville<br />
Palo Verde<br />
Hassayampa<br />
Pinal West<br />
PHOENIX<br />
West Wing<br />
Pinal Central<br />
Saguaro<br />
Greenlee<br />
Tortolita<br />
South<br />
Tucson<br />
Sundt<br />
Vail<br />
Luna<br />
Tucson Population in 2011 is approximately 1 million
UNS-Electric<br />
Black Mountain (Kingman) - 2008 – 90 MW<br />
21
UNS-Electric<br />
Valencia (Nogales) – Four Combustion Turbines - 1989 – 61 MW
2012 IRP Reference Case Load Forecast<br />
Jon M. Bowman<br />
Sr. Supply Side Planner<br />
November 2011
Objectives<br />
• Provide an overview of recent energy, demand, and customer<br />
growth trends at <strong>TEP</strong> and UNSE<br />
• Outline the energy and peak demand assumptions in the IRP<br />
Base (Reference) Case<br />
• Discuss major risks to the load forecast and the methods used<br />
to address uncertainty<br />
2
<strong>TEP</strong> and UNSE Service Territories<br />
UTAH<br />
COLORADO<br />
NEVADA<br />
Mead<br />
Navajo<br />
Kayenta<br />
Ship Rock<br />
Four Corners<br />
Navajo<br />
San Juan<br />
San Juan<br />
Mine<br />
Davis<br />
Black Mountain<br />
Kingman<br />
Griffith<br />
N. Havasu Lake<br />
Havasu<br />
Parker<br />
City<br />
Peacock<br />
Pinnacle<br />
Peak<br />
Palo Verde<br />
Pinal West<br />
Liberty<br />
Prescott<br />
Yavapai<br />
West Wing<br />
Phoenix<br />
Saguaro<br />
Moenkopi<br />
Flagstaff<br />
South<br />
Cholla<br />
Tucson<br />
Sundt<br />
Vail<br />
Coronado<br />
Springerville<br />
Greenlee<br />
McKinley<br />
Mine<br />
Hidalgo<br />
McKinley<br />
Luna<br />
Lee Ranch<br />
NEW MEXICO<br />
Service Areas<br />
<strong>TEP</strong><br />
UNS Gas<br />
UNS Gas & Electric<br />
UNS Electric<br />
High Voltage<br />
Transmission Lines<br />
Generating Station<br />
Coal Mine<br />
Interconnection With Other Utility<br />
Substation<br />
Solar Station<br />
MEXICO<br />
Valencia<br />
Nogales<br />
3
<strong>TEP</strong> 2010 Sales by Rate Class<br />
OPA<br />
2%<br />
Mining<br />
12%<br />
Industrial<br />
23%<br />
Residential<br />
42%<br />
Commercial<br />
21%<br />
4
<strong>TEP</strong> Residential Customer Growth<br />
400,000<br />
3.00%<br />
Year End Residential Customers<br />
390,000<br />
380,000<br />
370,000<br />
360,000<br />
350,000<br />
340,000<br />
330,000<br />
320,000<br />
310,000<br />
2.50%<br />
2.00%<br />
1.50%<br />
1.00%<br />
0.50%<br />
% Growth<br />
300,000<br />
2005 2006 2007 2008 2009 2010 2011 2012 2013 2014 2015<br />
0.00%<br />
Residential Customers<br />
% Growth<br />
5
<strong>TEP</strong> Commercial Customer Growth<br />
39,000<br />
2.50%<br />
Year End Commercial Customers<br />
38,000<br />
37,000<br />
36,000<br />
35,000<br />
34,000<br />
33,000<br />
32,000<br />
31,000<br />
2.00%<br />
1.50%<br />
1.00%<br />
0.50%<br />
% Growth<br />
30,000<br />
2005 2006 2007 2008 2009 2010 2011 2012 2013 2014 2015<br />
0.00%<br />
Commercial Customers<br />
% Growth<br />
6
<strong>TEP</strong> Reference Case Energy<br />
17,000<br />
15,000<br />
Baseline Annual Growth (no EE or DG)<br />
Averages ~2.4% 2012-2025<br />
<strong>TEP</strong> Retail GWh<br />
13,000<br />
11,000<br />
9,000<br />
7,000<br />
Reference Case Annual Growth (Including EE and DG)<br />
Averages ~0.8% 2012-2025<br />
5,000<br />
2030<br />
2029<br />
2028<br />
2027<br />
2026<br />
2025<br />
2024<br />
2023<br />
2022<br />
2021<br />
2020<br />
2019<br />
2018<br />
2017<br />
2016<br />
2015<br />
2014<br />
2013<br />
2012<br />
2011<br />
2010<br />
2009<br />
2008<br />
2007<br />
2006<br />
2005<br />
2004<br />
<strong>TEP</strong> Baseline Energy<br />
<strong>TEP</strong> Energy (Less Reference Case EE and DG)<br />
7
<strong>TEP</strong> Baseline Energy by Rate Class<br />
8,000<br />
7,000<br />
6,000<br />
<strong>TEP</strong> Retail GWh<br />
5,000<br />
4,000<br />
3,000<br />
2,000<br />
1,000<br />
0<br />
2030<br />
2029<br />
2028<br />
2027<br />
2026<br />
2025<br />
2024<br />
2023<br />
2022<br />
2021<br />
2020<br />
2019<br />
2018<br />
2017<br />
2016<br />
2015<br />
2014<br />
2013<br />
2012<br />
2011<br />
2010<br />
2009<br />
2008<br />
2007<br />
2006<br />
2005<br />
2004<br />
Residential Commercial Industrial Mining OPA<br />
8
<strong>TEP</strong> Reference Case Peak Demand<br />
4,000<br />
3,500<br />
Baseline Annual Growth (no EE or DG) Averages<br />
~2.2% 2012-2025<br />
<strong>TEP</strong> Retail Peak Demand (MW)<br />
3,000<br />
2,500<br />
2,000<br />
1,500<br />
1,000<br />
500<br />
Reference Case Annual Growth (Including EE and DG)<br />
Averages ~0.9% 2012-2025<br />
0<br />
2030<br />
2029<br />
2028<br />
2027<br />
2026<br />
2025<br />
2024<br />
2023<br />
2022<br />
2021<br />
2020<br />
2019<br />
2018<br />
2017<br />
2016<br />
2015<br />
2014<br />
2013<br />
2012<br />
2011<br />
2010<br />
2009<br />
2008<br />
2007<br />
2006<br />
2005<br />
2004<br />
<strong>TEP</strong> Baseline Peak Demand<br />
<strong>TEP</strong> Demand (Less Reference Case EE and DG)<br />
9
UNSE 2010 Sales by Rate Class<br />
Mining<br />
11%<br />
Industrial<br />
12%<br />
Residential<br />
44%<br />
Commercial<br />
33%<br />
10
UNSE Residential Customer Growth<br />
90,000<br />
6.00%<br />
Year End Residential Customers<br />
85,000<br />
80,000<br />
75,000<br />
70,000<br />
65,000<br />
60,000<br />
55,000<br />
5.00%<br />
4.00%<br />
3.00%<br />
2.00%<br />
1.00%<br />
0.00%<br />
% Growth<br />
50,000<br />
2005 2006 2007 2008 2009 2010 2011 2012 2013 2014 2015<br />
-1.00%<br />
Residential Customers<br />
% Growth<br />
11
UNSE Commercial Customer Growth<br />
12,000<br />
4.50%<br />
Year End Commercial Customers<br />
11,000<br />
10,000<br />
9,000<br />
8,000<br />
7,000<br />
4.00%<br />
3.50%<br />
3.00%<br />
2.50%<br />
2.00%<br />
1.50%<br />
1.00%<br />
0.50%<br />
0.00%<br />
% Growth<br />
6,000<br />
2005 2006 2007 2008 2009 2010 2011 2012 2013 2014 2015<br />
-0.50%<br />
Commercial Customers<br />
% Growth<br />
12
UNSE Reference Case Energy<br />
3,500<br />
3,000<br />
Baseline Annual Growth (no EE or DG)<br />
Averages ~2.5% 2012-2025<br />
UNSE Retail GWh<br />
2,500<br />
2,000<br />
1,500<br />
1,000<br />
Reference Case Annual Growth (Including EE and DG)<br />
Averages ~0.7% 2012-2025<br />
500<br />
2030<br />
2029<br />
2028<br />
2027<br />
2026<br />
2025<br />
2024<br />
2023<br />
2022<br />
2021<br />
2020<br />
2019<br />
2018<br />
2017<br />
2016<br />
2015<br />
2014<br />
2013<br />
2012<br />
2011<br />
2010<br />
2009<br />
2008<br />
2007<br />
2006<br />
2005<br />
2004<br />
UNSE Sales (Baseline)<br />
UNSE Energy (Less Reference Case EE and DG)<br />
13
UNSE Baseline Energy by Rate Class<br />
1,800<br />
1,600<br />
1,400<br />
UNSE Retail GWh<br />
1,200<br />
1,000<br />
800<br />
600<br />
400<br />
200<br />
0<br />
2030<br />
2029<br />
2028<br />
2027<br />
2026<br />
2025<br />
2024<br />
2023<br />
2022<br />
2021<br />
2020<br />
2019<br />
2018<br />
2017<br />
2016<br />
2015<br />
2014<br />
2013<br />
2012<br />
2011<br />
2010<br />
2009<br />
2008<br />
2007<br />
2006<br />
2005<br />
2004<br />
Residential Commercial Industrial Mining<br />
14
UNSE Reference Case Demand<br />
800<br />
700<br />
Baseline Annual Growth (no EE or DG)<br />
Averages ~2.5% 2012-2025<br />
UNSE Retail Peak Demand (MW)<br />
600<br />
500<br />
400<br />
300<br />
200<br />
100<br />
Reference Case Annual Growth (Including EE and DG)<br />
Averages ~1.1% 2012-2025<br />
0<br />
2030<br />
2029<br />
2028<br />
2027<br />
2026<br />
2025<br />
2024<br />
2023<br />
2022<br />
2021<br />
2020<br />
2019<br />
2018<br />
2017<br />
2016<br />
2015<br />
2014<br />
2013<br />
2012<br />
2011<br />
2010<br />
2009<br />
2008<br />
2007<br />
2006<br />
2005<br />
2004<br />
UNSE Demand (Baseline)<br />
UNSE Demand (Less Reference Case EE and DG)<br />
15
Risks to Forecast<br />
• As with all key IRP inputs, load growth assumptions are<br />
currently subject to a large (even unprecedented) amount of<br />
uncertainty<br />
• Key risks include (but are not limited to)<br />
– Economic growth<br />
– Energy efficiency impact<br />
– Structural changes to customer usage behavior<br />
– Emerging technologies (electric cars, etc.)<br />
16
Addressing Forecast Uncertainty<br />
• High degree of forecast risk requires examination of load<br />
growth conditions that differ from the reference case<br />
• In the IRP process, this will be done in two ways:<br />
– Scenario Analysis: Manually changing load assumptions to match a<br />
chosen set of conditions (e.g. higher or lower EE impact, slow<br />
economic growth, etc.)<br />
– Monte Carlo Simulation: Uses random draws to simulate a large<br />
number of load growth scenarios against which the performance of<br />
various candidate portfolios can be measured<br />
17
<strong>TEP</strong> and UES Resource Planning Workshop
Energy Efficiency and Demand Response<br />
UNS 2012 Resource Planning Workshop<br />
November 4 th , 2011<br />
Demand Side Resource Group
Agenda<br />
1. Overview and Trends: 20 minutes<br />
– Denise Smith, Director (Demand Side Resources)<br />
2. Your Home and Our Partnerships: 20 minutes<br />
– Dan Hogan, Supervisor (Residential Programs)<br />
3. Your Business: 20 minutes<br />
– Jeff Hunter, Supervisor (Commercial Programs)
The Cost of Energy<br />
Cents/ kWh<br />
SOURCE: Navigant Consulting, U.S. Levelized Cost of Electricity (cents per kWh, 2011 $)
States with EE Standards<br />
Source: ACEEE “EE Standards”
2009 Cost of Energy Savings, $/kWh, First Year<br />
$0.45<br />
$0.40<br />
$0.35<br />
$0.30<br />
$0.25<br />
$0.20<br />
$0.15<br />
$0.10<br />
$0.05<br />
$0.00<br />
Source: Navigant Benchmarking
2009 Energy Saving as a percent of Sales<br />
4.0%<br />
3.5%<br />
3.0%<br />
2.5%<br />
2.0%<br />
1.5%<br />
1.0%<br />
0.5%<br />
0.0%
Level of EERS Standards
2011 / 2012 Implementation Plan<br />
<strong>TEP</strong> Portfolio<br />
RESIDENTIAL<br />
BEHAVIORAL<br />
COMMERCIAL<br />
New<br />
Construction<br />
(GHP)<br />
Low In<strong>com</strong>e<br />
Weatherization<br />
Education &<br />
Outreach<br />
Home Energy<br />
Reports<br />
C&I<br />
Comprehensive<br />
Small<br />
Business<br />
Direct Install<br />
Shade Trees<br />
Existing Homes<br />
& Audit Direct<br />
Install<br />
Direct Load<br />
Control (Power<br />
Partners)<br />
Efficient<br />
Products (CFL)<br />
In-Home Energy<br />
Displays (Pilot)<br />
Direct<br />
Canvassing<br />
K-12 Energy<br />
Education<br />
Community CFL<br />
Prescriptive<br />
Custom<br />
Design<br />
Assistance<br />
Building<br />
Performance<br />
Rebates<br />
Multi-Family<br />
Appliance<br />
Recycling<br />
Community<br />
Education<br />
New<br />
Construction<br />
Retro-<br />
Commissioning<br />
Direct Load<br />
Control<br />
School<br />
Facilities<br />
Combined Heat<br />
and Power<br />
(CHP)<br />
Bid for<br />
Efficiency<br />
Pilot
Cumulative Savings (MWh)<br />
2,500,000 9<br />
2,000,000<br />
Direct Load Control<br />
1,500,000<br />
Pre-Rule Credit<br />
Residential Load<br />
1,000,000<br />
Commercial Load<br />
500,000<br />
0<br />
2011 2012 2013 2014 2015 2016 2017 2018 2019 2020
Energy Efficiency Cost Recovery<br />
Program Cost<br />
Performance<br />
Incentives<br />
Lost Revenue<br />
DSM Adjustor<br />
10
Benefits and Costs (2011 & 2012)<br />
Benefits = $185M<br />
Avoided Costs<br />
Resource Plan Model<br />
Costs = $83M<br />
•Fuel<br />
•Purchased Power<br />
•Capacity<br />
•Losses<br />
•Externalities<br />
11
New Construction/Energy-Star<br />
Access<br />
Panels<br />
Ceiling fixtures<br />
Chases<br />
Dropped<br />
Ceilings<br />
Sill Plates<br />
Window<br />
Openings<br />
Vents<br />
Door Openings<br />
Plumbing<br />
Penetrations<br />
Ducts
Existing Homes/Audit Direct Install<br />
Needs some work
Low In<strong>com</strong>e Weatherization<br />
Arizona Energy Office + U.S.<br />
Department of Energy + <strong>TEP</strong> <br />
Weatherization Assistance Program<br />
For homes at<br />
150% of Federal<br />
Poverty Line<br />
Conserves<br />
energy and<br />
lowers<br />
utility bills.<br />
Over 200<br />
homes<br />
weatherized<br />
each year!<br />
Includes duct repair, pressure<br />
management, attic insulation, and<br />
repair/replacement of non-functional or<br />
hazardous appliances.
Shade Trees<br />
64,000<br />
x
Efficient Products (CFL Buydown)
Home Energy Reports
Power Partners Project - DLC<br />
76 F<br />
80 F<br />
Direct Load Control
K-12 Energy Education<br />
First web-interactive tool for Tucson<br />
students to learn about solar and<br />
photovoltaic technology.
Community Energy Workshops<br />
Train-the-Community energy<br />
presentations at:<br />
• HOAs<br />
• Churches<br />
• Wards<br />
• At your place of business
Multi-Family
Appliance Recycling<br />
Get rid of this!
Your Agenda Business<br />
Lighting<br />
Mechanical<br />
Refrigeration<br />
Custom
Small Business YTD 2011<br />
Warehouse<br />
1%<br />
Process Industrial<br />
1%<br />
Hotel/Motel<br />
1%<br />
Fast-Food<br />
2%<br />
Other Industrial<br />
Gas Station<br />
2%<br />
1% Storage<br />
1%<br />
Medical<br />
8%<br />
Restaurant<br />
8%<br />
Grocery<br />
5%<br />
Manufacturing<br />
5%<br />
Miscellaneous<br />
1%<br />
Retail<br />
37%<br />
Office<br />
11%<br />
K-12 School<br />
18%<br />
Office<br />
K-12 School<br />
College/University<br />
Retail<br />
Gas Station<br />
Restaurant<br />
Fast-Food<br />
Hotel/Motel<br />
Medical<br />
Grocery<br />
Warehouse<br />
Process Industrial<br />
Other Industrial<br />
Storage<br />
Manufacturing<br />
Miscellaneous
Small Business YTD 2011<br />
• 5,227,995 annual kWh savings<br />
• $671,061 incentives paid<br />
• 192 locations<br />
• 72% of goals through September
Large Business Prescriptive YTD 2011<br />
Office<br />
K-12 School<br />
Miscellaneous<br />
16%<br />
Office<br />
19%<br />
College/University<br />
Retail<br />
Gas Station<br />
Restaurant<br />
Other Industrial<br />
13%<br />
K-12 School<br />
12%<br />
Fast-Food<br />
Hotel/Motel<br />
Medical<br />
Process<br />
Industrial<br />
7%<br />
College/University<br />
6%<br />
Grocery<br />
Warehouse<br />
Process Industrial<br />
Other Industrial<br />
Grocery<br />
1%<br />
Medical<br />
3% Hotel/Motel<br />
3%<br />
Restaurant<br />
3%<br />
Retail<br />
17%<br />
Storage<br />
Manufacturing<br />
Miscellaneous
Custom Projects YTD 2011<br />
Office<br />
Miscellaneous<br />
15%<br />
Office<br />
6% K-12<br />
School<br />
6%<br />
K-12 School<br />
College/University<br />
Retail<br />
Process<br />
Industrial<br />
3%<br />
Warehouse<br />
3%<br />
Other<br />
Industrial<br />
6%<br />
Grocery<br />
6%<br />
Retail<br />
33%<br />
Gas Station<br />
Restaurant<br />
Fast-Food<br />
Hotel/Motel<br />
Medical<br />
Grocery<br />
Warehouse<br />
Process Industrial<br />
Other Industrial<br />
Restaurant<br />
21%<br />
Storage<br />
Manufacturing<br />
Miscellaneous
Large Business YTD 2011<br />
• 16,810,257 annual kWh savings<br />
• $1,289,808 incentives paid<br />
• 264 different customers<br />
• 102% of goal through September
New Construction YTD 2011<br />
• 8 participants<br />
• $63,777 incentives paid out<br />
• 529,292 kWH in savings
Commercial Agenda Direct Load Control
Direct Load Control YTD 2011<br />
• 26 participants<br />
• 11.7 Mw – goal is 40 Mw<br />
• Across industries-schools, govt.,<br />
manufacturing; retail
New Commercial Programs<br />
• Schools Program<br />
• Retro-Commissioning<br />
• Bid for Efficiency<br />
• Combined Heat and Power
Renewable Resources<br />
David Jacobs<br />
Manager, Resource Planning and Procurement<br />
November 4, 2011
IRP and Renewable Resources<br />
• ACC Mandate: 15% of Retail Sales by 2025<br />
• Utility Scale (70% of Mandate)<br />
– Directly Connected to <strong>TEP</strong> Grid<br />
– Utility owned and/or PPA<br />
• Distributed Generation (DG)<br />
– Residential<br />
– Customer-sited PV, Water Heating, Wind<br />
– Non-residential<br />
– Customer-sited Commercial/Industrial<br />
– Wholesale DG connected to less than 69 kV lines<br />
2
Distributed Generation<br />
Residential Number of Systems Installed Cumulative<br />
25,000<br />
20,000<br />
15,000<br />
10,000<br />
PV Systems<br />
H20 Systems<br />
5,000<br />
-<br />
2012 2013 2014 2015 2016 2017 2018 2019 2020 2021 2022 2023 2024 2025<br />
3
Distributed Generation Programs<br />
PV & Water Heating<br />
– ~30 MW PV installed total 2011<br />
– 1000 Residential Systems per Year<br />
– Reducing incentives<br />
– Reducing installation costs<br />
– New business models<br />
– ~2,000 water heating systems installed<br />
2011 Compliance<br />
– Residential 104%<br />
– Commercial 118%<br />
– Total 111%<br />
4
IRP and Utility Scale Renewables<br />
• No longer “Least Cost” but “Reasonable Cost” plan<br />
• Resource plan balances desire for clean, renewable energy<br />
with the need to deliver low cost and reliable power<br />
• State and Federal Regulatory Considerations<br />
• Customer Desires<br />
– Customers Want Solar<br />
– Local Project Emphasis<br />
– Low Water Portfolio<br />
5
<strong>TEP</strong> Utility REST Compliance 2009<br />
700<br />
New Resources<br />
600<br />
REC Purchase<br />
Biodiesel<br />
500<br />
Solar<br />
LFG<br />
400<br />
Wind<br />
GWh<br />
300<br />
200<br />
100<br />
0<br />
2010 2011 2012 2013 2014 2015 2016 2017<br />
6
<strong>TEP</strong> Utility REST Compliance 2011<br />
1,400<br />
1,200<br />
Carryover Credits<br />
Short Term Purchase<br />
Solar<br />
Wind<br />
Biogas & Credits<br />
Utility Scale Target<br />
1,000<br />
800<br />
GWh<br />
600<br />
400<br />
200<br />
-<br />
2011 2013 2015 2017 2019 2021 2023 2025<br />
7
Wind Power<br />
• Mature technology<br />
• Short development time<br />
• Southern AZ has marginal to poor wind resource<br />
• Northern AZ has better potential<br />
• Transmission needed in most cases<br />
• Intermittent, “wrong time”<br />
8
Solar Photovoltaic (PV)<br />
• Several technologies<br />
– Fixed panels<br />
– Single axis tracker<br />
– Double axis tracker<br />
– Concentrating<br />
• Intermittent - significant variance with clouds<br />
• Comes up quickly – drops off just as quickly<br />
• Good AZ resource potential<br />
• Land requirements - good news/bad news<br />
• Maturing technology<br />
9
Solar Thermal<br />
• Several technologies<br />
– Parabolic trough<br />
– Power tower<br />
– Dish-Stirling Engine<br />
• High water consumption unless dry cooled<br />
• Thermal inertia dampens cloud effects, extends<br />
capacity later into the afternoon<br />
• Good AZ resource potential<br />
• Thermal Storage or Gas-Hybridization firms output<br />
10
Biomass/Biogas/Biodiesel<br />
• Biomass:<br />
– Diversity of solid fuels available, but limited<br />
– Relatively low cost resource<br />
– Direct fired, co-fired or gasified<br />
• Biogas – Landfill or Anaerobic Digestion<br />
– Relatively low landfill gas production due to dry climate, but widespread<br />
– Animal manure based projects are feasible<br />
• Biodiesel - Competes with transportation use<br />
• Base load and firm resources<br />
11
Geothermal<br />
• Mature technology<br />
• Base load and firm resource<br />
• Transmission needed in most cases<br />
• Minimal resource potential in AZ<br />
• High and uncertain exploration costs<br />
12
Renewable Resource Capacity Profile<br />
Typical Summer Load Profile versus Renewable Availability<br />
12<br />
Summer Load Profile<br />
System Peak<br />
2,500<br />
AZ Wind<br />
NM Wind<br />
10<br />
Solar PV<br />
Solar 1-Axis<br />
2,000<br />
Solar 2-Axis<br />
Renewable Resource, MW<br />
8<br />
6<br />
Solar CSP<br />
Solar CSP 6 Hour<br />
1,500<br />
1,000<br />
System Peak, MW<br />
4<br />
2<br />
500<br />
0<br />
1 2 3 4 5 6 7 8 9 10 11 12 13 14 15 16 17 18 19 20 21 22 23 24<br />
0<br />
Hours<br />
13
Renewable Resources<br />
2011 Levelized Cost of Delivered Electricity ($/MWh)<br />
Generation Delivery Backup Capacity<br />
$120<br />
$125<br />
$137<br />
$144<br />
$154<br />
$166<br />
$102<br />
$95<br />
$79 $81<br />
$111 $115<br />
$133<br />
$154<br />
Capacity Factor %<br />
System Peak %<br />
Water Usage<br />
Biomass NM Wind AZ Wind 1-axis PV PV Solar Thermal Solar Thermal<br />
- 6 hr.<br />
83% 38% 30% 24% 30% 38% 17%<br />
100% 9% 9% 51% 70% 87% 24%<br />
Low Low Low Low<br />
14
Renewable Resource Strategy Summary<br />
• First – Meet RES<br />
• Available, Proven Technologies<br />
• Small New Technologies (R&D)<br />
• Competitive, Viable, Cost-Effective Projects<br />
• Portfolio Balance, No Big Bets<br />
• Maximize Community Benefits<br />
• Environmental Benefits<br />
• Flexible Portfolio<br />
• Appropriately Sized, Scalable, Low Water<br />
15
Resource Mix and Assumptions<br />
Victor Aguirre – Resource Planning<br />
November 2011
IRP Assumptions/Process<br />
• Loads & Resources<br />
• Current Resource Mix<br />
• Market Assumptions<br />
• Expansion Options<br />
• Resource Mix 2027<br />
2
Loads and 2012 Resources<br />
3500<br />
Retail Including EE/DG<br />
Total Requirement (w/ Reserves)<br />
3000<br />
2500<br />
PPA<br />
2000<br />
Gas Resources<br />
MW<br />
1500<br />
Renewable Resources (net coincident peak<br />
contribution)<br />
1000<br />
Coal Resources<br />
500<br />
0<br />
2012 2013 2014 2015 2016 2017 2018 2019 2020 2021 2022 2023 2024 2025 2026 2027<br />
3
2012 Resource Mix<br />
Energy<br />
Capacity<br />
Coal<br />
85%<br />
Gas<br />
24%<br />
Renewables<br />
4%<br />
Renewables<br />
4%<br />
PPA<br />
5%<br />
Gas<br />
6%<br />
Coal<br />
54%<br />
PPA<br />
15%<br />
4
Forward Gas Market<br />
$12.00<br />
Permian Gas, $/mmBtu<br />
$10.00<br />
$8.00<br />
$/MMBtu<br />
$6.00<br />
$4.00<br />
$2.00<br />
$-<br />
2011 2013 2015 2017 2019 2021 2023 2025 2027<br />
5
Forward Energy Market<br />
$120.00<br />
Palo Verde Forward Market ($/MWh)<br />
$100.00<br />
$80.00<br />
$/MWh<br />
$60.00<br />
$40.00<br />
$20.00<br />
On-Peak. $/MWh<br />
Off-Peak. $/MWh<br />
$-<br />
2011 2013 2015 2017 2019 2021 2023 2025 2027<br />
6
IRP Expansion Options<br />
• Coal Resources<br />
– Required/Optional Upgrades<br />
• Gas Resources<br />
– Combined Cycle<br />
– Combustion Turbines<br />
• Renewable Resources<br />
– Solar<br />
– Wind<br />
• Other Resources<br />
7
Expansion Options – Coal Plants<br />
• Coal Emissions Upgrades<br />
‣ Four Corners - environmental upgrades prior to Aug. 2018<br />
‣ San Juan - environmental upgrades prior to 2016<br />
‣ Navajo<br />
- BART (Best Available Retrofit Technology) Ruling<br />
in 2012<br />
8
• Combined Cycle<br />
Expansion Options – Gas Plants<br />
‣ Efficiency ~ 7200 Btu/kWh Heat Rate<br />
‣ Intermediate ~ 40-60% Capacity Factor<br />
‣ Fuel Volatility - Market Gas (5 to 10 $/MMBtu)<br />
‣ Capital Costs ~ $1,100/kW<br />
‣ Carbon Emission - 119 lbs/MMBtu<br />
‣ Carbon Cost - 40% of Coal<br />
• Combustion Turbines<br />
‣ Efficiency ~ 9,000 – 10,500 Btu/kWh Heat Rate<br />
‣ Peaking<br />
~ 15% Capacity Factor<br />
‣ Fuel Volatility - Market Gas (5 to 9 $/MMBtu)<br />
‣ Capital Costs ~ $700 - $1,000/kW<br />
‣ Carbon Emission - 119 lbs/MMBtu<br />
‣ Carbon Cost - 60 % of Coal<br />
9
Expansion Options – Renewable Resources<br />
• Solar<br />
‣ On-Peak Production<br />
‣ Peaking<br />
‣ Fuel Volatility<br />
‣ Viability<br />
• Wind<br />
‣ Off-Peak Production<br />
‣ Intermediate<br />
‣ Fuel Volatility<br />
‣ Viability<br />
- 50% Peak Coincidence<br />
~ 25% Capacity Factor<br />
- Diurnal and intermittent<br />
- Abundant in AZ<br />
- 13% Peak Coincidence<br />
~ 35% Capacity Factor<br />
- Intermittent<br />
- Limited Sites/Wind in AZ<br />
10
Expansion Options – Other Resources<br />
• CAES (Compressed Air Energy Storage)<br />
‣ Charges from grid during off-peak hours<br />
‣ Discharges/generates during on-peak<br />
• Biomass<br />
‣ Fueled by biological material (wood, landfill gas, biodiesel etc.)<br />
‣ Scaled to fuel source (base load operated)<br />
• IGCC (Integrated Gasification Combined-Cycle)<br />
‣ Gasification of coal<br />
‣ With CCS (Carbon Capture and Storage)<br />
11
Loads and 2027 Resources <br />
3500<br />
Retail Including EE/DG<br />
Total Requirement (w/ Reserves)<br />
3000<br />
2500<br />
PPA<br />
2000<br />
Coal Uncertainty<br />
1500<br />
Gas Resources<br />
1000<br />
Renewable Resources (net coincident peak contribution)<br />
Coal Resources<br />
500<br />
0<br />
2012 2013 2014 2015 2016 2017 2018 2019 2020 2021 2022 2023 2024 2025 2026 2027<br />
12
2027 Resource Mix<br />
Energy<br />
Capacity<br />
Gas<br />
22%<br />
Coal<br />
52%<br />
Gas<br />
7%<br />
Renewables<br />
4%<br />
Renewables<br />
4%<br />
New Renewables<br />
5%<br />
New Resources<br />
8%<br />
Coal<br />
33%<br />
New Renewables<br />
10%<br />
New Resources<br />
13%<br />
Coal Uncertainty<br />
25%<br />
Coal Uncertainty<br />
16%<br />
13
Environmental Planning<br />
Jeffrey G. Yockey, PE<br />
Director, Corporate Environmental Services<br />
November 2011
Environmental Performance<br />
35,000<br />
UNS SO 2 Emissions<br />
(tons/year)<br />
30,000<br />
UNS NOx Emissions<br />
(tons/year)<br />
30,000<br />
25,000<br />
25,000<br />
20,000<br />
20,000<br />
15,000<br />
15,000<br />
10,000<br />
10,000<br />
5,000<br />
5,000<br />
-<br />
-<br />
2
Current and Future Environmental Regulations<br />
• Regional Haze Rule – Best Available Retrofit Technology (BART)<br />
– Improve visibility in national parks, monuments, etc.<br />
– Target pollutants are SO 2 , NOx, particulate matter (PM)<br />
– Could require selective catalytic reduction (SCR)<br />
• San Juan - $150M to $202M<br />
• Four Corners - $35M<br />
• Navajo - $42M<br />
• Utility MACT<br />
– Control emissions of Hazardous Air Pollutants (HAPs) from coal- and oilfired<br />
power plants<br />
– Mercury, non-mercury metals, organic <strong>com</strong>pounds, acid gases<br />
– Proposal issued March 2011; Final rule due December 2011<br />
– Primary impact at Springerville and Navajo; up to $49M<br />
3
Current and Future Environmental Regulations<br />
• Coal Combustion Residuals (CCR) “Coal Ash”<br />
– Requirements for disposal of CCR<br />
– EPA considering regulation as “hazardous waste” or “non-hazardous<br />
solid waste”<br />
– Proposal issued June 2010; final rule expected late 2012 or early 2013<br />
• National Ambient Air Quality Standards (NAAQSs)<br />
– Ozone – review scheduled for 2013<br />
– SO 2 and NOx – revised standards issued in 2010<br />
• Cooling water intake structures – “316(b) rule”<br />
– Intended to reduce fish mortality from impingement and entrainment<br />
– Proposal issued April 2011; final rule due July 2012<br />
– Primary exposure is at participant plants<br />
4
Significant Upgrades<br />
BART NOx Emission Reductions<br />
BART Capital Costs<br />
0.6<br />
$250<br />
Emission Rate (lbs/MMBtu)<br />
0.5<br />
0.4<br />
0.3<br />
0.2<br />
0.1<br />
0<br />
San Juan<br />
Four Corners<br />
($millions)<br />
$200<br />
$150<br />
$100<br />
$50<br />
$-<br />
$202<br />
$17<br />
$6 $35<br />
$2<br />
San Juan<br />
Four Corners<br />
Baseline Utility BART EPA BART State BART<br />
Utility BART EPA BART State BART<br />
5
CO 2 Cost Assumptions<br />
40<br />
35<br />
30<br />
$11M to $21M /year<br />
(2011 $/ton)<br />
25<br />
20<br />
15<br />
2009 Assumption<br />
10<br />
5<br />
2011 Assumption<br />
0<br />
6
Externalities<br />
• Arizona Corporation Commission (ACC) Decision 72028<br />
– Societal cost of SO 2 , NOx, PM, water<br />
– Energy Efficiency Implementation Plan<br />
– Open, stakeholder process<br />
• National Academy of Sciences Report<br />
– Transparent<br />
– External review<br />
– Familiar methodology<br />
– Data on individual power plants<br />
• 406 Individual Power Plants<br />
– Average of highest quartile: $107/MWh<br />
– Average of lowest quartile: $9/MWh<br />
– <strong>TEP</strong> System: $5-$6/MWh<br />
7
Water Use<br />
8,000,000<br />
Water Use in Arizona<br />
(acre-feet)<br />
<strong>TEP</strong> Water Use<br />
7,000,000<br />
6,000,000<br />
154,349<br />
25,640<br />
Effluent<br />
0%<br />
5,000,000<br />
4,000,000<br />
3,000,000<br />
6,660,011<br />
Well<br />
10,161 af<br />
40%<br />
2,000,000<br />
1,000,000<br />
Surface<br />
15,479 af<br />
60%<br />
-<br />
Rest of Arizona Other Arizona Power Plants <strong>TEP</strong><br />
8
Water Resource Planning<br />
1,200<br />
Water Use by Technology<br />
1,000<br />
(Gal/MWh)<br />
800<br />
600<br />
400<br />
200<br />
0<br />
Solar PV Wind NG<br />
Combustion<br />
Turbine<br />
NG Combined<br />
Cycle<br />
Pulverized<br />
Coal<br />
IGCC<br />
Concentrated<br />
Solar Power<br />
Nuclear<br />
9
Portfolio Strategy<br />
Mike Sheehan, Director Resource Planning<br />
November 2011
2012 Current Portfolios (Energy)<br />
2012<br />
<strong>TEP</strong> Generation<br />
Portfolio<br />
6.9%<br />
7.4%<br />
2.5%<br />
2012<br />
UniSource<br />
Portfolio<br />
2.5%<br />
19.8%<br />
2.5%<br />
4.0%<br />
83.2%<br />
6.5%<br />
71.2%<br />
2012<br />
UNSE Generation<br />
Portfolio<br />
19.8%2.5%<br />
6.5% 71.2%<br />
93.6%<br />
2<br />
Coal Generation Natural Gas Generation Purchase Power Utility Scale Renewables
Transmission & Renewable Portfolio<br />
Navajo<br />
Four Corners<br />
San Juan<br />
Mead<br />
Kingman<br />
Moenkopi<br />
McKinley<br />
Davis<br />
Griffith<br />
Peacock<br />
Cholla<br />
N. Havasu<br />
Yavapai<br />
Palo Verde<br />
Hassayampa<br />
Pinal West<br />
PHOENIX<br />
West Wing<br />
Pinal Central<br />
Springerville<br />
Greenlee<br />
Proposed<br />
Sunzia EHV<br />
Solar Projects<br />
Wind Projects<br />
Saguaro<br />
Tortolita<br />
South<br />
Tucson<br />
Sundt<br />
Vail<br />
Luna<br />
3
IRP Risk Factors<br />
Retail Demand, MW<br />
• Demand estimates (load growth,<br />
energy efficiency, etc.)<br />
• Natural gas and purchased power<br />
volatility<br />
• Carbon regulations<br />
Peak Demand<br />
4,500<br />
4,000<br />
3,500<br />
3,000<br />
2,500<br />
2,000<br />
2007 IRP Assumptions<br />
1,500<br />
1,000<br />
2011 IRP Assumptions<br />
500<br />
-<br />
2003 2006 2009 2012 2015 2018 2021 2024<br />
Forward Natural Gas Price<br />
$12.00<br />
$10.00<br />
• Renewable resource cost and<br />
system integration<br />
• Coal ownership risk<br />
$/mmBtu<br />
$8.00<br />
$6.00<br />
$4.00<br />
$2.00<br />
$-<br />
2009 Permain Gas, $/mmBtu<br />
2011 Permian Gas, $/mmBtu<br />
2009 2011 2013 2015 2017 2019<br />
$/Tonme<br />
60<br />
50<br />
40<br />
30<br />
20<br />
10<br />
0<br />
CO2 Emission Prices<br />
2009 IRP CO2, $Tonne<br />
2011 CO2, $/Tonne<br />
2011 2013 2015 2017 2019 2021 2023 2025 2027
Staying in Coal<br />
Issues Related to Coal Ownership<br />
• Significant capital investments related to environmental issues<br />
– Hazardous air pollutants (PM, mercury, SO2)<br />
– Regional Haze/Ozone – Best Available Retrofit Technology (NOx)<br />
– Water, Coal Combustion Residuals (Ash)<br />
– California entities inability to extend life of coal plants<br />
• End of term for a number land lease and fuel supply contracts<br />
Divesting Coal<br />
• Take or Pay Provisions in Coal Contracts<br />
• Effects on Navajo Nation (Jobs and Royalties)<br />
• Cost impact on Arizona water supply<br />
• <strong>TEP</strong> is a minority partner in all its joint owned units<br />
5
Potential Fate of Coal Capacity<br />
1800<br />
1600<br />
1400<br />
1200<br />
1000<br />
340<br />
168<br />
110<br />
600 MW<br />
Outside<br />
<strong>TEP</strong> Control<br />
Coal Capacity<br />
MW<br />
800<br />
600<br />
400<br />
120<br />
400<br />
200<br />
400<br />
0<br />
Four Corners<br />
Navajo<br />
San Juan<br />
Springerville Unit 1<br />
Sundt Unit 4<br />
Springerville Unit 2<br />
6
Quantifying Portfolio Risk<br />
• Part of the 2011 Integrated Resource Plan (“IRP”) process<br />
• Working with Pace Global to assist in a review of risks across a<br />
broad range of portfolios and variables<br />
• Provides an independent, third party review<br />
• The goal is to define low rate/low risk portfolios<br />
– What is the rate impact<br />
– What are the biggest risks<br />
7
Range of Portfolios (2025 Energy Mix)<br />
CC Peaker Coal<br />
Nuclear Wind Solar<br />
8
2012 IRP Portfolio Plan<br />
• Develop long term portfolio strategy for both <strong>TEP</strong> and UNSE<br />
based on the PACE analysis<br />
• Longer term plan to transition current portfolio towards low<br />
cost / low risk portfolio<br />
• Due to <strong>com</strong>plexities, address coal capacity on plant by plant<br />
basis<br />
• Look for near term opportunities to carry out longer term<br />
strategy<br />
9