download current issue - Ozean Publications
download current issue - Ozean Publications
download current issue - Ozean Publications

Create successful ePaper yourself
Turn your PDF publications into a flip-book with our unique Google optimized e-Paper software.
<strong>Ozean</strong> Journal of Applied Sciences 4(4), 2011<br />
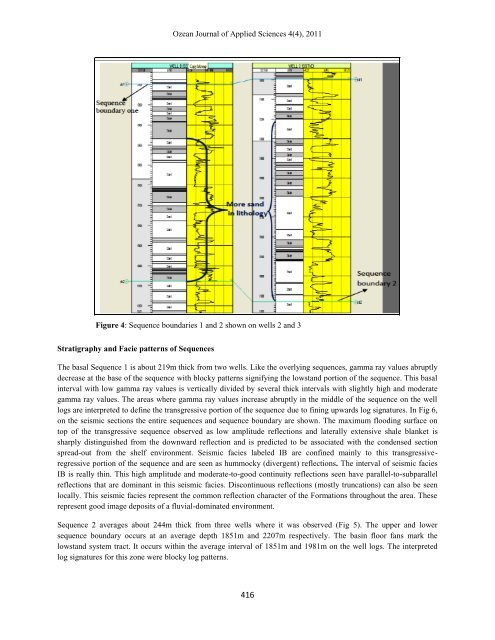
Figure 4: Sequence boundaries 1 and 2 shown on wells 2 and 3<br />
Stratigraphy and Facie patterns of Sequences<br />
The basal Sequence 1 is about 219m thick from two wells. Like the overlying sequences, gamma ray values abruptly<br />
decrease at the base of the sequence with blocky patterns signifying the lowstand portion of the sequence. This basal<br />
interval with low gamma ray values is vertically divided by several thick intervals with slightly high and moderate<br />
gamma ray values. The areas where gamma ray values increase abruptly in the middle of the sequence on the well<br />
logs are interpreted to define the transgressive portion of the sequence due to fining upwards log signatures. In Fig 6,<br />
on the seismic sections the entire sequences and sequence boundary are shown. The maximum flooding surface on<br />
top of the transgressive sequence observed as low amplitude reflections and laterally extensive shale blanket is<br />
sharply distinguished from the downward reflection and is predicted to be associated with the condensed section<br />
spread-out from the shelf environment. Seismic facies labeled IB are confined mainly to this transgressiveregressive<br />
portion of the sequence and are seen as hummocky (divergent) reflections. The interval of seismic facies<br />
IB is really thin. This high amplitude and moderate-to-good continuity reflections seen have parallel-to-subparallel<br />
reflections that are dominant in this seismic facies. Discontinuous reflections (mostly truncations) can also be seen<br />
locally. This seismic facies represent the common reflection character of the Formations throughout the area. These<br />
represent good image deposits of a fluvial-dominated environment.<br />
Sequence 2 averages about 244m thick from three wells where it was observed (Fig 5). The upper and lower<br />
sequence boundary occurs at an average depth 1851m and 2207m respectively. The basin floor fans mark the<br />
lowstand system tract. It occurs within the average interval of 1851m and 1981m on the well logs. The interpreted<br />
log signatures for this zone were blocky log patterns.<br />
416