Canterbury Economic Indicators - Canterbury Earthquake Recovery ...
Canterbury Economic Indicators - Canterbury Earthquake Recovery ...
Canterbury Economic Indicators - Canterbury Earthquake Recovery ...

Create successful ePaper yourself
Turn your PDF publications into a flip-book with our unique Google optimized e-Paper software.
Spending and prices<br />
Analysis<br />
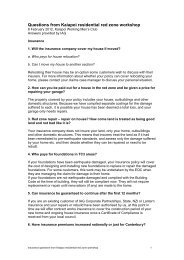
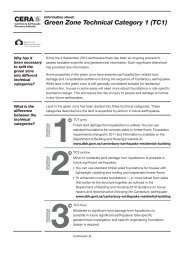
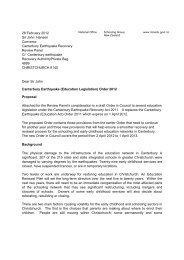
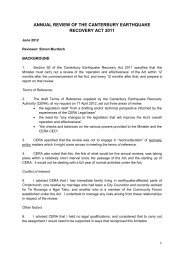
Construction prices are rising (figure 46) as are costs of purchasing a house (figure 47). An important<br />
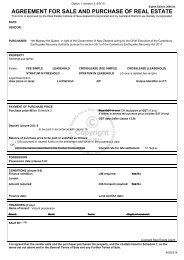
reason for this trend is that <strong>Canterbury</strong> firms are under pressure to meet the demand (figures 48 and<br />
49).<br />
Figures<br />
46. Construction prices<br />
(net percentage of building firms that reported they raised prices in the past three months)<br />
100<br />
50<br />
0<br />
-50<br />
<strong>Canterbury</strong><br />
Rest of New Zealand<br />
-100<br />
Interpretation notes: negative values represent the net percentage of firms that reduced prices. Respondents were asked to<br />
exclude seasonal variations.<br />
1400<br />
47. Consumer price index – purchase of housing<br />
(June 2006 quarter = base of 1000, measured quarterly)<br />
Source: NZIER (most recent data point: December 2012)<br />
1300<br />
1200<br />
1100<br />
<strong>Canterbury</strong><br />
New Zealand<br />
1000<br />
Source: Statistics New Zealand (most recent data point: September 2012)<br />
48. Capacity as a constraint<br />
(percentage of firms that reported capacity was the single factor most limiting their ability to increase production or activity,<br />
measured quarterly)<br />
24%<br />
20%<br />
16%<br />
12%<br />
8%<br />
4%<br />
0%<br />
<strong>Canterbury</strong><br />
Rest of New Zealand<br />
Source: NZIER (most recent data point: December 2012)<br />
22