Canterbury Economic Indicators - Canterbury Earthquake Recovery ...
Canterbury Economic Indicators - Canterbury Earthquake Recovery ...
Canterbury Economic Indicators - Canterbury Earthquake Recovery ...

Create successful ePaper yourself
Turn your PDF publications into a flip-book with our unique Google optimized e-Paper software.
<strong>Canterbury</strong><br />
<strong>Economic</strong><br />
<strong>Indicators</strong><br />
February 2013<br />
1
CANTERBURY ECONOMIC INDICATORS<br />
February 2013<br />
Executive summary<br />
The <strong>Canterbury</strong> economy is bustling with activity and growing rapidly. ANZ estimates that the region<br />
grew by 7.5% in the 12 months to December 2012, the fastest rate of any region in the country. This<br />
growth is built on a strong agricultural sector that is driving record trading volumes through the port. It<br />
is also led by the construction sector. In total $4 billion of building consents have been issued in<br />
<strong>Canterbury</strong> since September 2010. The monthly average value is $144 million, which represents a<br />
20% increase on the average monthly value of building consents when compared with the 12 months<br />
to September 2010.<br />
Nonetheless, challenges remain. The emerging shortage of skilled and unskilled labour as well as<br />
pressures in the housing market have the potential to slow the pace of recovery.<br />
Contents<br />
Output and trading activity .................................................................................................................. 3<br />
Output .................................................................................................................................................. 3<br />
Consumer spending ............................................................................................................................ 5<br />
International trade ............................................................................................................................... 6<br />
Key sectors ............................................................................................................................................ 7<br />
Agriculture ........................................................................................................................................... 8<br />
Manufacturing ..................................................................................................................................... 9<br />
Services............................................................................................................................................. 10<br />
Tourism ............................................................................................................................................. 11<br />
Central Christchurch ......................................................................................................................... 13<br />
Rebuilding and confidence ................................................................................................................ 15<br />
Investment and innovation ................................................................................................................ 15<br />
Construction ...................................................................................................................................... 16<br />
Housing ............................................................................................................................................. 18<br />
Insurance........................................................................................................................................... 20<br />
Spending and prices ......................................................................................................................... 22<br />
Business environment ....................................................................................................................... 23<br />
Population and labour market ........................................................................................................... 24<br />
Population ......................................................................................................................................... 24<br />
Employment ...................................................................................................................................... 26<br />
Glossary ............................................................................................................................................... 28<br />
Table of figures ................................................................................................................................... 30<br />
CERA Disclaimer: CERA has made every effort to ensure that the information contained in this report is reliable but makes no guarantee of its accuracy or completeness<br />
and CERA does not accept any liability for any errors. The information contained in this report is not intended to be used as a basis for commercial decisions and CERA<br />
accepts no liability for any decisions made in reliance on them. CERA may change, add to, delete from, or otherwise amend the contents of this report at any time without<br />
notice.<br />
Tax Information Disclaimer: Certain information originates from tax data supplied by Inland Revenue to CERA under the Tax Administration Act 1994. The tax data is<br />
reliant on pro-active taxpayer disclosure to Inland Revenue, hence the data may not represent the complete picture. The material provided by Inland Revenue in this<br />
report may be reproduced and published without further licence, provided the source is acknowledged, the materials are reproduced accurately and the above disclaimer<br />
statement is included.<br />
2
Output<br />
Output and trading activity<br />
Analysis<br />
Electricity consumption in Christchurch remains below pre-earthquake levels (figure 6) yet growth in<br />
total economic activity is outstripping the rest of the country (figure 2). The outlook is positive as well.<br />
After a dip in September 2012, the net percentage of firms that reported an increase in trading activity<br />
in <strong>Canterbury</strong> rose strongly in the December quarter (figure 3). The net percentage of firms that<br />
consider the general business situation will improve is higher in <strong>Canterbury</strong> than in the rest of New<br />
Zealand (figure 4).<br />
Figures<br />
110<br />
105<br />
100<br />
1. Estimate of real gross regional domestic product<br />
(Indexed where average 2007 = 100 and in 1995/96 prices, measured quarterly)<br />
95<br />
90<br />
85<br />
<strong>Canterbury</strong><br />
Rest of New Zealand<br />
80<br />
2. Estimate of changes in economic activity<br />
(annual average percentage change in real terms, measured quarterly)<br />
Source: Infometrics (most recent data point: September 2012)<br />
8%<br />
6%<br />
4%<br />
2%<br />
0%<br />
-2%<br />
-4%<br />
-6%<br />
<strong>Canterbury</strong>*<br />
<strong>Canterbury</strong>^<br />
Rest of New Zealand*<br />
Source: * refers to data provided by Infometrics, ^ refers to data provided by ANZ (most recent data point: September 2012)<br />
3. Domestic trading activity<br />
(net percentage of firms that reported trading activity went up in the last three months)<br />
30%<br />
15%<br />
0%<br />
-15%<br />
-30%<br />
-45%<br />
-60%<br />
<strong>Canterbury</strong><br />
Rest of New Zealand<br />
Interpretation notes: a negative percentage shows that a net percentage of firms reported trading activity went down in the<br />
last three months.<br />
3<br />
Source: NZIER (most recent data point: December 2012)
4. Views of general business situation<br />
(net percentage of firms that consider the general business situation in New Zealand is likely to improve)<br />
Deteriorate Improve<br />
60%<br />
40%<br />
20%<br />
0%<br />
-20%<br />
-40%<br />
-60%<br />
-80%<br />
<strong>Canterbury</strong><br />
Rest of New Zealand<br />
Interpretation notes: negative values show that a net percentage of firms consider the general business situation is likely to<br />
deteriorate.<br />
20%<br />
15%<br />
10%<br />
5. Traffic volumes in <strong>Canterbury</strong><br />
(annual percentage change of NZIER traffic volumes index, measured monthly)<br />
Source: NZIER (most recent data point: December 2012)<br />
5%<br />
0%<br />
-5%<br />
-10%<br />
All<br />
Heavy<br />
Source: NZIER, New Zealand Transport Agency (most recent data point: November 2012)<br />
6. Electricity consumption index<br />
(index of seasonally adjusted electricity consumption where average 2007 = 100, measured quarterly)<br />
110<br />
105<br />
100<br />
95<br />
90<br />
Christchurch<br />
Auckland<br />
Wellington<br />
85<br />
Source: Infometrics and Electricity Authority (most recent data point: September 2012)<br />
4
Consumer spending<br />
Analysis<br />
Consumer spending continues to lift. Electronic card transactions through the Paymark network have<br />
grown steadily since August 2011 in line with national averages (figure 8). Spending on<br />
accommodation and food services remains slightly below pre-earthquake levels but is beginning to<br />
rise, while spending on retail trade is above pre-earthquake levels (figure 7). Consumer confidence in<br />
<strong>Canterbury</strong> remains high (figure 9).<br />
Figures<br />
120<br />
115<br />
110<br />
105<br />
100<br />
95<br />
90<br />
85<br />
7. Spending on Christchurch retail trade and services<br />
(indexed where average 2007 = 100 and seasonally adjusted, measured quarterly)<br />
Retail trade<br />
Accommodation and food<br />
services<br />
Source: Statistics New Zealand (most recent data point: September 2012)<br />
8. Electronic card transactions on the Paymark network<br />
(volumes of transactions, seasonally adjusted and indexed where average 2007 = 100, measured monthly)<br />
130<br />
125<br />
120<br />
115<br />
110<br />
105<br />
100<br />
95<br />
90<br />
Wider Christchurch<br />
Rest of New Zealand<br />
Interpretation notes: Paymark processes about 75% of all electronic transactions in New Zealand. The definition of wider<br />
Christchurch is slightly different from greater Christchurch. Refer to the Glossary.<br />
130<br />
120<br />
9. Consumer confidence<br />
Source: Paymark, NZIER (most recent data point: November 2012)<br />
110<br />
100<br />
90<br />
<strong>Canterbury</strong><br />
Auckland<br />
Wellington<br />
80<br />
Interpretation notes: scores above 100 show more optimism than pessimism while scores below 100 show the opposite.<br />
Source: Westpac: McDermott Miller (most recent data point: December 2012)<br />
5
International trade<br />
Analysis<br />
Trading volumes have rebounded from a slight dip in September 2012 and have continued to grow<br />
steadily since the earthquakes (figure 10). The total value of exports of merchandise trade going<br />
through Port of Lyttelton during 2012 was 24% higher than in 2010. Note, however, that some of this<br />
rise will be due to changes in the relative value of commodities.<br />
Figure<br />
10. Combined exports and imports index<br />
(index of three-month rolling averages of free on board values for merchandise trade of imports and exports where average<br />
2007 = 100, measured monthly)<br />
250<br />
200<br />
150<br />
100<br />
Lyttelton<br />
RoNZ seaports<br />
Christchurch airport<br />
RoNZ airports<br />
50<br />
0<br />
Interpretation notes: the exports included in this figure include re-exports. Note that planes flown into Christchurch<br />
International Airport from overseas for repairs are counted as imports and exports. This is likely to be a significant reason<br />
behind the spikes in September 2008 and March - September 2009. RoNZ = Rest of New Zealand<br />
Source: Statistics New Zealand and CERA (most recent data point: December 2012)<br />
6
Key sectors<br />
Figure<br />
11. Employee count by industry in <strong>Canterbury</strong><br />
(percentage of the total workforce)<br />
Manufacturing<br />
Health Care and Social Assistance<br />
Retail Trade<br />
Education and Training<br />
Construction<br />
Professional, Scientific and Technical Services<br />
Accommodation and Food Services<br />
Agriculture, Forestry and Fishing<br />
Wholesale Trade<br />
Administrative and Support Services<br />
Transport, Postal and Warehousing<br />
2007<br />
2008<br />
2009<br />
2010<br />
2011<br />
2012<br />
Public Administration and Safety<br />
Other Services<br />
Financial and Insurance Services<br />
Arts and Recreation Services<br />
Rental, Hiring and Real Estate Services<br />
Information Media and Telecommunications<br />
Electricity, Gas, Water and Waste Services<br />
Mining<br />
0% 3% 6% 9% 12% 15%<br />
Source: Statistics New Zealand and CERA (most recent data point: February 2012)<br />
7
Agriculture<br />
Analysis<br />
The agricultural sector remains strong. Production grew at the national average (figure 12) while the<br />
percentage of export-grade livestock slaughtered grew above the national average rate. (figure 13).<br />
Figures<br />
12. Agriculture, forestry and fishing production<br />
(indexed where average 2007 = 100, measured quarterly)<br />
180<br />
160<br />
140<br />
120<br />
100<br />
80<br />
60<br />
40<br />
20<br />
0<br />
<strong>Canterbury</strong><br />
Rest of New Zealand<br />
10%<br />
Source: Infometrics and CERA (most recent data point: September 2012)<br />
13. Slaughter of livestock graded for export, excluding game<br />
(annual average percentage change of livestock weight, measured monthly)<br />
5%<br />
0%<br />
-5%<br />
<strong>Canterbury</strong><br />
Rest of New Zealand<br />
-10%<br />
-15%<br />
Source: Statistics New Zealand and CERA (most recent data point: December 2012)<br />
8
Manufacturing<br />
Analysis<br />
Business New Zealand’s indicator suggests that the <strong>Canterbury</strong> manufacturing sector is expanding<br />
(figure 14). In contrast, the number of employees in the sector has declined over the last five years at<br />
a steady rate, consistent with national trends (figure 15). For the manufacturing and building sectors<br />
combined, the latest NZIER Quarterly Survey of Business Opinion shows trading activity continues to<br />
grow in the post-earthquake period.<br />
Figures<br />
14. Manufacturing index<br />
(three-month rolling averages, measured monthly)<br />
contracting expanding<br />
70<br />
60<br />
50<br />
40<br />
30<br />
<strong>Canterbury</strong><br />
New Zealand<br />
15. Manufacturing sector employees<br />
(indexed where average 2007 = 100, measured annually)<br />
Source: Business New Zealand (most recent data point: December 2012)<br />
120<br />
100<br />
80<br />
60<br />
40<br />
<strong>Canterbury</strong><br />
Rest of New Zealand<br />
20<br />
0<br />
2007 2008 2009 2010 2011 2012<br />
Source: Statistics New Zealand and CERA (most recent data point: February 2012)<br />
16. Domestic trading activity for manufacturers and builders<br />
(net percentage of firms that reported their trading activity went up in the last three months, measured quarterly)<br />
40<br />
20<br />
0<br />
-20<br />
-40<br />
<strong>Canterbury</strong><br />
Rest of New Zealand<br />
-60<br />
Source: NZIER (most recent data point: December 2012)<br />
9
Services<br />
Analysis<br />
According to Business New Zealand data, the expansion in the <strong>Canterbury</strong>/Westland services<br />
industry has slowed recently, in contrast to national trends (figure 17). The number of international<br />
education visas issued remains well below pre-earthquake levels and the number in the rest of New<br />
Zealand (figure 18).<br />
Figures<br />
17. Services expanding and contracting index<br />
(three-month rolling averages, measured monthly)<br />
contracting expanding<br />
70<br />
60<br />
50<br />
40<br />
30<br />
<strong>Canterbury</strong>/Westland<br />
New Zealand<br />
18. International education visas issued<br />
(indexed where average 2007 = 100)<br />
Source: Business New Zealand (most recent data point: December 2012)<br />
150<br />
125<br />
100<br />
75<br />
50<br />
25<br />
0<br />
<strong>Canterbury</strong><br />
Rest of New Zealand<br />
Source: Immigration New Zealand (most recent data point: January 2013)<br />
10
Tourism<br />
Analysis<br />
Immediately after the February 2011 earthquake, the number of international guest nights fell sharply<br />
but this trend has now halted (figure 19). International passenger movements (figure 21) and<br />
domestic guest nights (figure 20) which also fell since the earthquakes though to a lesser extent, are<br />
showing signs of recovery too. In addition, more hotel rooms are coming back into operation (figure<br />
23).<br />
Figures<br />
19. International guest nights<br />
(indexed where average 2007 = 100, measured quarterly in 2006-2007 and monthly from 2008 onwards)<br />
160<br />
140<br />
120<br />
100<br />
80<br />
60<br />
40<br />
20<br />
0<br />
greater Christchurch<br />
Rest of New Zealand<br />
Source: Statistics New Zealand and CERA (most recent data point: November 2012)<br />
Interpretation notes: a guest night means one guest spending one night at an establishment. For example, a motel with 15<br />
guests spending two nights would report 30 guest nights.<br />
180<br />
160<br />
140<br />
20. Domestic guest nights<br />
(indexed where average 2007 = 100, measured quarterly in 2006 - 2007 and monthly from 2008 onwards)<br />
120<br />
100<br />
80<br />
greater Christchurch<br />
Rest of New Zealand<br />
60<br />
40<br />
Source: Statistics New Zealand and CERA (most recent data point: November 2012)<br />
Interpretation notes: a guest night means one guest spending one night at an establishment. For example, a motel with 15<br />
guests spending two nights would report 30 guest nights.<br />
11
21. International passenger movements<br />
(indexed where average 2007 = 100, measured monthly)<br />
140<br />
120<br />
100<br />
80<br />
Christchurch Airport<br />
Rest of New Zealand airports<br />
60<br />
140,000<br />
120,000<br />
100,000<br />
80,000<br />
60,000<br />
40,000<br />
20,000<br />
0<br />
Source: Statistics New Zealand and CERA (most recent data point: December 2012)<br />
22. Capacity of accommodation establishments in Christchurch City<br />
(stay unit nights, measured monthly)<br />
Hotels<br />
Motels<br />
Backpackers<br />
Holiday Parks<br />
Interpretation notes: a stay unit is a unit of accommodation that is available to be charged out to guests (such as a room in a<br />
hotel or motel, a bed in a backpacker establishment, or a site in a caravan park). Capacity is defined as one stay unit multiplied<br />
by one night. For example, 10 units in a motel available for guest use (whether occupied or not) for the full 31 days in July<br />
would have an accommodation capacity of 310 stay unit nights.<br />
23. Forecast hotel capacity<br />
(rooms, measured annually)<br />
Source: Statistics New Zealand, (most recent data point: November 2012)<br />
4,500<br />
4,000<br />
3,500<br />
3,000<br />
2,500<br />
2,000<br />
1,500<br />
1,000<br />
500<br />
0<br />
Pre-earthquake Current December 2013<br />
(forecast)<br />
December 2014<br />
(forecast)<br />
December 2015<br />
(forecast)<br />
December 2016<br />
(forecast)<br />
Source: Christchurch and <strong>Canterbury</strong> Tourism (most recent update: February 2013)<br />
12
24. Status of major tourist attractions in greater Christchurch<br />
Central Christchurch<br />
Major attractions<br />
Air Force Museum<br />
Antarctic Centre<br />
Arts Centre<br />
Art Gallery<br />
<strong>Canterbury</strong> Museum<br />
ChristChurch Cathedral<br />
<strong>Earthquake</strong> City (New)<br />
Ferrymead Historic Park<br />
Gondola<br />
Orana Park<br />
Punts<br />
Science Alive<br />
Tramway<br />
TransAlpine Railway<br />
Willowbank<br />
Status<br />
Open<br />
Open<br />
Closed<br />
Closed<br />
Partially open<br />
Closed<br />
Open<br />
Open<br />
Closed<br />
Open<br />
Open<br />
Closed<br />
Closed<br />
Open<br />
Open<br />
Source: CERA (most recent update: February 2013)<br />
Analysis<br />
Progress in the CBD and rebuild zone is good. As at 15 February 2013, the owners of 47 commercial<br />
CBD properties had agreed to sell their properties to the Crown. In addition, the number of building<br />
consents is rising rapidly (figure 25) and the list of employers returning to the CBD continues to grow<br />
(figure 26).<br />
Figures<br />
25. Building consents within the CBD area<br />
(millions, measured monthly)<br />
$35<br />
$30<br />
$25<br />
$20<br />
$15<br />
$10<br />
$5<br />
$0<br />
Source: Statistiics New Zealand and CERA (most recent data point: September 2012)<br />
13
26. Employers returning to the Christchurch City downtown area<br />
Employers that have already returned<br />
Alice in Videoland, ANZ, ASB Bank, Ballantynes, Barkers,<br />
BNZ, Briscoes Homeware, C4 Coffee, Cassels & Sons<br />
Brewery Bar / CBD Bar, <strong>Canterbury</strong> Development<br />
Corporation, CERA, Christchurch City Council, Cosmic<br />
Corner, Crafted Coffee Company, Haines Attract, Hapa, Head<br />
Over Heels, Hot Damn!, Hummingbird, Hunters and<br />
Collectors, Ibis Hotel, Infinite Definite, Johnson’s Grocery,<br />
Kathmandu, Kiwibank and NZ Post, Kooky, Lane Neave,<br />
Mimco, Minnie Cooper, New City Hotel, Nicholas Jermyn,<br />
Plush, Recover <strong>Canterbury</strong>, Ruby, Scorpio Books, Storm, The<br />
Building Intelligence Group, The General Store, The Press,<br />
Toi Toi, Trelise Cooper, Westpac, Zoo Creative Design &<br />
Advertising<br />
Employers that have given at least a verbal commitment<br />
to the <strong>Canterbury</strong> Employers’ Chamber of Commerce that<br />
they will return<br />
Aecom, Anderson Lloyd, Arrow, <strong>Canterbury</strong> Employers’<br />
Chamber of Commerce, Christchurch and <strong>Canterbury</strong><br />
Tourism, Craigs Investment Partners, Desktop Imaging<br />
Limited, Duncan Cotterill, Hairy Lemon & the I.T. Team,<br />
Hargreaves and Felton Ltd, Innovative Travel, Interflora<br />
Pacific Unit Limited, The Lanolin Trading Company, Leighs<br />
Construction, Immigration NZ, SBS Bank, The Court Theatre,<br />
Winnie Bagoes, Wynn Williams<br />
Note: this is an indicative list only of the employers of which the <strong>Canterbury</strong> Employers’ Chamber of Commerce is<br />
aware. If you would like your business to be included in this list, please contact Anne McKee at annem@cecc.org.nz.<br />
Please also note that this list is based on a verbal commitment only and any use of this information would need to be<br />
on this understanding.<br />
Source: <strong>Canterbury</strong> Employers’ Chamber of Commerce (last updated: February 2013)<br />
27. Estimated number of restaurants and cafes since the February 2011 earthquake<br />
Restaurants and cafes within the four avenues<br />
Closed 343<br />
Reopened 55<br />
New premises established 11<br />
Source: Christchurch City Council (updated: February 2013)<br />
14
Rebuilding and confidence<br />
Investment and innovation<br />
Analysis<br />
Attitudes to investment in <strong>Canterbury</strong> continue to be very positive. The percentage of firms that<br />
intend to invest in new buildings (figure 28), plant and machinery (figure 29) is well above national<br />
trends as is the investment confidence of commercial property investors (figure 30).<br />
Figures<br />
28. Investment intentions – buildings<br />
(net percentage of firms that expect more new investment approvals over the next 12 months compared with the last)<br />
40<br />
20<br />
0<br />
-20<br />
-40<br />
-60<br />
<strong>Canterbury</strong><br />
Rest of New Zealand<br />
-80<br />
Source: NZIER (most recent data point: December 2012)<br />
29. Investment intentions – plant and machinery<br />
(net percentage of firms that expect more new investment approvals over the next 12 months compared with the last)<br />
40<br />
20<br />
0<br />
-20<br />
-40<br />
-60<br />
-80<br />
<strong>Canterbury</strong><br />
Rest of New Zealand<br />
Source: NZIER (most recent data point: December 2012)<br />
30. Confidence of commercial property investors in New Zealand<br />
(net percentage of respondents who are optimistic about the relevant commercial market)<br />
60%<br />
40%<br />
20%<br />
0%<br />
-20%<br />
-40%<br />
-60%<br />
Christchurch<br />
Wellington<br />
Auckland<br />
New Zealand overall<br />
Source: Colliers International (most recent data point: September 2012)<br />
15
31. Confidence of commercial property investors in Christchurch<br />
(percentage of respondents who are optimistic about their commercial market)<br />
80%<br />
60%<br />
40%<br />
20%<br />
0%<br />
-20%<br />
-40%<br />
-60%<br />
-80%<br />
Overall<br />
Office<br />
Industrial<br />
Retail<br />
Source: Colliers International (most recent data point: September 2012)<br />
Construction<br />
Analysis<br />
Building consents (figure 32), building activity (figure 33) and ready-mixed concrete production<br />
(figure 34) continue to accelerate in <strong>Canterbury</strong> at levels well above the rest of the country. By the<br />
end of 2012, $4 billion of building consents had been issued in <strong>Canterbury</strong> since September 2010.<br />
The monthly average value was $144 million, which represents a 22% increase in the average<br />
monthly value of building consents when compared with the 12 months prior to September 2010.<br />
SCIRT also continues to progress its work: 60% of the wastewater network and 75% of the<br />
stormwater network have been assessed (figure 35).<br />
Figures<br />
32. CERA's Index of Building Consents<br />
(three-month rolling averages of residential and non-residential building consents for new buildings and alterations, indexed<br />
where average 2007 = 100, measured monthly)<br />
200<br />
180<br />
160<br />
140<br />
120<br />
100<br />
80<br />
60<br />
40<br />
20<br />
Christchurch<br />
Selwyn<br />
Waimakariri<br />
Rest of New Zealand<br />
Interpretation notes: the index measures consents for new buildings by value and floor area, and measures the consents for<br />
alterations by value and number. CERA will provide data and calculations on request.<br />
Source: CERA (most recent data point: December 2012)<br />
16
33. Building activity<br />
(indexed where average 2007 = 100, measured quarterly)<br />
140<br />
120<br />
100<br />
80<br />
60<br />
40<br />
20<br />
0<br />
<strong>Canterbury</strong><br />
Wellington<br />
Northland and Central Auckland<br />
Source: Source: Value of Work Put in Place series, Statistics New Zealand (most recent data point: September 2012)<br />
34. Ready-mixed concrete production<br />
(indexed where average 2007 = 100, measured quarterly)<br />
140<br />
120<br />
100<br />
80<br />
60<br />
40<br />
20<br />
0<br />
<strong>Canterbury</strong><br />
Rest of New Zealand<br />
Interpretation notes: data for the September and December 2009 quarters are missing for <strong>Canterbury</strong>.<br />
35. SCIRT progress statistics<br />
Source: Statistics New Zealand (most recent data point: December 2012)<br />
Infrastructure rebuild<br />
• 965km of the 1,600km (60%) wastewater network<br />
needing assessment (over 100mm diameter) completed<br />
using CCTV and multi-criteria assessment<br />
• 815km of 1,080km (75%) of stormwater network<br />
needing assessment (over 100mm diameter) completed<br />
using CCTV and multi-criteria assessment<br />
• 98 projects totalling $292.4 million under construction<br />
In the pipeline<br />
• 50 projects totalling $243.8 million being estimated<br />
• 180 projects totalling $1,247.1 million being designed<br />
Source: http://strongerchristchurch.govt.nz/resources/statistics (last viewed 6 February 2013)<br />
17
Housing<br />
Analysis<br />
House prices in <strong>Canterbury</strong> continue to rise, as do house prices in the rest of the country (figure 37).<br />
House sales are still below 2007 levels, but are well above pre-earthquake levels (figure 38). In<br />
December 2012 it took an average of 33 days to sell a house in <strong>Canterbury</strong>, compared with 36 days<br />
in the rest of the country (figure 39). Rental prices are also rising (figure 42). The housing market is<br />
being closely monitored by the Ministry of Business, Innovation and Employment.<br />
Figures<br />
36. Building activity of residential buildings<br />
($1,000s, measured quarterly)<br />
400,000<br />
300,000<br />
200,000<br />
100,000<br />
0<br />
Source: Statistics New Zealand Value of Work Put in Place Series (most recent data point: June 2012)<br />
37. House prices<br />
(average sales prices seasonally adjusted, measured monthly)<br />
$450,000<br />
$400,000<br />
$350,000<br />
$300,000<br />
<strong>Canterbury</strong><br />
Rest of New Zealand<br />
$250,000<br />
Source: Real Estate Institute of New Zealand and NZIER (most recent data point: December 2012)<br />
38. House sales<br />
(indexed where average 2007=100 and seasonally adjusted, measured monthly)<br />
130<br />
110<br />
90<br />
70<br />
50<br />
<strong>Canterbury</strong><br />
Rest of New Zealand<br />
30<br />
Source: Real Estate Institute of New Zealand and NZIER (most recent data point: December 2012)<br />
18
39. Days to sell a house<br />
(seasonally adjusted, measured monthly)<br />
60<br />
55<br />
50<br />
45<br />
40<br />
35<br />
30<br />
25<br />
20<br />
<strong>Canterbury</strong><br />
Rest of New Zealand<br />
Source: Real Estate Institute of New Zealand and NZIER (most recent data point: December 2012)<br />
40. Supply of properties on the market<br />
(measured in average month supply of properties, seasonally adjusted, measured monthly)<br />
16<br />
14<br />
12<br />
10<br />
8<br />
6<br />
4<br />
2<br />
<strong>Canterbury</strong><br />
Rest of New Zealand<br />
Source: realestate.co.nz (most recent data point: January 2013)<br />
41. New property listings<br />
(indexed where average 2007 = 100 and seasonally adjusted, measured monthly)<br />
120<br />
110<br />
100<br />
90<br />
80<br />
70<br />
60<br />
50<br />
<strong>Canterbury</strong><br />
Rest of New Zealand<br />
Source: realestate.co.nz (most recent data point: January 2013)<br />
42. Private weekly rent<br />
(three-month rolling averages, measured monthly)<br />
$380<br />
$360<br />
$340<br />
$320<br />
$300<br />
$280<br />
$260<br />
Christchurch City<br />
Waimakariri District<br />
Selwyn District<br />
Source: Building and Housing Group, Ministry of Business, Innovation and Employment and CERA (most recent data point: December 2012)<br />
19
Insurance<br />
Analysis<br />
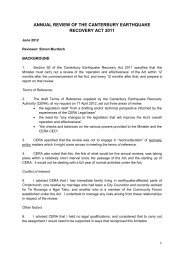
Insurance claims continue to be settled. As at February 2013, 31% of residential properties with<br />
<strong>Canterbury</strong> earthquake dwelling claims have had their claims resolved (figure 43). The <strong>Earthquake</strong><br />
Commission (EQC) has paid $4.1 billion in residential property claims since the earthquakes (figure<br />
44). In addition, Statistics New Zealand estimates that $17.6 billion in international insurance claims<br />
will flow into New Zealand from offshore as a result of the <strong>Canterbury</strong> earthquakes (figure 45).<br />
Figures<br />
43. Claims settlement progress<br />
(properties with <strong>Canterbury</strong> earthquake residential dwelling claims)<br />
claim settled<br />
31%<br />
claim outstanding<br />
69%<br />
171,000 properties in greater<br />
Christchurch have a <strong>Canterbury</strong><br />
earthquake-related dwelling claim<br />
18,500 properties (11%) have<br />
been confirmed as over-cap and<br />
are being managed by an<br />
insurance company<br />
145,000 properties (85%) have<br />
been confirmed as under-cap and<br />
are being managed by EQC<br />
7,500 properties (4%) are yet to<br />
be confirmed as under or over-cap,<br />
although assessments and<br />
rebuild/repair work is continuing on<br />
them by EQC and the insurance<br />
companies<br />
3,600 over-cap properties have<br />
had their claims resolved<br />
50,000 under-cap properties<br />
have had their claims resolved<br />
Source: ICNZ and EQC (most recent update: February 2013)<br />
20
$14<br />
$12<br />
$10<br />
$8<br />
$6<br />
$4<br />
$2<br />
44. Estimated cumulative insurance payments paid out by the <strong>Earthquake</strong> Commission<br />
and other property insurers<br />
($billion, measured quarterly)<br />
$0<br />
Mar-11 Jun-11 Sep-11 Dec-11 Mar-12 Jun-12 Sep-12 Dec-12<br />
Interpretation notes: the earthquake claim payment data collected by the Reserve Bank of New Zealand (RBNZ) insurance<br />
team are for all property insurers affected by the earthquakes excluding reinsurers, Lloyd’s, London Market and other offshore<br />
insurers not active in New Zealand. Infrastructure insurers Civic and LAPP are included, as is Southern Response <strong>Earthquake</strong><br />
Services (former AMI). EQC is not supervised by RBNZ and does not participate in the survey. The data for insurers other<br />
than EQC exclude EQC co-insurance payments and may differ from claims payment information from other sources due to<br />
definitions, exchange rate impacts, or timing differences. The data are provided in the form in which they come from the<br />
source.<br />
$20<br />
$16<br />
EQC and other<br />
property insurers<br />
Source: <strong>Earthquake</strong> Commission, Reserve Bank of New Zealand (most recent data point: December 2012)<br />
45. Estimate of international reinsurance claims settled and outstanding based on the<br />
national balance of payments<br />
($billion, measured quarterly)<br />
EQC<br />
Property insurers<br />
other than EQC<br />
(commercial and<br />
household insurers)<br />
$12<br />
$8<br />
$4<br />
Total claims<br />
Claims outstanding<br />
Settlements completed<br />
$0<br />
Sep-10 Dec-10 Mar-11 Jun-11 Sep-11 Dec-11 Mar-12 Jun-12 Sep-12<br />
Interpretation notes: in this figure, settlements refer to the amounts that insurance companies in New Zealand have received<br />
from overseas reinsurers. This does not necessarily translate into the settlements that <strong>Canterbury</strong> residents have received.<br />
Source: Statistics New Zealand (most recent data point: September 2012, accessed 17 July 2012)<br />
21
Spending and prices<br />
Analysis<br />
Construction prices are rising (figure 46) as are costs of purchasing a house (figure 47). An important<br />
reason for this trend is that <strong>Canterbury</strong> firms are under pressure to meet the demand (figures 48 and<br />
49).<br />
Figures<br />
46. Construction prices<br />
(net percentage of building firms that reported they raised prices in the past three months)<br />
100<br />
50<br />
0<br />
-50<br />
<strong>Canterbury</strong><br />
Rest of New Zealand<br />
-100<br />
Interpretation notes: negative values represent the net percentage of firms that reduced prices. Respondents were asked to<br />
exclude seasonal variations.<br />
1400<br />
47. Consumer price index – purchase of housing<br />
(June 2006 quarter = base of 1000, measured quarterly)<br />
Source: NZIER (most recent data point: December 2012)<br />
1300<br />
1200<br />
1100<br />
<strong>Canterbury</strong><br />
New Zealand<br />
1000<br />
Source: Statistics New Zealand (most recent data point: September 2012)<br />
48. Capacity as a constraint<br />
(percentage of firms that reported capacity was the single factor most limiting their ability to increase production or activity,<br />
measured quarterly)<br />
24%<br />
20%<br />
16%<br />
12%<br />
8%<br />
4%<br />
0%<br />
<strong>Canterbury</strong><br />
Rest of New Zealand<br />
Source: NZIER (most recent data point: December 2012)<br />
22
49. Capacity utilisation<br />
(median percentage capacity utilisation rate of manufacturer and builder respondents, measured quarterly)<br />
95%<br />
93%<br />
91%<br />
89%<br />
87%<br />
<strong>Canterbury</strong><br />
Rest of New Zealand<br />
85%<br />
Source: NZIER (most recent data point: December 2012)<br />
Business environment<br />
Analysis<br />
Net business registrations in <strong>Canterbury</strong> remain positive, although the number of businesses<br />
registering or ceasing activity has slowed (figure 50). More businesses are still leaving <strong>Canterbury</strong><br />
than arriving, but net migration slowed in December 2012 (figure 51).<br />
Figures<br />
1,000<br />
800<br />
600<br />
400<br />
200<br />
0<br />
-200<br />
-400<br />
-600<br />
50. Registrations and cessations of businesses in <strong>Canterbury</strong><br />
Cessations<br />
Registrations<br />
Net<br />
80<br />
60<br />
40<br />
20<br />
0<br />
-20<br />
-40<br />
-60<br />
-80<br />
-100<br />
Source: Inland Revenue (most recent data point: December 2012)<br />
51. Business migration into <strong>Canterbury</strong><br />
Arrivals<br />
Departures<br />
Net Migration<br />
Source: Inland Revenue (most recent data point: December 2012)<br />
23
Population and labour market<br />
Population<br />
Analysis<br />
Population levels are rising in Selwyn District and Waimakariri District and are above pre-earthquake<br />
levels (figure 52). Anecdotal evidence suggests that many families have moved from Christchurch<br />
City to these areas. International migration into the region is outstripping migration out of it (figure 54).<br />
Figures<br />
52. Population estimates<br />
(Indexed where 2007 = 100, measured annually)<br />
120<br />
115<br />
110<br />
105<br />
100<br />
95<br />
Christchurch City<br />
Selwyn District<br />
Waimakariri District<br />
Greater Christchurch<br />
Rest of New Zealand<br />
90<br />
Jul-2007 Jul-2008 Jul-2009 Jul-2010 Jul-2011 Jul-2012<br />
Christchurch<br />
City<br />
Selwyn<br />
District<br />
Waimakariri<br />
District<br />
Greater<br />
Christchurch<br />
Greater<br />
Christchurch<br />
as a<br />
percentage of<br />
New Zealand<br />
Rest of New<br />
Zealand<br />
2007 365,700 36,300 45,100 447,100 10.57% 3,781,200<br />
2008 369,000 37,500 46,100 452,600 10.60% 3,816,300<br />
2009 372,700 38,600 46,900 458,200 10.62% 3,857,600<br />
2010 376,700 39,500 47,600 463,800 10.62% 3,904,000<br />
2011 367,700 41,100 48,600 457,400 10.38% 3,947,800<br />
2012 363,100 42,300 49,200 454,600 10.25% 3,978,400<br />
Source: Statistics New Zealand (most recent data point: June 2012)<br />
53. Migration of registered individual taxpayers into <strong>Canterbury</strong><br />
(number of registered individual taxpayers arriving in and number of registered individual taxpayers leaving <strong>Canterbury</strong>)<br />
1,000<br />
500<br />
0<br />
-500<br />
-1,000<br />
Arrivals<br />
Departures<br />
Net Migration<br />
-1,500<br />
Source: Inland Revenue (most recent data point: December 2012)<br />
24
54. Permanent and long-term net-migration overseas<br />
(measured monthly)<br />
4,000<br />
2,000<br />
0<br />
-2,000<br />
-4,000<br />
-6,000<br />
-8,000<br />
500<br />
250<br />
0<br />
-250<br />
-500<br />
-750<br />
-1000<br />
Rest of New Zealand (LHS)<br />
greater Christchurch (RHS)<br />
10,000<br />
7,500<br />
5,000<br />
Source: Statistics New Zealand (most recent data point: December 2012)<br />
55. Cumulative permanent and long-term net-migration overseas since September 2010<br />
(measured monthly)<br />
2,500<br />
0<br />
-2,500<br />
greater Christchurch<br />
Rest of New Zealand<br />
-5,000<br />
Source: Statistics New Zealand (most recent data point: December 2012)<br />
Interpretation notes: The figures for September 2010 do not start at zero, as a positive number of people migrated out of<br />
greater Christchurch and the rest of New Zealand during the month of September.<br />
1,600,000<br />
1,400,000<br />
1,200,000<br />
1,000,000<br />
800,000<br />
600,000<br />
400,000<br />
200,000<br />
0<br />
56. Bus passenger volumes within Christchurch City<br />
(three-month rolling averages, measured monthly)<br />
Source: Environment <strong>Canterbury</strong> (most recent data point: December 2012)<br />
25
Employment<br />
Analysis<br />
The unemployment rate in <strong>Canterbury</strong> (4.9%) remains lower than the New Zealand rate of 6.9%<br />
(figure 61). Males have a lower unemployment rate than females in <strong>Canterbury</strong> (figure 62). Firms in<br />
<strong>Canterbury</strong> are finding it more difficult to find both skilled and unskilled labour compared both with<br />
firms elsewhere in New Zealand and with previous years (figures 63 and 64).<br />
Figures<br />
57. Employee numbers by industry in <strong>Canterbury</strong><br />
(thousands, measured quarterly)<br />
70<br />
60<br />
50<br />
40<br />
30<br />
20<br />
10<br />
0<br />
Agriculture, forestry, and fishing<br />
and mining<br />
Manufacturing and electricity,<br />
gas, water, and waste services<br />
Construction<br />
Retail trade and accommodation<br />
and food services<br />
Health care and social<br />
assistance<br />
Source: Statistics New Zealand (most recent data point: December 2012)<br />
58. Skilled vacancies index of jobs advertised online<br />
(seasonally adjusted, March 2010 = 100)<br />
220<br />
200<br />
180<br />
160<br />
140<br />
120<br />
100<br />
80<br />
<strong>Canterbury</strong><br />
New Zealand<br />
Interpretation notes: a rising index suggests that the labour market is tightening (due to either an increase in labour demand<br />
or a fall-off in labour supply) while a falling index indicates that the job market is softening, Department of Labour Jobs Online:<br />
Background and Methodology (December 2009)<br />
Source: Ministry of Business, Innovation and Employment (most recent data point: December 2012)<br />
26
59. People employed in the labour force<br />
(thousands, measured quarterly)<br />
2,000<br />
1,950<br />
1,900<br />
1,850<br />
1,800<br />
1,750<br />
1,700<br />
360<br />
350<br />
340<br />
330<br />
320<br />
310<br />
300<br />
Rest of New Zealand (LHS)<br />
<strong>Canterbury</strong> (RHS)<br />
Source: Statistics New Zealand (most recent data point: December 2012)<br />
60. People employed in the labour force in <strong>Canterbury</strong> by gender<br />
(thousands, measured quarterly)<br />
190<br />
180<br />
170<br />
160<br />
150<br />
140<br />
130<br />
120<br />
Male<br />
Female<br />
61. Unemployment rate<br />
(percentage of the labour force, measured quarterly)<br />
Source: Statistics New Zealand (most recent data point: December 2012)<br />
8%<br />
7%<br />
6%<br />
5%<br />
4%<br />
3%<br />
2%<br />
<strong>Canterbury</strong><br />
New Zealand<br />
62. Unemployment rate in <strong>Canterbury</strong> by gender<br />
(percentage of the labour force, measured quarterly)<br />
Source: Statistics New Zealand (most recent data point: December 2012)<br />
9%<br />
8%<br />
7%<br />
6%<br />
5%<br />
4%<br />
3%<br />
2%<br />
Male<br />
Female<br />
Source: Statistics New Zealand (most recent data point: December 2012)<br />
27
63. Ease of finding skilled labour<br />
(net percentage of firms that found it easier to find skilled or specialist labour today compared with three months ago, measured<br />
quarterly)<br />
more difficult easier<br />
80%<br />
60%<br />
40%<br />
20%<br />
0%<br />
-20%<br />
-40%<br />
-60%<br />
<strong>Canterbury</strong><br />
Rest of New Zealand<br />
Interpretation notes: negative values show the net percentage of firms that found it more difficult to find skilled or specialist<br />
labour today compared with three months ago.<br />
Source: NZIER (most recent data point: December 2012)<br />
64. Ease of finding unskilled labour<br />
(net percentage of firms that found it easier to find unskilled or semi-skilled labour today compared with three months ago,<br />
measured quarterly)<br />
more difficult easier<br />
80%<br />
60%<br />
40%<br />
20%<br />
0%<br />
-20%<br />
-40%<br />
-60%<br />
<strong>Canterbury</strong><br />
Rest of New Zealand<br />
Interpretation notes: negative values represent the net percentage of firms that found it more difficult to find unskilled or semiskilled<br />
labour today compared with three months ago.<br />
Source: NZIER (most recent data point: December 2012)<br />
Abbreviations<br />
LHS<br />
RHS<br />
CERA<br />
NZIER<br />
SCIRT<br />
EQC<br />
ICNZ<br />
RoNZ<br />
Glossary<br />
Vertical axis on the left-hand side of the graph<br />
Vertical axis on the right-hand side of the graph<br />
<strong>Canterbury</strong> <strong>Earthquake</strong> <strong>Recovery</strong> Authority<br />
New Zealand Institute of <strong>Economic</strong> Research<br />
Stronger Christchurch Infrastructure Rebuild Team<br />
<strong>Earthquake</strong> Commission<br />
Insurance Council of New Zealand<br />
Rest of New Zealand<br />
28
Regions<br />
<strong>Canterbury</strong> The area governed by Environment<br />
<strong>Canterbury</strong> (ECan), including Christchurch<br />
City, Selwyn District, Waimakariri District,<br />
Hurunui District, Timaru District, Mackenzie<br />
District, Waimate District and Ashburton<br />
District<br />
<strong>Canterbury</strong>/Westland<br />
Christchurch<br />
<strong>Canterbury</strong> regional tourism organisation area<br />
Greater Christchurch<br />
Wider Christchurch<br />
The area governed by Christchurch City,<br />
Selwyn District, Waimakariri District, Timaru<br />
District, Mackenzie District, Waimate District<br />
and Ashburton District as well as the territorial<br />
authorities on the West Coast of the South<br />
Island<br />
The area governed by Christchurch City<br />
Council<br />
Ashburton District, Christchurch City, Kaikoura<br />
District, Selwyn District, Waimakariri District<br />
and Waimate District<br />
The area governed by Christchurch City,<br />
Selwyn District and Waimakariri District<br />
councils<br />
includes Christchurch City, Banks Peninsula,<br />
Waipara, Hanmer Springs and Arthur’s Pass,<br />
but excludes Ashburton and Kaikoura<br />
29
Table of figures<br />
1. Estimate of real gross regional domestic product .................................................................... 3<br />
2. Estimate of changes in economic activity .................................................................................. 3<br />
3. Domestic trading activity ............................................................................................................. 3<br />
4. Views of general business situation ........................................................................................... 4<br />
5. Traffic volumes in <strong>Canterbury</strong> ..................................................................................................... 4<br />
6. Electricity consumption index ..................................................................................................... 4<br />
7. Spending on Christchurch retail trade and services................................................................. 5<br />
8. Electronic card transactions on the Paymark network ............................................................. 5<br />
9. Consumer confidence .................................................................................................................. 5<br />
10. Combined exports and imports index .................................................................................... 6<br />
11. Employee count by industry in <strong>Canterbury</strong> ........................................................................... 7<br />
12. Agriculture, forestry and fishing production ......................................................................... 8<br />
13. Slaughter of livestock graded for export, excluding game .................................................. 8<br />
14. Manufacturing index ................................................................................................................. 9<br />
15. Manufacturing sector employees ............................................................................................ 9<br />
16. Domestic trading activity for manufacturers and builders ................................................... 9<br />
17. Services expanding and contracting index .......................................................................... 10<br />
18. International education visas issued .................................................................................... 10<br />
19. International guest nights ...................................................................................................... 11<br />
20. Domestic guest nights ............................................................................................................ 11<br />
21. International passenger movements .................................................................................... 12<br />
22. Capacity of accommodation establishments in Christchurch City ................................... 12<br />
23. Forecast hotel capacity .......................................................................................................... 12<br />
24. Status of major tourist attractions in greater Christchurch ............................................... 13<br />
25. Building consents within the CBD area ................................................................................ 13<br />
26. Employers returning to the Christchurch City downtown area ......................................... 14<br />
27. Estimated number of restaurants and cafes since the February 2011 earthquake ......... 14<br />
28. Investment intentions – buildings ......................................................................................... 15<br />
29. Investment intentions – plant and machinery ...................................................................... 15<br />
30. Confidence of commercial property investors in New Zealand ......................................... 15<br />
31. Confidence of commercial property investors in Christchurch......................................... 16<br />
32. CERA's Index of Building Consents ..................................................................................... 16<br />
33. Building activity ...................................................................................................................... 17<br />
34. Ready-mixed concrete production ........................................................................................ 17<br />
35. SCIRT progress statistics ...................................................................................................... 17<br />
36. Building activity of residential buildings .............................................................................. 18<br />
37. House prices ............................................................................................................................ 18<br />
38. House sales ............................................................................................................................. 18<br />
39. Days to sell a house ................................................................................................................ 19<br />
40. Supply of properties on the market ...................................................................................... 19<br />
30
41. New property listings .............................................................................................................. 19<br />
42. Private weekly rent .................................................................................................................. 19<br />
43. Claims settlement progress ................................................................................................... 20<br />
44. Estimated cumulative insurance payments paid out by the <strong>Earthquake</strong> Commission and<br />
other property insurers ...................................................................................................................... 21<br />
45. Estimate of international reinsurance claims settled and outstanding based on the<br />
national balance of payments ............................................................................................................ 21<br />
46. Construction prices ................................................................................................................ 22<br />
47. Consumer price index – purchase of housing ..................................................................... 22<br />
48. Capacity as a constraint ......................................................................................................... 22<br />
49. Capacity utilisation ................................................................................................................. 23<br />
50. Registrations and cessations of businesses in <strong>Canterbury</strong> .............................................. 23<br />
51. Business migration into <strong>Canterbury</strong> ..................................................................................... 23<br />
52. Population estimates .............................................................................................................. 24<br />
53. Migration of registered individual taxpayers into <strong>Canterbury</strong> ........................................... 24<br />
54. Permanent and long-term net-migration overseas .............................................................. 25<br />
55. Cumulative permanent and long-term net-migration overseas since September 2010 .. 25<br />
56. Bus passenger volumes within Christchurch City .............................................................. 25<br />
57. Employee numbers by industry in <strong>Canterbury</strong> .................................................................... 26<br />
58. Skilled vacancies index of jobs advertised online .............................................................. 26<br />
59. People employed in the labour force .................................................................................... 27<br />
60. People employed in the labour force in <strong>Canterbury</strong> by gender ......................................... 27<br />
61. Unemployment rate ................................................................................................................. 27<br />
62. Unemployment rate in <strong>Canterbury</strong> by gender ...................................................................... 27<br />
63. Ease of finding skilled labour ................................................................................................ 28<br />
64. Ease of finding unskilled labour ............................................................................................ 28<br />
31