Canterbury Economic Indicators - Canterbury Earthquake Recovery ...
Canterbury Economic Indicators - Canterbury Earthquake Recovery ...
Canterbury Economic Indicators - Canterbury Earthquake Recovery ...

Create successful ePaper yourself
Turn your PDF publications into a flip-book with our unique Google optimized e-Paper software.
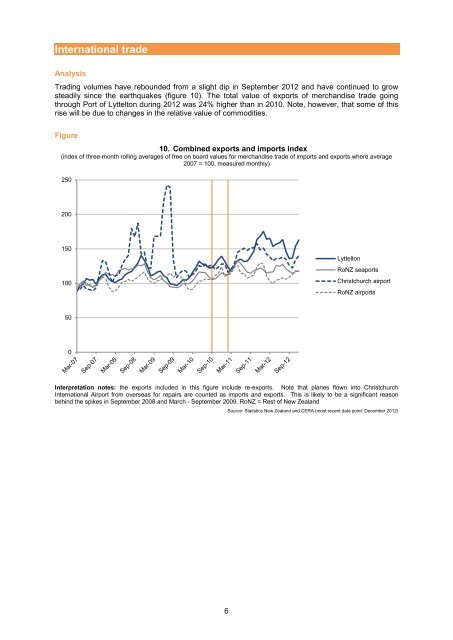
International trade<br />
Analysis<br />
Trading volumes have rebounded from a slight dip in September 2012 and have continued to grow<br />
steadily since the earthquakes (figure 10). The total value of exports of merchandise trade going<br />
through Port of Lyttelton during 2012 was 24% higher than in 2010. Note, however, that some of this<br />
rise will be due to changes in the relative value of commodities.<br />
Figure<br />
10. Combined exports and imports index<br />
(index of three-month rolling averages of free on board values for merchandise trade of imports and exports where average<br />
2007 = 100, measured monthly)<br />
250<br />
200<br />
150<br />
100<br />
Lyttelton<br />
RoNZ seaports<br />
Christchurch airport<br />
RoNZ airports<br />
50<br />
0<br />
Interpretation notes: the exports included in this figure include re-exports. Note that planes flown into Christchurch<br />
International Airport from overseas for repairs are counted as imports and exports. This is likely to be a significant reason<br />
behind the spikes in September 2008 and March - September 2009. RoNZ = Rest of New Zealand<br />
Source: Statistics New Zealand and CERA (most recent data point: December 2012)<br />
6