Annual REPORT - Elections Manitoba
Annual REPORT - Elections Manitoba
Annual REPORT - Elections Manitoba

You also want an ePaper? Increase the reach of your titles
YUMPU automatically turns print PDFs into web optimized ePapers that Google loves.
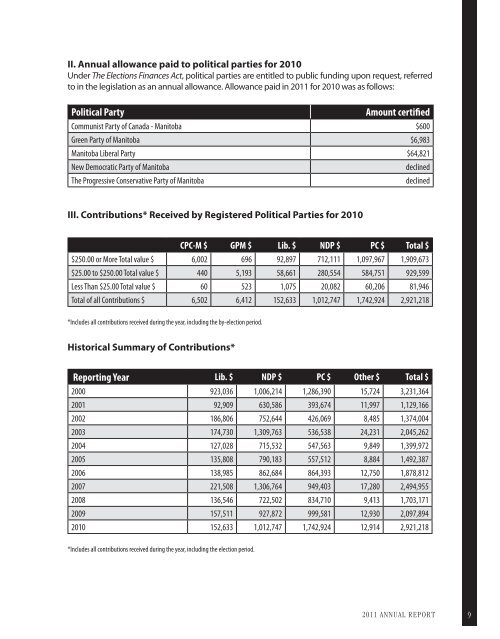
II. <strong>Annual</strong> allowance paid to political parties for 2010<br />
Under The <strong>Elections</strong> Finances Act, political parties are entitled to public funding upon request, referred<br />
to in the legislation as an annual allowance. Allowance paid in 2011 for 2010 was as follows:<br />
Political Party<br />
Amount certified<br />
Communist Party of Canada - <strong>Manitoba</strong> $600<br />
Green Party of <strong>Manitoba</strong> $6,983<br />
<strong>Manitoba</strong> Liberal Party $64,821<br />
New Democratic Party of <strong>Manitoba</strong><br />
The Progressive Conservative Party of <strong>Manitoba</strong><br />
declined<br />
declined<br />
III. Contributions* Received by Registered Political Parties for 2010<br />
CPC-M $ GPM $ Lib. $ NDP $ PC $ Total $<br />
$250.00 or More Total value $ 6,002 696 92,897 712,111 1,097,967 1,909,673<br />
$25.00 to $250.00 Total value $ 440 5,193 58,661 280,554 584,751 929,599<br />
Less Than $25.00 Total value $ 60 523 1,075 20,082 60,206 81,946<br />
Total of all Contributions $ 6,502 6,412 152,633 1,012,747 1,742,924 2,921,218<br />
*Includes all contributions received during the year, including the by-election period.<br />
Historical Summary of Contributions*<br />
Reporting Year Lib. $ NDP $ PC $ Other $ Total $<br />
2000 923,036 1,006,214 1,286,390 15,724 3,231,364<br />
2001 92,909 630,586 393,674 11,997 1,129,166<br />
2002 186,806 752,644 426,069 8,485 1,374,004<br />
2003 174,730 1,309,763 536,538 24,231 2,045,262<br />
2004 127,028 715,532 547,563 9,849 1,399,972<br />
2005 135,808 790,183 557,512 8,884 1,492,387<br />
2006 138,985 862,684 864,393 12,750 1,878,812<br />
2007 221,508 1,306,764 949,403 17,280 2,494,955<br />
2008 136,546 722,502 834,710 9,413 1,703,171<br />
2009 157,511 927,872 999,581 12,930 2,097,894<br />
2010 152,633 1,012,747 1,742,924 12,914 2,921,218<br />
*Includes all contributions received during the year, including the election period.<br />
2011 ANNUAL <strong>REPORT</strong><br />
9