Washburn Lake - Cass County, Minnesota
Washburn Lake - Cass County, Minnesota
Washburn Lake - Cass County, Minnesota

Create successful ePaper yourself
Turn your PDF publications into a flip-book with our unique Google optimized e-Paper software.
<strong>Washburn</strong> <strong>Lake</strong> 11-0059-00 CASS COUNTY<br />
Summary<br />
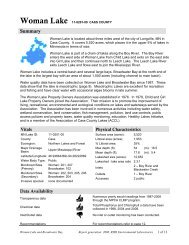
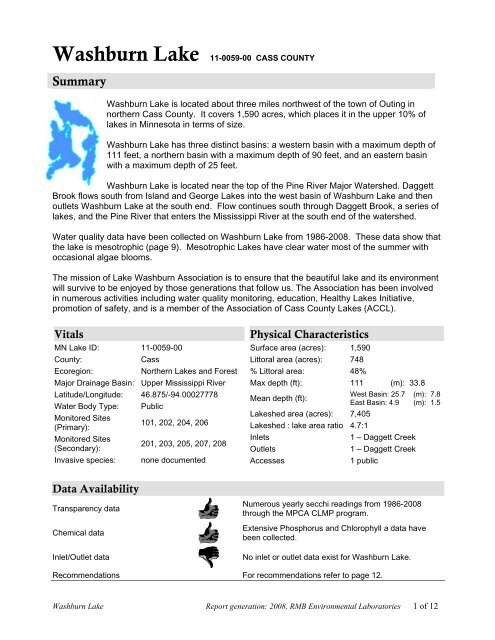
<strong>Washburn</strong> <strong>Lake</strong> is located about three miles northwest of the town of Outing in<br />
northern <strong>Cass</strong> <strong>County</strong>. It covers 1,590 acres, which places it in the upper 10% of<br />
lakes in <strong>Minnesota</strong> in terms of size.<br />
<strong>Washburn</strong> <strong>Lake</strong> has three distinct basins: a western basin with a maximum depth of<br />
111 feet, a northern basin with a maximum depth of 90 feet, and an eastern basin<br />
with a maximum depth of 25 feet.<br />
<strong>Washburn</strong> <strong>Lake</strong> is located near the top of the Pine River Major Watershed. Daggett<br />
Brook flows south from Island and George <strong>Lake</strong>s into the west basin of <strong>Washburn</strong> <strong>Lake</strong> and then<br />
outlets <strong>Washburn</strong> <strong>Lake</strong> at the south end. Flow continues south through Daggett Brook, a series of<br />
lakes, and the Pine River that enters the Mississippi River at the south end of the watershed.<br />
Water quality data have been collected on <strong>Washburn</strong> <strong>Lake</strong> from 1986-2008. These data show that<br />
the lake is mesotrophic (page 9). Mesotrophic <strong>Lake</strong>s have clear water most of the summer with<br />
occasional algae blooms.<br />
The mission of <strong>Lake</strong> <strong>Washburn</strong> Association is to ensure that the beautiful lake and its environment<br />
will survive to be enjoyed by those generations that follow us. The Association has been involved<br />
in numerous activities including water quality monitoring, education, Healthy <strong>Lake</strong>s Initiative,<br />
promotion of safety, and is a member of the Association of <strong>Cass</strong> <strong>County</strong> <strong>Lake</strong>s (ACCL).<br />
Vitals<br />
MN <strong>Lake</strong> ID: 11-0059-00<br />
<strong>County</strong>:<br />
<strong>Cass</strong><br />
Ecoregion:<br />
Northern <strong>Lake</strong>s and Forest<br />
Major Drainage Basin: Upper Mississippi River<br />
Latitude/Longitude: 46.875/-94.00027778<br />
Water Body Type: Public<br />
Monitored Sites<br />
(Primary):<br />
101, 202, 204, 206<br />
Monitored Sites<br />
(Secondary):<br />
201, 203, 205, 207, 208<br />
Invasive species: none documented<br />
Physical Characteristics<br />
Surface area (acres): 1,590<br />
Littoral area (acres): 748<br />
% Littoral area: 48%<br />
Max depth (ft): 111 (m): 33.8<br />
West Basin: 25.7 (m): 7.8<br />
Mean depth (ft):<br />
East Basin: 4.9 (m): 1.5<br />
<strong>Lake</strong>shed area (acres): 7,405<br />
<strong>Lake</strong>shed : lake area ratio 4.7:1<br />
Inlets<br />
1 – Daggett Creek<br />
Outlets<br />
1 – Daggett Creek<br />
Accesses<br />
1 public<br />
Data Availability<br />
Transparency data<br />
Chemical data<br />
Inlet/Outlet data<br />
Numerous yearly secchi readings from 1986-2008<br />
through the MPCA CLMP program.<br />
Extensive Phosphorus and Chlorophyll a data have<br />
been collected.<br />
No inlet or outlet data exist for <strong>Washburn</strong> <strong>Lake</strong>.<br />
Recommendations For recommendations refer to page 12.<br />
<strong>Washburn</strong> <strong>Lake</strong> Report generation: 2008, RMB Environmental Laboratories 1 of 12
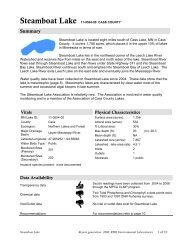
Figure 1. Map of <strong>Washburn</strong> <strong>Lake</strong> illustrating bathymetry, lake sample site locations, stream inlets and outlets<br />
and aerial land use. The pink shaded areas in the lake illustrate the littoral zone, where the sunlight can<br />
usually reach the lake bottom allowing aquatic plants to grow.<br />
<strong>Lake</strong> Site Depth (ft) Monitoring Programs<br />
101 (3901) 90 CLMP: 2001-2002; MPCA: 2004, 1986; Outdoor Corps: 2004; RMB Lab: 2006-2008<br />
103 60 MPCA: 2004, 1986<br />
201 65 CLMP: 1986-1995, 2003-2007<br />
202 80 CLMP: 1986, 1999, 2001-2002; Outdoor Corps: 2004; RMB Lab: 2005-2008<br />
203 25 CLMP: 1986-2007<br />
204 (104) 20 CLMP: 1986-2008; MPCA: 1986; Outdoor Corps: 2004; RMB Lab: 2005-2008<br />
205 65 CLMP: 1986-2007<br />
206 15 CLMP: 1993-1995, 2003-2008; RMB Lab: 2005-2008<br />
207 22 CLMP: 2000-2007<br />
208 30 CLMP: 2005-2007<br />
<strong>Washburn</strong> <strong>Lake</strong> Report generation: 2008, RMB Environmental Laboratories 2 of 12
The information below describes available chemical data for <strong>Washburn</strong> <strong>Lake</strong> through 2008. The<br />
data set is limited, and all parameters with the exception of total phosphorus, chlorophyll a and<br />
secchi depth are means for just 1986 and 2004 data.<br />
<strong>Minnesota</strong> is divided into seven ecoregions based on land use, vegetation, precipitation and<br />
geology. The MPCA has developed a way to determine the "average range" of water quality<br />
expected for lakes in each ecoregion. For more information on ecoregions and expected water<br />
quality ranges, see page 11.<br />
West Bay<br />
Site 101<br />
Mean<br />
North Bay<br />
Site 202<br />
Mean<br />
East Bay<br />
Site 204<br />
Mean<br />
Ecoregion<br />
Parameter<br />
Range 1 Interpretation<br />
Total phosphorus (ug/L) 15.0 12.3 15.8 14 - 27 Results are within the<br />
Chlorophyll a (ug/L) 2 5.3 5.0 4.7 4 - 10 expected range for the<br />
Chlorophyll a max (ug/L) 9 9 14
Water Quality Characteristics - Historical Means<br />
Years monitored: 1986-2008<br />
Parameters<br />
West Basin<br />
Site<br />
101<br />
Site<br />
201<br />
Site<br />
203<br />
North Basin<br />
East<br />
Basin<br />
Total Phosphorus Mean (ug/L): 15.0 13.1 12.3 15.8<br />
Total Phosphorus Min: 6 8 8 9<br />
Total Phosphorus Max: 33 19 20 31<br />
Number of Observations: 28 20 25 33<br />
Chlorophyll a Mean (ug/L): 5.3 5.6 5.0 4.7<br />
Chlorophyll-a Min: 2 2 2.0 1<br />
Chlorophyll-a Max: 9 8 9.0 14<br />
Number of Observations: 28 20 24 32<br />
Secchi Depth Mean (ft): 11.8 13.1 10.2 11.0 12.9 15.3 13.9 14.6 10.8<br />
Secchi Depth Min: 5.9 8.0 4.5 5.5 8.2 10.5 9.0 10.5 6.0<br />
Secchi Depth Max: 17.0 18.5 16.0 17.0 18.5 21.0 19.0 19.0 18.0<br />
Number of Observations: 40 160 310 67 49 286 148 34 405<br />
Site<br />
206<br />
Site<br />
202<br />
Site<br />
205<br />
Site<br />
207<br />
Site<br />
208<br />
Site<br />
204<br />
Figure 2. <strong>Washburn</strong> <strong>Lake</strong> total phosphorus, chlorophyll a and transparency historical ranges. The arrow<br />
represents the range and the black dot represents the historical mean (Primary Site 101). Figure adapted after<br />
Moore and Thornton, [Ed.]. 1988. <strong>Lake</strong> and Reservoir Restoration Guidance Manual. (Doc. No. EPA 440/5-88-002)<br />
<strong>Washburn</strong> <strong>Lake</strong> Report generation: 2008, RMB Environmental Laboratories 4 of 12
Transparency (Secchi Depth)<br />
Transparency is how easily light can pass through a substance. In lakes it is how deep sunlight<br />
penetrates through the water. Plants and algae need sunlight to grow, so they are only able to<br />
grow in areas of lakes where the sun penetrates. Water transparency depends on the amount of<br />
particles in the water. An increase in particulates results in a decrease in transparency.<br />
The transparency varies year-to-year due to changes in weather, precipitation, lake use, flooding,<br />
temperature, lake levels, etc. Figure 3 shows that in most years, site 205 in the northern basin had<br />
the best transparency and sites 203 and 204 had the lowest transparency. These results make<br />
sense in that sites 203 and 204 are the shallowest sites.<br />
The long-term transparency data set for <strong>Washburn</strong> <strong>Lake</strong> is excellent since 1986. Transparency<br />
monitoring should be continued annually at all sites in order to track water quality changes in the<br />
future.<br />
20<br />
Transparency: Annual Means<br />
Secchi Depth (ft)<br />
18<br />
16<br />
14<br />
12<br />
10<br />
8<br />
6<br />
4<br />
2<br />
0<br />
Site 201<br />
Site 203<br />
Site 204<br />
Site 205<br />
Site 207<br />
1986<br />
1988<br />
1990<br />
1992<br />
1994<br />
1996<br />
1998<br />
2000<br />
2002<br />
2004<br />
2006<br />
2008<br />
Figure 3. Annual transparency means for <strong>Washburn</strong> <strong>Lake</strong> monitoring sites.<br />
<strong>Washburn</strong> <strong>Lake</strong> transparency ranges from 10.5 to 21 ft at site 205. Figure 4 shows the seasonal<br />
transparency dynamics. <strong>Washburn</strong> <strong>Lake</strong> transparency is highest in May and then it declines<br />
slightly throughout the rest of the summer. Transparency in some lakes varies throughout the<br />
summer, while in others it stays relatively constant. The transparency dynamics are related to lake<br />
turnover and algae population dynamics.<br />
<strong>Washburn</strong> <strong>Lake</strong> Report generation: 2008, RMB Environmental Laboratories 5 of 12
Figure 4. Seasonal transparency dynamics and year-to-year comparison (Site 205).<br />
User Perceptions<br />
When volunteers collect secchi depth readings,<br />
they record their perceptions of the water based<br />
on the physical appearance and the<br />
recreational suitability. These perceptions can<br />
be compared to water quality parameters to see<br />
how the lake "user" would experience the lake<br />
at that time. Looking at transparency data, as<br />
the secchi depth decreases the perception of<br />
the lake's physical appearance rating<br />
decreases. The northern basin of <strong>Washburn</strong><br />
<strong>Lake</strong> was rated as having crystal clear water<br />
42% of the time, while the western basin and<br />
eastern basin were 2% and 7% respectively<br />
(Figure 5).<br />
Physical Appearance Rating<br />
Crystal clear water<br />
Not quite crystal clear – a little algae visible<br />
Definite algae – green, yellow, or brown<br />
color apparent<br />
High algae levels with limited clarity and/or<br />
mild odor apparent<br />
Severely high algae levels<br />
4%<br />
2%<br />
7%<br />
2%<br />
27%<br />
42%<br />
56%<br />
94%<br />
66%<br />
Site 201<br />
Western Basin<br />
Site 204<br />
Eastern Basin<br />
Site 205<br />
Northern Basin<br />
Figure 5. Physical appearance rating for all three basins, as rated by the volunteer monitor (1986-2008).<br />
<strong>Washburn</strong> <strong>Lake</strong> Report generation: 2008, RMB Environmental Laboratories 6 of 12
As the secchi depth decreases,<br />
the perception of recreational<br />
suitability of the lake decreases.<br />
The basins differ somewhat in<br />
rating. The northern basin was<br />
rated as being beautiful 72% of<br />
the time, while the eastern and<br />
western basins were rated as<br />
beautiful 9-10% of the time<br />
(Figure 6).<br />
Recreational Suitability Rating<br />
Beautiful, could not be better<br />
Very minor aesthetic problems; excellent for<br />
swimming, boating<br />
Swimming and aesthetic enjoyment of the lake slightly<br />
impaired because of algae levels<br />
Desire to swim and level of enjoyment of the lake<br />
substantially reduced because of algae levels<br />
Swimming and aesthetic enjoyment of the lake<br />
nearly impossible because of algae levels<br />
10%<br />
23%<br />
0%<br />
9%<br />
28%<br />
72%<br />
90%<br />
Site 201<br />
Western Basin<br />
Site 204<br />
Eastern Basin<br />
68%<br />
Site 205<br />
Northern Basin<br />
Figure 6. Recreational suitability rating for all three basins, as rated by the volunteer monitor (1986-2008).<br />
Total Phosphorus<br />
<strong>Washburn</strong> <strong>Lake</strong> is phosphorus<br />
limited, which means that algae<br />
and aquatic plant growth is<br />
dependent upon available<br />
phosphorus.<br />
Total phosphorus was evaluated in<br />
<strong>Washburn</strong> <strong>Lake</strong> in 1986 and 2004-<br />
2008 (Figure 7). The data indicate<br />
that total phosphorus concentrations<br />
stay relatively consistent<br />
throughout the year and are<br />
highest in May.<br />
Site 204, the eastern basin, has<br />
the highest average phosphorus<br />
concentration. This result makes<br />
sense because it is a very shallow<br />
basin compared to the other two<br />
basins. Site 202 in the northern<br />
basin has the lowest average<br />
phosphorus concentration.<br />
Total Phosphrous (ug/L)<br />
25<br />
20<br />
15<br />
10<br />
5<br />
0<br />
1-May<br />
Total Phosphorus<br />
Figure 7. Historical total phosphorus concentrations (ug/L) for<br />
<strong>Washburn</strong> <strong>Lake</strong> (graph represents averages for each site throughout<br />
the growing season from 2005-2008).<br />
<strong>Washburn</strong> <strong>Lake</strong> Report generation: 2008, RMB Environmental Laboratories 7 of 12<br />
1-Jun<br />
1-Jul<br />
1-Aug<br />
1-Sep<br />
Site 101<br />
Site 202<br />
Site 204<br />
Site 206
Chlorophyll a<br />
Chlorophyll a is the pigment<br />
that makes plants and algae<br />
Chlorophyll a<br />
green. Chlorophyll a is tested<br />
20<br />
Site 101<br />
in lakes to determine the algae<br />
18<br />
Site 202<br />
concentration or how "green"<br />
16<br />
the water is.<br />
Site 204<br />
14<br />
Site 206<br />
Chlorophyll a concentrations<br />
12<br />
greater than 10 ug/L are<br />
perceived as a mild algae<br />
10<br />
bloom, while concentrations<br />
8<br />
greater than 20 ug/L are<br />
6<br />
perceived as a nuisance.<br />
4<br />
Chlorophyll a was evaluated in<br />
2<br />
<strong>Washburn</strong> <strong>Lake</strong> in 1986 and<br />
2004-2008 (Figure 8).<br />
0<br />
Chlorophyll a concentrations<br />
remained below 10 ug/L in all<br />
years at all sites, indicating<br />
clear water most of the<br />
Figure 8. Chlorophyll a concentrations (ug/L) for <strong>Washburn</strong> <strong>Lake</strong> (graph<br />
summer. The chlorophyll a represents averages for each site throughout the growing season from<br />
concentrations stay relatively<br />
2005-2008)<br />
steady throughout the summer,<br />
which is consistent with the transparency results (Figure 4).<br />
Dissolved Oxygen<br />
Chlorophyll a (ug/L)<br />
1-May<br />
1-Jun<br />
1-Jul<br />
1-Aug<br />
1-Sep<br />
Dissolved Oxygen (mg/L)<br />
0 2 4 6 8 10 12<br />
0<br />
1<br />
2<br />
3<br />
4<br />
5<br />
6<br />
7<br />
Depth<br />
(m)<br />
8<br />
9<br />
10<br />
12<br />
14<br />
16<br />
18<br />
Dissolved Oxygen (DO) is the amount of oxygen dissolved in lake<br />
water. Oxygen is necessary for all living organisms to survive,<br />
except for some bacteria. Living organisms breathe in oxygen that<br />
is dissolved in the water. Dissolved oxygen levels of
Trophic State Index<br />
Phosphorus (nutrients), chlorophyll a<br />
(algae concentration) and Secchi<br />
depth (transparency) are related. As<br />
phosphorus increases, there is more<br />
food available for algae, resulting in<br />
increased algal concentrations.<br />
When algal concentrations increase,<br />
the water becomes less transparent<br />
and the Secchi depth decreases.<br />
Trophic State Index<br />
North Basin<br />
Site 202<br />
West Basin<br />
Site 101<br />
East Basin<br />
Site 204<br />
TSI Total Phosphorus 40 42 44<br />
TSI Chlorophyll-a 46 46 44<br />
TSI Secchi 41 42 43<br />
TSI Mean 42 43 44<br />
Trophic State: Mesotrophic Mesotrophic Mesotrophic<br />
Numbers represent the mean TSI for each parameter.<br />
The results from these three measurements cover different<br />
units and ranges and thus cannot be directly compared to<br />
each other or averaged. In order to standardize these<br />
three measurements to make them directly comparable,<br />
we convert them to a trophic state index (TSI).<br />
The mean TSI indicates all basins are mesotrophic (Figure<br />
10). There is good agreement between the TSI for<br />
phosphorus, and transparency, indicating that these<br />
variables are strongly related. The<br />
chlorophyll a TSI is slightly higher than <strong>Washburn</strong> <strong>Lake</strong><br />
the others.<br />
The east basin has a slightly higher mean TSI than the<br />
north and west basins. These results are consistent with<br />
the other monitoring results for <strong>Washburn</strong> <strong>Lake</strong>.<br />
Hypereutrophic<br />
Eutrophic<br />
Mesotrophic<br />
Oligotrophic<br />
100<br />
70<br />
50<br />
40<br />
Mesotrophic lakes (TSI 40-50) are characterized by<br />
moderately clear water most of the summer. "Meso"<br />
means middle or mid; therefore, mesotrophic means a<br />
medium amount of productivity. Mesotrophic lakes are<br />
commonly found in central <strong>Minnesota</strong> and have clear<br />
water with some algal blooms in late summer.<br />
Figure 10. Trophic state index chart with<br />
corresponding trophic status.<br />
0<br />
TSI Attributes Fisheries & Recreation<br />
80 Algal scums, few aquatic plants. Rough fish (carp) dominate; summer fish kills<br />
possible.<br />
Source: Carlson, R.E. 1997. A trophic state index for lakes. Limnology and Oceanography. 22:361-369.<br />
<strong>Washburn</strong> <strong>Lake</strong> Report generation: 2008, RMB Environmental Laboratories 9 of 12
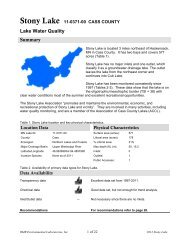
Trend Analysis<br />
For detecting trends, a minimum of 8-10 years of data with 4 or more readings per season are<br />
recommended. Minimum confidence accepted by the MPCA is 90%. This means that there is a<br />
90% chance that the data are showing a true trend and a 10% chance that the trend is a random<br />
result of the data. Only short-term trends can be determined with just a few years of data, because<br />
there can be different wet years and dry years, water levels, weather, etc., that affect the water<br />
quality naturally.<br />
There is not enough historical data to perform trend analysis for total phosphorus or chlorophyll a<br />
on <strong>Washburn</strong> <strong>Lake</strong>. There was enough transparency data for all basins to perform long-term and<br />
short-term trend analyses (Figure 11). The data was analyzed using the Mann Kendall Trend<br />
Analysis.<br />
Basin <strong>Lake</strong> Site Parameter Date Range Trend Probability<br />
North 205 Transparency 1987-2007 Improving 90%<br />
North 205 Transparency 1999-2007 Improving 99.9%<br />
East 204 Transparency 1986-2008 Improving 99.9%<br />
East 204 Transparency 2000-2008 No Trend ---<br />
West 203 Transparency 1986-2007 Improving 99.9%<br />
West 203 Transparency 1999-2007 No Trend ---<br />
Figure 11. Transparency trend for the <strong>Washburn</strong> lake north basin from 1987-2007.<br />
Overall, the transparency in <strong>Washburn</strong> <strong>Lake</strong> is improving in all bays. In the north basin the<br />
transparency has increased approximately one foot from 1987-2007, the west basin has increased<br />
approximately 2 feet from 1986-2007, and the east basin has increased approximately 2 feet from<br />
1987-2007. In the east and west basins there is no trend in transparency occurring since 1999,<br />
which means that the transparency is not declining or improving, it is staying the same.<br />
Transparency monitoring should continue in all basins so that this trend can be tracked in the<br />
future.<br />
<strong>Washburn</strong> <strong>Lake</strong> Report generation: 2008, RMB Environmental Laboratories 10 of 12
Ecoregion Comparisons<br />
<strong>Minnesota</strong> is divided into seven ecoregions based on<br />
land use, vegetation, precipitation and geology. The<br />
MPCA has developed a way to determine the "average<br />
range" of water quality expected for lakes in each<br />
ecoregion. From 1985-1988, the MPCA evaluated the<br />
lake water quality for reference lakes. These reference<br />
lakes are not considered pristine, but are considered to<br />
have little human impact and therefore are<br />
representative of the typical lakes within the ecoregion.<br />
The "average range" refers to the 25 th - 75 th percentile<br />
range for data within each ecoregion. For the purpose<br />
of this graphical representation, the means of the<br />
reference lake data sets were used.<br />
<strong>Washburn</strong> <strong>Lake</strong> is in the Northern<br />
<strong>Lake</strong>s and Forests Ecoregion.<br />
The mean total phosphorus,<br />
chlorophyll a and transparency<br />
(secchi depth) for the <strong>Washburn</strong> are within the expected ecoregion ranges<br />
(Figures 12a-c).<br />
60<br />
30<br />
0<br />
Total Phosphorus (ug/L, ppb)<br />
50<br />
40<br />
30<br />
20<br />
10<br />
Chlorophyll-a (ug/L, ppb)<br />
25<br />
20<br />
15<br />
10<br />
5<br />
Secchi depth (ft)<br />
5<br />
10<br />
15<br />
20<br />
increased<br />
algae<br />
0<br />
NLF Ecoregion<br />
<strong>Washburn</strong> West<br />
Wasburn North<br />
Wasburn East<br />
0<br />
a b c<br />
NLF Ecoregion<br />
<strong>Washburn</strong> West<br />
Wasburn North<br />
Wasburn East<br />
25<br />
crystal<br />
clear<br />
Figures 12a-c. <strong>Washburn</strong> <strong>Lake</strong> ranges compared to Northern <strong>Lake</strong>s and Forest Ecoregion ranges. The<br />
<strong>Washburn</strong> <strong>Lake</strong> total phosphorus and chlorophyll a ranges are from 25-33 data points in each basin<br />
collected in May-September of 2004-2008. The <strong>Washburn</strong> <strong>Lake</strong> secchi depth range is from 161-405 data<br />
points in each basin collected in May-September from 1986-2008.<br />
<strong>Washburn</strong> <strong>Lake</strong> Report generation: 2008, RMB Environmental Laboratories 11 of 12
Inlet/Outlet Data Assessment<br />
No inlet or outlet data exist for <strong>Washburn</strong> <strong>Lake</strong>.<br />
Assessment/Findings Recommendations<br />
Transparency<br />
Transparency monitoring at all sites continued annually. It is important to continue transparency<br />
monitoring weekly or at least bimonthly every year to enable year-to-year comparisons and trend<br />
analyses.<br />
Impaired Waters Assessment 303(d) List<br />
There are two main types of Impaired Waters Assessment for lakes: eutrophication (excess<br />
phosphorus) for aquatic recreation and mercury in fish tissue for aquatic consumption. <strong>Washburn</strong><br />
<strong>Lake</strong> was listed as impaired for mercury in fish tissue in the 2006 Impaired Waters List; however it<br />
is part of the statewide mercury TMDL, so it was removed from the 2008 Impaired Waters List.<br />
<strong>Washburn</strong> <strong>Lake</strong> is not listed as impaired for eutrophication.<br />
Aquatic Recreational Use Assessment 305(b)<br />
In the 2008 MPCA Aquatic Use Assessment (305(b)), <strong>Washburn</strong> <strong>Lake</strong> was classified as fully<br />
supporting for recreational use.<br />
Inlet/Outlet Assessment<br />
Because of the lack of inlet/outlet data, a mass balance project should be considered. This study<br />
answers questions about nutrient loading into the lake and nutrient budget within the lake.<br />
Organizational contacts and reference sites<br />
<strong>Washburn</strong> <strong>Lake</strong> Association<br />
<strong>Cass</strong> <strong>County</strong> Environmental<br />
Services Department<br />
DNR Fisheries Office<br />
Regional <strong>Minnesota</strong> Pollution<br />
Control Agency Office<br />
Regional Board of Soil and Water<br />
Resources Office<br />
http://www.minnesotawaters.org/index.phpuberKey=1292<br />
303 <strong>Minnesota</strong> Avenue W, P.O. Box 3000, Walker, MN 56484-3000<br />
(218) 547-7241<br />
http://www.co.cass.mn.us/esd/home_esd.html<br />
1601 <strong>Minnesota</strong> Drive, Brainerd, MN 56401<br />
(218) 828-2550<br />
http://www.dnr.state.mn.us/lakefind/index.html<br />
7678 College Road, Suite 105, Baxter, MN 56425<br />
(218) 828-2492<br />
http://www.pca.state.mn.us<br />
1601 <strong>Minnesota</strong> Drive, Brainerd, MN 56401<br />
(218) 828-2383<br />
http://www.bwsr.state.mn.us<br />
<strong>Washburn</strong> <strong>Lake</strong> Report generation: 2008, RMB Environmental Laboratories 12 of 12