Stony - Cass County, Minnesota
Stony - Cass County, Minnesota
Stony - Cass County, Minnesota

Create successful ePaper yourself
Turn your PDF publications into a flip-book with our unique Google optimized e-Paper software.
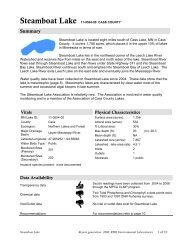
<strong>Stony</strong> Lake 11-0371-00 CASS COUNTYLake Water QualitySummary<strong>Stony</strong> Lake is located 3 miles northeast of Hackensack,MN in <strong>Cass</strong> <strong>County</strong>. It has two bays and covers 571acres (Table 1).<strong>Stony</strong> Lake has no major inlets and one outlet, whichclassify it as a groundwater drainage lake. The outletleaves the lake from the northeast corner andcontinues into Cub Lake.<strong>Stony</strong> Lake has been monitored consistently since1997 (Tables 2-3). These data show that the lake is onthe oligotrophic/mesotrophic border (TSI = 38) withclear water conditions most of the summer and excellent recreational opportunities.The <strong>Stony</strong> Lake Association “promotes and maintains the environmental, economic, andrecreational protection of <strong>Stony</strong> Lake and vicinity”. They are involved in many activities, includingwater quality monitoring, and are a member of the Association of <strong>Cass</strong> <strong>County</strong> Lakes (ACCL).Table 1. <strong>Stony</strong> Lake location and key physical characteristics.Location DataMN Lake ID: 11-0371-00<strong>County</strong>:<strong>Cass</strong>Ecoregion:Northern Lakes and ForestsMajor Drainage Basin: Upper Mississippi RiverLatitude/Longitude: 46.96369934/-94.4897995Invasive Species: None as of 2011Table 2. Availability of primary data types for <strong>Stony</strong> Lake.Data AvailabilityPhysical CharacteristicsSurface area (acres): 571Littoral area (acres): 178% Littoral area: 31%Max depth (ft), (m): 50, 15.2Inlets: 0Outlets: 1Public Accesses: 1Transparency data Excellent data set from 1997-2011.Chemical dataGood data set, but not enough for trend analysis.Inlet/Outlet data -- Not necessary since there are no inlets.Recommendations For recommendations refer to page 20.RMB Environmental Laboratories, Inc. 1 of 22 2012 <strong>Stony</strong> Lake
Lake MapFigure 1. Map of <strong>Stony</strong> Lake with 2010 aerial imagery and illustrations of lake depth contour lines, samplesite locations, inlets and outlets, and public access points. The light green areas in the lake illustrate thelittoral zone, where the sunlight can usually reach the lake bottom allowing aquatic plants to grow.Table 3. Monitoring programs and associated monitoring sites. Monitoring programs include the LakeMonitoring Program (LMP), Citizen Lake Monitoring Program (CLMP), <strong>Cass</strong> <strong>County</strong> Citizens Lake andStream Monitoring (CCCL), Outdoor Corps Lake Monitoring (OCLM), Whitefish Chain and SurroundingLakes WAPOA (WCSL) and RMB Environmental Laboratories Lakes Program (RMBEL).Lake Site Depth (ft) Monitoring Programs201* Primary site 50 CLMP: 1994, 1997-2011; CCCL: 2008-2009; OCLM: 2003-2006;RMBEL: 2007, 2010-2011; WCSL: 2001-2002101 50 LMP: 2001RMB Environmental Laboratories, Inc. 2 of 22 2012 <strong>Stony</strong> Lake
Water Quality Characteristics - Historical Means and RangesTable 5. Water quality means and ranges for primary sites.PrimaryParametersSite201 101Total Phosphorus Mean (ug/L): 12 9Total Phosphorus Min: 6 4Total Phosphorus Max: 27 13Number of Observations: 33 4Chlorophyll a Mean (ug/L): 3 3Chlorophyll-a Min: 1 2Chlorophyll-a Max: 10 4Number of Observations: 33 4Secchi Depth Mean (ft): 21Secchi Depth Min: 8Secchi Depth Max: 35Number of Observations: 354Figure 2. <strong>Stony</strong> Lake total phosphorus, chlorophyll a and transparency historical ranges. The arrowrepresents the range and the black dot represents the historical mean (Primary Site 201). Figure adaptedafter Moore and Thornton, [Ed.]. 1988. Lake and Reservoir Restoration Guidance Manual. (Doc. No. EPA 440/5-88-002)RMB Environmental Laboratories, Inc. 4 of 22 2012 <strong>Stony</strong> Lake
Transparency (Secchi Depth)Transparency is how easily light can pass through a substance. In lakes it is how deep sunlightpenetrates through the water. Plants and algae need sunlight to grow, so they are only able togrow in areas of lakes where the sun penetrates. Water transparency depends on the amount ofparticles in the water. An increase in particulates results in a decrease in transparency. Thetransparency varies year to year due to changes in weather, precipitation, lake use, flooding,temperature, lake levels, etc.The annual mean transparency in <strong>Stony</strong> Lake ranges from 18.5 to 23.6 feet. The transparencyhovers very closely to the long-term mean, without much change from year to year (Figure 3).Transparency monitoring should be continued annually at site 201 in order to track water qualitychanges.25Transparency: Annual MeansSecchi Depth (ft)2015105Site 201Mean, Site 2010Figure 3. Annual mean transparency compared to long-term mean transparency.<strong>Stony</strong> Lake transparency ranges from 8 to 35 ft at the primary site (201). Figure 4 shows theseasonal transparency dynamics. The maximum Secchi reading is usually obtained in earlysummer. The transparency doesn’t change much over the season, which is typical for a lake withlow nutrients and good clarity. The dynamics have to do with algae and zooplankton populationdynamics, and lake turnover.It is important for lake residents to understand the seasonal transparency dynamics in their lake sothat they are not worried about why their transparency is lower in August than it is in June. It istypical for a lake to vary in transparency throughout the summer.RMB Environmental Laboratories, Inc. 5 of 22 2012 <strong>Stony</strong> Lake
Secchi Depth (ft)4035302520151050Seasonal Transparency Dynamics 1994199720001999200020012002200320042005200620072008200920102011Poly. (Pattern)Figure 4. Seasonal transparency dynamics and year to year comparison (Primary Site 201). The black linerepresents the pattern in the data.User PerceptionsWhen volunteers collect secchi depth readings, they record their perceptions of the water based onthe physical appearance and the recreational suitability. These perceptions can be compared towater quality parameters to see how the lake "user" would experience the lake at that time.Looking at transparency data, as the secchi depth decreases the perception of the lake's physicalappearance rating decreases. <strong>Stony</strong> Lake was rated as being "crystal clear" 88% of the time bysamplers in 1994, 1997-2011 (Figure 5).12%Physical Appearance Rating88% Crystal clear water12% Not quite crystal clear – a little algae visible0% Definite algae – green, yellow, or brown colorapparent0% High algae levels with limited clarity and/or mildodor apparent0% Severely high algae levels88%Figure 5. <strong>Stony</strong> Lake physical appearance ratings by samplers at site 201.RMB Environmental Laboratories, Inc. 6 of 22 2012 <strong>Stony</strong> Lake
As the secchi depth decreases, the perception of recreational suitability of the lake decreases.<strong>Stony</strong> Lake was rated as being "beautiful" 91% of the time in 1994, 1997-2011 (Figure 6).9%Recreational Suitability Rating91% Beautiful, could not be better9% Very minor aesthetic problems; excellent forswimming, boating0% Swimming and aesthetic enjoyment of the lakeslightly impaired because of algae levels0% Desire to swim and level of enjoyment of the lakesubstantially reduced because of algae levels91%0% Swimming and aesthetic enjoyment of the lakenearly impossible because of algae levelsFigure 6. Recreational suitability rating, as rated by the volunteer monitor at site 201.Total PhosphorusLake <strong>Stony</strong> isphosphorus limited,which means thatalgae and aquaticplant growth isdependent uponavailablephosphorus.Total phosphoruswas evaluated in<strong>Stony</strong> Lake in 2001,-2004 and 2006-2011.The higherphosphorusconcentrations inspring and fall couldbe due to laketurnover. Themajority of the datapoints fall into theoligotrophic range(Figure 7).Total Phosphorus (ug/L)Total Phosphorus30EutrophicSite 101, 200125Site 201, 2004Mesotrophic20Site 201, 2006Site 201, 200715Site 201, 200810Site 201, 20095Site 201, 20100OligotrophicSite 201, 2011Figure 7. Historical total phosphorus concentrations (ug/L) for <strong>Stony</strong> Lake.Phosphorus should continue to be monitored to track any future changes in water quality.RMB Environmental Laboratories, Inc. 7 of 22 2012 <strong>Stony</strong> Lake
Chlorophyll aChlorophyll a is theChlorophyll a Site 101, 2001pigment that makesplants and algae12Site 201, 2004green. Chlorophyll a isSite 201, 2006tested in lakes to deter 10mine the algaeSite 201, 2007concentration or how 8"green" the water is.Site 201, 20086Site 201, 2009Chlorophyll aconcentrations greater 4Site 201, 2010than 10 ug/L are2Site 201, 2011perceived as a mildalgae bloom, whileMinor Algae0concentrations greaterthan 20 ug/L areperceived as anuisance.Figure 8. Chlorophyll a concentrations (ug/L) for <strong>Stony</strong> Lake.Chlorophyll a wasevaluated in <strong>Stony</strong> Lakein 2001, 2004 and 2006-2011 (Figure 8). Chlorophyll a concentrations remained well below 10ug/L on all sample dates except for one, indicating clear water most of the summer. There was notmuch variation over the years monitored and chlorophyll a concentrations remained relativelysteady over the summer.Dissolved OxygenChlorophyll a (ug/L)Depth (m)Dissolved Oxygen (mg/L)0 2 4 6 8 10 1201234567Dissolved Oxygen (DO) is the amount of oxygen dissolved in lakewater. Oxygen is necessary for all living organisms to surviveexcept for some bacteria. Living organisms breathe in oxygenthat is dissolved in the water. Dissolved oxygen levels of
Trophic State IndexPhosphorus (nutrients), chlorophyll a (algaeconcentration) and Secchi depth (transparency) arerelated. As phosphorus increases, there is more foodavailable for algae, resulting in increased algalconcentrations. When algal concentrations increase, thewater becomes less transparent and the Secchi depthdecreases.The results from these three measurements coverdifferent units and ranges and thus cannot be directlycompared to each other or averaged. In order tostandardize these three measurements to make themdirectly comparable, we convert them to a trophic stateindex (TSI).The mean TSI for <strong>Stony</strong> Lake falls onto theoligotrophic/mesotrophic border (Figure 10). There isgood agreement between the TSI for phosphorus andchlorophyll a, indicating that these variables are stronglyrelated (Table 6). The Secchi TSI is lowerthan the other two parameters, which<strong>Stony</strong> Lakecould be due to zooplankton grazersselectively eliminating the smaller algalcells or larger particulates dominating the algalcommunity.Table 6. Trophic State Index for site 201.Trophic State Index Site 201TSI Total Phosphorus 40TSI Chlorophyll-a 41TSI Secchi 34TSI Mean 38Oligotrophic/Trophic State:MesotrophicNumbers represent the mean TSI for eachparameter.100HypereutrophicEutrophicMesotrophicOligotrophic705040Lakes on the oligotrophic/mesotrophic border (TSI 39-41) are characteristic of clear water throughout thesummer and are excellent for recreation. The bottom ofthe deep areas of the lake becomes anoxic (no oxygen)during the summer, which is inhospitable to game fish.This occurrence is common in <strong>Minnesota</strong> lakes.Figure 10. Trophic state index chart withcorresponding trophic status.0Table 7. Trophic state index attributes and their corresponding fisheries and recreation characteristics.TSI Attributes Fisheries & Recreation80 Algal scums, few aquatic plants Rough fish (carp) dominate; summer fish killspossibleSource: Carlson, R.E. 1997. A trophic state index for lakes. Limnology and Oceanography. 22:361-369.RMB Environmental Laboratories, Inc. 9 of 22 2012 <strong>Stony</strong> Lake
Trend AnalysisFor detecting trends, a minimum of 8-10 years of data with 4 or more readings per season arerecommended. Minimum confidence accepted by the MPCA is 90%. This means that there is a90% chance that the data are showing a true trend and a 10% chance that the trend is a randomresult of the data. Only short-term trends can be determined with just a few years of data, becausethere can be different wet years and dry years, water levels, weather, etc, that affect the waterquality naturally.There is not enough historical data to perform trend analysis for total phosphorus or chlorophyll aon <strong>Stony</strong> Lake. Site 201 had over 8 years of transparency data, which was enough data toperform a long-term trend analysis (Table 8). The data was analyzed using the Mann KendallTrend Analysis.Table 8. Trend analysis for <strong>Stony</strong> Lake.Lake Site Parameter Date Range Trend Probability201 Total Phosphorus 2004, 2006-2011 Insufficient data --201 Chlorophyll a 1998-2011 Insufficient data --201 Transparency 1997-2011 Declining 99%Transparency Trend for <strong>Stony</strong> Lake403530Secchi Depth (ft)2520151050Figure 11. Transparency (ft) trend for site 201 from 1994, 1997-2011.<strong>Stony</strong> Lake shows a significant declining trend in transparency from 1997-2011 (Figure 11). Overthis time the transparency has declined very slightly overall. Transparency monitoring shouldcontinue so that this trend can be tracked in future years.RMB Environmental Laboratories, Inc. 10 of 22 2012 <strong>Stony</strong> Lake
Ecoregion Comparisons<strong>Minnesota</strong> is divided into 7 ecoregions based on landuse, vegetation, precipitation and geology. TheMPCA has developed a way to determine the"average range" of water quality expected for lakes ineach ecoregion. From 1985-1988, the MPCAevaluated the lake water quality for reference lakes.These reference lakes are not considered pristine,but are considered to have little human impact andtherefore are representative of the typical lakes withinthe ecoregion. The "average range" refers to the 25 th- 75 th percentile range for data within each ecoregion.For the purpose of this graphical representation, themeans of the reference lake data sets were used.<strong>Stony</strong> Lake is in the NorthernLakes and ForestsEcoregion (Figure 12). Themean total phosphorus,chlorophyll a andtransparency (secchi depth)for <strong>Stony</strong> are better than theecoregion ranges (Figure13).Figure 12. <strong>Minnesota</strong> Ecoregions.6030050255Total Phosphorus (ug/L, ppb)40302010Chlorophyll-a (ug/L, ppb)2015105Secchi depth (ft)101520253035increasedalgaecrystalclear0NLFEcoregion<strong>Stony</strong>0NLFEcoregion<strong>Stony</strong>40NLFEcoregion<strong>Stony</strong>Figures 13a-c. <strong>Stony</strong> Lake ranges compared to Northern Lakes and Forest Ecoregion ranges. The <strong>Stony</strong>Lake total phosphorus and chlorophyll a ranges are from 33 data points collected in May-September of 2006-2011. The <strong>Stony</strong> Lake Secchi depth range is from 354 data points collected in May-September from 1994-2011.RMB Environmental Laboratories, Inc. 11 of 22 2012 <strong>Stony</strong> Lake
Lakeshed Data and InterpretationsLakeshedUnderstanding a lakeshed requires an understanding of basic hydrology. A watershed is definedas all land and water surface area that contribute excess water to a defined point. The MN DNRhas delineated three basic scales of watersheds (from large to small): 1) basins, 2) majorwatersheds, and 3) minor watersheds.The Leech Lake Major Watershed is one of the watersheds that make up the Upper MississippiRiver Basin, which drains south to the Gulf of Mexico (Figure 14). This major watershed is madeup of 75 minor watersheds. <strong>Stony</strong> Lake is located in minor watershed 8063 (Figure 15).Figure 14. Leech Lake River Major Watershed. Figure 15. Minor Watershed 8063The MN DNR also hasevaluated catchmentsfor each individual lakewith greater than 100acres surface area.These lakesheds(catchments) are the“building blocks” for thelarger scalewatersheds. <strong>Stony</strong>Lake falls withinlakeshed 0806301(Figure 16). Thoughvery useful fordisplaying the land andwater that contributedirectly to a lake,lakesheds are notalways true watershedsbecause they may notshow the water flowinginto a lake fromupstream streams orrivers. While somelakes may have onlyFigure 16. <strong>Stony</strong> Lake lakeshed (0806301) with land ownership, lakes,wetlands, and rivers illustrated.RMB Environmental Laboratories, Inc. 12 of 22 2012 <strong>Stony</strong> Lake
one or two upstream lakesheds draining into them, others may be connected to a large number oflakesheds, reflecting a larger drainage area via stream or river networks. For further discussion of<strong>Stony</strong> Lake’s full watershed, containing all the lakesheds upstream of the <strong>Stony</strong> Lake lakeshed,see page 17. The data interpretation of the <strong>Stony</strong> Lake lakeshed includes only the immediatelakeshed as this area is the land surface that flows directly into <strong>Stony</strong> Lake.The lakeshed vitals table identifies where to focus organizational and management efforts for eachlake (Table 9). Criteria were developed using limnological concepts to determine the effect to lakewater quality.KEYPossibly detrimental to the lakeWarrants attentionBeneficial to the lakeTable 9. <strong>Stony</strong> Lake lakeshed vitals table.Lakeshed VitalsRatingLake Area 571 acres descriptiveLittoral Zone Area 178 acres descriptiveLake Max Depth 50 ft. descriptiveLake Mean Depth NA NAWater Residence Time NA. NAMiles of Stream 0 descriptiveInlets 0Outlets 1Major Watershed 8 – Leech Lake River descriptiveMinor Watershed 8063 descriptiveLakeshed 806301 descriptiveEcoregion Northern Lakes and Forests descriptiveTotal Lakeshed to Lake Area Ratio (totallakeshed includes lake area)4:1Standard Watershed to Lake Basin Ratio(standard watershed includes lake areas)4:1Wetland Coverage 10.7%Aquatic Invasive Species None as of 2011Public Drainage DitchesNonePublic Lake Accesses 1Miles of Shoreline 7.12 descriptiveShoreline Development Index 2.1Public Land to Private Land Ratio 0.7:1Development ClassificationRecreational DevelopmentMiles of Road 5.66 descriptiveMunicipalities in lakeshedNoneForestry PracticesSome in northern lakeshed, managed by the<strong>Cass</strong> <strong>County</strong> Forest Plan, 2010-2019FeedlotsNoneSewage ManagementIndividual Waste Treatment Systems, nolake-wide inspection completedLake Management PlanNoneLake Vegetation Survey/PlanNoneRMB Environmental Laboratories, Inc. 13 of 22 2012 <strong>Stony</strong> Lake
Land Cover / Land UseThe activities that occur onthe land within thelakeshed can greatlyimpact a lake. Land useplanning helps ensure theuse of land resources in anorganized fashion so thatthe needs of the presentand future generations canbe best addressed. Thebasic purpose of land useplanning is to ensure thateach area of land will beused in a manner thatprovides maximum socialbenefits withoutdegradation of the landresource.Changes in land use, andultimately land cover,impact the hydrology of alakeshed. Land cover isalso directly related to theland’s ability to absorb andstore water rather thancause it to flow overland(gathering nutrients andsediment as it moves)towards the lowest point, Figure 17. <strong>Stony</strong> Lake lakeshed (0806301) land cover (http://land.umn.edu).typically the lake.Impervious intensity describes the land’s inability to absorb water, the higher the % imperviousintensity the more area that water cannot penetrate in to the soils. Monitoring the changes in landuse can assist in future planning procedures to address the needs of future generations.Phosphorus export, which is the main cause of lake eutrophication, depends on the type of landcover occurring in the lakeshed. Figure 17 depicts the land cover in <strong>Stony</strong> Lake’s lakeshed.The University of <strong>Minnesota</strong> has online records of land cover statistics from years 1990 and 2000(http://land.umn.edu). Although this data is 11 years old, it is the only data set that is comparableover a decade’s time. Table 10 describes <strong>Stony</strong> Lake’s lakeshed land cover statistics and percentchange from 1990 to 2000. Due to the many factors that influence demographics, one cannotdetermine with certainty the projected statistics over the next 10, 20, 30+ years, but one can seethe transition within the lakeshed from agriculture, grass/shrub/wetland, and water acreages toforest and urban acreages. The largest change in percentage for <strong>Stony</strong> Lake is the increase ingrass/shrub/wetland cover (157%).RMB Environmental Laboratories, Inc. 14 of 22 2012 <strong>Stony</strong> Lake
Table 10. <strong>Stony</strong> Lake’s lakeshed land cover statistics and % change from 1990 to 2000(http://land.umn.edu).1990 2000 % ChangeLand Cover Acres Percent Acres Percent 1990 to 2000Agriculture 103 4.16 83 3.35 19.4% DecreaseForest 1420 57.35 1,045 42.21 26.4% DecreaseGrass/Shrub/Wetland 276 11.15 710 28.68 157.2% IncreaseWater 594 23.99 550 22.21 7.4% DecreaseUrban 85 3.43 88 3.55 3.5% IncreaseImpervious Intensity %0 2,427 97.98 2,401 96.93 1.1% Decrease1-10 21 0.82 19 0.77 9.5% Decrease11-25 17 0.69 32 1.29 88.2% Increase26-40 4 0.16 18 0.73 350% Increase41-60 4 0.16 7 0.28 75% Increase61-80 5 0.2 0 0 100% Decrease81-100 0 0 0 0Total Area 2,476 2,476Total Impervious Area(Percent Impervious AreaExcludes Water Area)10 0.53 16 0.83 60% IncreaseDemographics<strong>Stony</strong> Lake is classified as a recreational development lake. Recreational development lakesusually have between 60 and 225 acres of water per mile of shoreline, between 3 and 25 dwellingsper mile of shoreline, and are more than 15 feet deep.The <strong>Minnesota</strong> Department of Administration Geographic and Demographic Analysis Divisionextrapolated future population in 5-year increments out to 2035. Compared to <strong>Cass</strong> <strong>County</strong> as awhole, Birch Lake Township has the same growth projection (Figure 18).(source:http://www.demography.state.mn.us/resource.html?Id=19332)Figure 18.Population growthprojection for BirchLake Township, and<strong>Cass</strong> <strong>County</strong>.Percentage of 2006 Population50%40%30%20%10%0%Population Growth ProjectionBirch Lake Township; 2006 population: 576<strong>Cass</strong> <strong>County</strong>; 2006 population: 28,9492006 2010 2015 2020 2025 2030 2035ExtrapolationRMB Environmental Laboratories, Inc. 15 of 22 2012 <strong>Stony</strong> Lake
<strong>Stony</strong> Lake Lakeshed Water Quality Protection StrategyEach lakeshed has a different makeup of public and private lands. Looking in more detail at themakeup of these lands can give insight on where to focus protection efforts. The protected lands(easements, wetlands, public land) are the future water quality infrastructure for the lake.Developed land and agriculture have the highest phosphorus runoff coefficients, so this landshould be minimized for water quality protection.The majority of the land within <strong>Stony</strong> Lake’s lakeshed is privately owned forested uplands (Table11). This land can be the focus of development and protection efforts in the lakeshed.Table 11. Land ownership, land use/land cover, estimated phosphorus loading, and ideas for protection andrestoration in <strong>Stony</strong> lakeshed (Sources: <strong>Cass</strong> <strong>County</strong> parcel data, National Wetlands Inventory, and the 2006National Land Cover Dataset).Private (44%) 24% Public (32%)DevelopedAgricultureForestedUplands Other WetlandsOpenWater <strong>County</strong> State FederalLand Use (%) 1.3 3.0 34.8 4.9 3.6 24 4.9 11.8 15.3RunoffCoefficientLbs ofphosphorus/acre/yearEstimatedPhosphorusLoadingAcreage x runoffcoefficientDescription0.45–1.5 0.26–0.9 0.09 0.09 0.09 0.09 0.0914–48 19–66 78 8 11 26 34Focused onShorelandCroplandFocus ofdevelopmentandprotectioneffortsOpen,pasture,grassland,shrublandProtectedPotentialPhase 3DiscussionItemsShorelinerestorationRestorewetlands;CRPForeststewardshipplanning, 3 rdpartycertification,SFIA, localwoodlandcooperativesProtected byWetlandConservationAct<strong>County</strong>Tax ForfeitLandsStateForestNationalForestDNR Fisheries approach for lake protection and restorationCredit: Peter Jacobson and Michael Duval, <strong>Minnesota</strong> DNR FisheriesIn an effort to prioritize protection and restoration efforts of fishery lakes, the MN DNR hasdeveloped a ranking system by separating lakes into two categories, those needing protection andthose needing restoration. Modeling by the DNR Fisheries Research Unit suggests that totalphosphorus concentrations increase significantly over natural concentrations in lakes that havewatershed with disturbance greater than 25%. Therefore, lakes with watersheds that have lessthan 25% disturbance need protection and lakes with more than 25% disturbance need restoration(Table 12). Watershed disturbance was defined as having urban, agricultural and mining landuses. Watershed protection is defined as publicly owned land or conservation easement.RMB Environmental Laboratories, Inc. 16 of 22 2012 <strong>Stony</strong> Lake
Table 12. Suggested approaches for watershed protection and restoration of DNR-managed fish lakes in<strong>Minnesota</strong>.WatershedDisturbance(%)WatershedProtected(%)ManagementTypeComments< 25%> 75% Vigilance< 75% ProtectionSufficiently protected -- Water quality supports healthy anddiverse native fish communities. Keep public lands protected.Excellent candidates for protection -- Water quality can bemaintained in a range that supports healthy and diverse nativefish communities. Disturbed lands should be limited to less than25%.25-60% n/a Full Restoration> 60% n/a Partial RestorationRealistic chance for full restoration of water quality and improvequality of fish communities. Disturbed land percentage shouldbe reduced and BMPs implemented.Restoration will be very expensive and probably will not achievewater quality conditions necessary to sustain healthy fishcommunities. Restoration opportunities must be criticallyevaluated to assure feasible positive outcomes.The next step was to prioritize lakes within each of these management categories. DNR Fisheriesidentified high value fishery lakes, such as cisco refuge lakes. Ciscos (Coregonus artedi) can be anearly indicator of eutrophication in a lake because they require cold hypolimnetic temperatures andhigh dissolved oxygen levels. These watersheds with low disturbance and high value fishery lakesare excellent candidates for priority protection measures, especially those that are related toforestry and minimizing the effects of landscape disturbance. Forest stewardship planning, harvestcoordination to reduce hydrology impacts and forest conservation easements are some potentialtools that can protect these high value resources for the long term.<strong>Stony</strong> Lake’s lakeshed is classified with having 50.7% of the watershed protected and 5.8% of thewatershed disturbed (Figure 19). Therefore, this lakeshed should have a protection focus. Goalsfor the lakeshed should be to limit any increase in disturbed land use. Figure 20 displays theupstream lakesheds that contribute water to the lakeshed of interest. All of the land and waterarea in this figure has the potential to contribute water to <strong>Stony</strong> Lake, whether through directoverland flow or through a creek or river. This is a headwaters catchment, which means noadditional lakesheds contribute water to this area.Percent of the Watershed Protected0% 75%100%<strong>Stony</strong> Lake(50.7%)Percent of the Watershed with Disturbed Land Cover0% 25%100%<strong>Stony</strong> Lake(5.8%)Figure 19. <strong>Stony</strong> Lake’s lakeshed percentage ofwatershed protected and disturbed.Figure 20. Upstream lakesheds that contribute waterto the <strong>Stony</strong> lakeshed. Color-coded based onmanagement focus (table 12).RMB Environmental Laboratories, Inc. 17 of 22 2012 <strong>Stony</strong> Lake
Conservation Easement PotentialIn an ever-growing society, today’s landscapes are being urbanized more and more to sustain theever-growing population and behavior of recreational usage. In <strong>Minnesota</strong>, the land of tenthousand lakes, it is only natural to develop properties within the boundaries and beauty of ourlakes and streams. Conservation efforts to limit or slow down the development process can onlyassist in the preservation of the lakeshed and inevitably the water quality of water bodies foundwithin. Figure 21 identifies parcels within the lakeshed that are large enough to warrant theinvestigation of parcel conservation practices and purchase.Figure 21. Lake parcels with conservation potential (developed by John Snyder, LLAWF).RMB Environmental Laboratories, Inc. 18 of 22 2012 <strong>Stony</strong> Lake
Status of the Fishery (DNR, as of 07/14/2008)<strong>Stony</strong> Lake is a 595-acre lake located northeast of Hackensack, <strong>Minnesota</strong> that has 7.12 miles ofshoreline and a maximum depth of 50 ft. There is a public access owned by the <strong>Minnesota</strong>Department of Natural Resources (MNDNR) on the south shore of the lake. The MNDNR hasclassified <strong>Minnesota</strong> lakes into 43 different classes based on physical, chemical and othercharacteristics. <strong>Stony</strong> Lake is in Lake Class 23; other nearby lakes in this class include Baby andPonto Lakes. Lakes in this class tend to be very deep and have a very low percentage of area lessthan 15 ft deep. These lakes also tend to have hard water and be very clear.<strong>Stony</strong> Lake has a good population of walleye. The walleye catch in 2008 in MNDNR experimentalgillnets (10.5/net) was similar to that found during the three previous assessments and was greaterthan the catch found in most lakes of this class. Sampled walleye had an average length of 15.3inches and an average weight of 1.19 lbs. Walleye up to 26.5 inches were found. <strong>Stony</strong> Lake has ahistory of good walleye natural reproduction. In 2008, all of the first seven year classes werepresent in the gill net sample. During the past two assessments, several abundant year classes ineach assessment were products of natural reproduction.<strong>Stony</strong> Lake supports an abundant population of largemouth bass, and fish up to 18 inches weretaken in the 2008 netting and electrofishing sample. <strong>Stony</strong> Lake has a 12- to 20-inch protected slotlimit in effect for largemouth bass that requires release of all largemouth bass 12 inches or larger,except that one over 20 inches is allowed in possession. This regulation, which was implementedMarch 1, 2004, is intended to increase the average size of largemouth bass and to maintain a goodpopulation of this species. In 2008, smallmouth bass were reported on <strong>Stony</strong> Lake for the first time.Smallmouth up to 15.7 inches were collected. This species was apparently introduced through anun-permitted private stocking.Northern pike were abundant in <strong>Stony</strong> Lake compared to other lakes in Lake Class 23, with a gillnet catch of 10.00/net. Sampled northern pike had an average length and weight of 19.5 inchesand 1.57 lbs, and fish up to 31.5 inches were found. Abundance of bluegill was similar that found inother Lake Class 23 waters (9.00/net), however, this was lower than in most previous assessmentson <strong>Stony</strong> Lake. Average length of bluegill was 4.7 inches, and lengths ranged from 3.0 to 8.3inches. The catch of black crappie in experimental gill nets (1.63/net) compared favorably withother lakes in this class, and was greater than catch rates in previous assessments. Average sizeof black crappie was 8.5 inches and fish ranged from 5.5 to 11.5 inches. Yellow perch abundancewas similar to other lakes of this type. Average length of <strong>Stony</strong> Lake yellow perch sampled in 2008was 7.2 inches, and lengths ranged from 4.9 to 12.7 inches. Other species available for anglersinclude black bullhead, pumpkinseed sunfish, rock bass, white sucker, and yellow bullhead.Anglers can help maintain or improve the quality of fishing by practicing selective harvest.Selective harvest allows for the harvest of smaller fish for table fare, but encourages release ofmedium- to large-sized fish. Releasing these fish can help maintain balance in the fish communityin <strong>Stony</strong> Lake and provide anglers the opportunity to catch more and larger fish in the future.Shoreline habitat consists of aquatic plants, woody plants and natural lake bottom soils. Plants inthe water and at the waters edge provide habitat, prevent erosion and absorb excess nutrients.Shrubs, trees, and woody debris such as fallen trees or limbs provide good habitat both above andbelow the water and should be left in place. By leaving a buffer strip of natural vegetation along theshoreline, property owners can reduce erosion, help maintain water quality, and provide habitatand travel corridors for wildlife.See the link below for specific information on gillnet surveys, stocking information, and fishconsumption guidelines. http://www.dnr.state.mn.us/lakefind/showreport.html?downum=11037100RMB Environmental Laboratories, Inc. 19 of 22 2012 <strong>Stony</strong> Lake
Key Findings / RecommendationsMonitoring RecommendationsTransparency monitoring at site 201 should be continued annually. It is important to continuetransparency monitoring weekly or at least bimonthly every year to enable year-to-yearcomparisons and trend analyses. Total Phosphorus and chlorophyll a monitoring should continue,as the budget allows, to track trends in water quality.Overall Conclusions<strong>Stony</strong> Lake is in good shape for water quality and lakeshed protection. It is on theoligotrophic/mesotrophic border for trophic state (TSI=38). Thirty-two percent (32%) of thelakeshed is in public ownership, and 50% of the watershed is protected, while only 6% of thewatershed is disturbed (Figure 19).<strong>Stony</strong> Lake is at an advantage in that it is a headwaters catchment. This means no other lakes orlakesheds flow into it, and the land practices around the lake are the main impact to the lake.<strong>Stony</strong> Lake has a declining trend in clarity from 1997-2011. Because it doesn’t have any inlets, thelake could be subject to swings in water levels. Current data show that <strong>Stony</strong> Lake’s water levelshave decreased since 2003 (Figure 21). In addition, the wetland coverage around the perimeter ofthe lake has increased by over 400 acres from 1990-2000 (Table 10). The decreasing lake levelcould be why there are more wetlands around the perimeter of the lake. It is unclear if thisdynamic is related to the declining water clarity. Usually an increase in water levels correspondswith a decrease in water clarity due to increased shoreline erosion.Figure 21. Water levels for <strong>Stony</strong> Lake, MN DNR.Priority Impacts to the Lake<strong>Stony</strong> Lake is mostly developed in the first tier (Figure 16). From 1990-2000, there was essentiallyno change in urban or impervious surface around the lake (Table 10). If the first and second tierwere to experience more development pressure, it could change the drainage around the lake.RMB Environmental Laboratories, Inc. 20 of 22 2012 <strong>Stony</strong> Lake
Best Management Practices RecommendationsThe management focus for <strong>Stony</strong> Lake should be to protect the current water quality and thelakeshed. Efforts should be focused on managing and/or decreasing the impact caused byadditional development, including second tier development, and impervious surface area. Projectideas include protecting land with conservation easements, enforcing county shoreline ordinances,smart development, shoreline restoration, rain gardens, and septic system maintenance.Because <strong>Stony</strong> Lake has no inlets, and the land practices around the shoreline are the mainimpact to the lake, it would be useful to do a lake-wide septic system check. This would determineif improperly maintained septic systems are contributing to the decline in water transparency.In addition, a shoreline inventory could show if unnatural shorelines are contributing to the declinein water transparency. If so, a push for shoreline restoration and rain gardens could be made toshoreline property owners.There are some large parcels of land that could be protected with conservation easements. SeeFigure 21 for the location of these parcels.Project ImplementationThe best management practices above can be implemented by a variety of entities. Somepossibilities are listed below.Individual property owners Shoreline restoration Rain gardens Aquatic plant bed protection (only remove a small area for swimming) Conservation easementsLake Associations Lake condition monitoring Ground truthing – visual inspection upstream on stream inlets Watershed mapping by a consultant Shoreline inventory study by a consultant Conservation easementsSoil and Water Conservation District (SWCD) and Natural Resources Conservation Service(NRCS) Shoreline restoration Stream buffers Wetland restorationRMB Environmental Laboratories, Inc. 21 of 22 2012 <strong>Stony</strong> Lake
Organizational contacts and reference sites<strong>Stony</strong> Lake Association<strong>Cass</strong> <strong>County</strong> Soil and WaterConservation DistrictDNR Fisheries OfficeRegional <strong>Minnesota</strong> PollutionControl Agency Officehttp://www.minnesotawaters.org/group/stony/welcomeCourthouse, 1st Floor, 303 <strong>Minnesota</strong> Avenue W, PO Box 3000,Walker, MN, 56484-3000218-547-7399http://www.co.cass.mn.us/soil_conservation/soil_water.html07316 State 371 Northwest, Walker, MN, 56484218-547-1683walker.fisheries@state.mn.us7678 College Road, Suite 105, Baxter, MN 56425218-828-2492, 1-800-657-3864http://www.pca.state.mn.us/pyri3dfRMB Environmental Laboratories, Inc. 22 of 22 2012 <strong>Stony</strong> Lake