Oxygen sensor monitoring a deterioration of a three-way ... - UMEL
Oxygen sensor monitoring a deterioration of a three-way ... - UMEL
Oxygen sensor monitoring a deterioration of a three-way ... - UMEL

Create successful ePaper yourself
Turn your PDF publications into a flip-book with our unique Google optimized e-Paper software.
2 K. Moriya, T. Sako / Sensors and Actuators B 3646 (2000) 1–10<br />
this problem manifested itself as an irregular engine operating<br />
condition, it could be solved simply by misfire-preventive<br />
measures. The second was the detrimental degradation<br />
<strong>of</strong> the oxygen <strong>sensor</strong>s. The degraded <strong>sensor</strong>s did not generate<br />
an output, thus, disabling proper control. The third was<br />
due to the discrepancy between the equivalence ratio that<br />
was feedback-controlled by the main <strong>sensor</strong> signal and that<br />
<strong>of</strong> the real catalyst window. This discrepancy reduced the<br />
emission control efficiency. In this paper, the causes <strong>of</strong><br />
degradation in <strong>three</strong>-<strong>way</strong> catalyst performance resulting<br />
from the oxygen <strong>sensor</strong> problems were determined, and<br />
the characteristics that the subsidiary oxygen <strong>sensor</strong> must<br />
provide in order to ensure long and stable performance <strong>of</strong> the<br />
<strong>three</strong>-<strong>way</strong> catalyst systems were identified.<br />
2. Experimental<br />
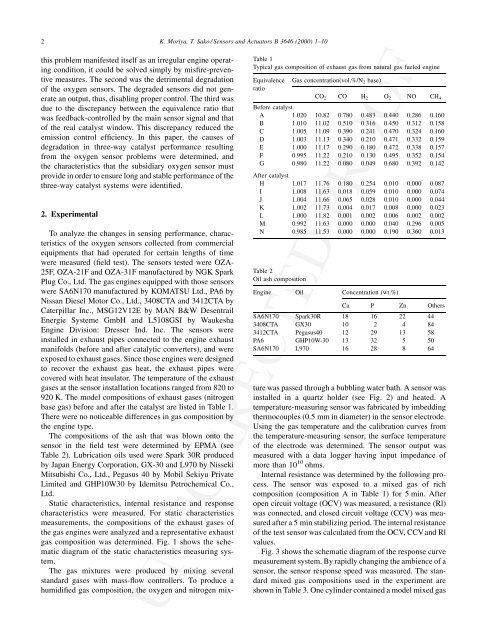
Table 1<br />
Typical gas composition <strong>of</strong> exhaust gas from natural gas fueled engine<br />
Equivalence Gas concentration(vol.%/N 2 base)<br />
ratio<br />
CO 2 CO H 2 O 2 NO CH 4<br />
Before catalyst<br />
A 1.020 10.82 0.780 0.483 0.440 0.286 0.160<br />
B 1.010 11.02 0.510 0.316 0.450 0.312 0.158<br />
C 1.005 11.09 0.390 0.241 0.470 0.324 0.160<br />
D 1.003 11.13 0.340 0.210 0.471 0.332 0.159<br />
E 1.000 11.17 0.290 0.180 0.472 0.338 0.157<br />
F 0.995 11.22 0.210 0.130 0.495 0.352 0.154<br />
G 0.980 11.22 0.080 0.049 0.680 0.392 0.142<br />
After catalyst<br />
H 1.017 11.76 0.180 0.254 0.010 0.000 0.087<br />
I 1.008 11.63 0.018 0.059 0.010 0.000 0.074<br />
J 1.004 11.66 0.065 0.028 0.010 0.000 0.044<br />
K 1.002 11.73 0.004 0.017 0.008 0.000 0.023<br />
L 1.000 11.82 0.001 0.002 0.006 0.002 0.002<br />
M 0.992 11.63 0.000 0.000 0.040 0.296 0.005<br />
N 0.985 11.53 0.000 0.000 0.190 0.360 0.013<br />
Table 2<br />
Oil ash composition<br />
Engine Oil Concentration (wt.%)<br />
Ca P Zn Others<br />
SA6N170 Spark30R 18 16 22 44<br />
3408CTA GX30 10 2 4 84<br />
3412CTA Pegasus40 12 29 13 58<br />
PA6 GHP10W-30 13 32 5 50<br />
SA6N170 L970 16 28 8 64<br />
To analyze the changes in sensing performance, characteristics<br />
<strong>of</strong> the oxygen <strong>sensor</strong>s collected from commercial<br />
equipments that had operated for certain lengths <strong>of</strong> time<br />
were measured (field test). The <strong>sensor</strong>s tested were OZA-<br />
25F, OZA-21F and OZA-31F manufactured by NGK Spark<br />
Plug Co., Ltd. The gas engines equipped with those <strong>sensor</strong>s<br />
were SA6N170 manufactured by KOMATSU Ltd., PA6 by<br />
Nissan Diesel Motor Co., Ltd., 3408CTA and 3412CTA by<br />
Caterpillar Inc., MSG12V12E by MAN B&W Desentrail<br />
Energie Systeme GmbH and L5108GSI by Waukesha<br />
Engine Division: Dresser Ind. Inc. The <strong>sensor</strong>s were<br />
installed in exhaust pipes connected to the engine exhaust<br />
manifolds (before and after catalytic converters), and were<br />
exposed to exhaust gases. Since those engines were designed<br />
to recover the exhaust gas heat, the exhaust pipes were<br />
covered with heat insulator. The temperature <strong>of</strong> the exhaust<br />
gases at the <strong>sensor</strong> installation locations ranged from 820 to<br />
920 K. The model compositions <strong>of</strong> exhaust gases (nitrogen<br />
base gas) before and after the catalyst are listed in Table 1.<br />
There were no noticeable differences in gas composition by<br />
the engine type.<br />
The compositions <strong>of</strong> the ash that was blown onto the<br />
<strong>sensor</strong> in the field test were determined by EPMA (see<br />
Table 2). Lubrication oils used were Spark 30R produced<br />
by Japan Energy Corporation, GX-30 and L970 by Nisseki<br />
Mitsubishi Co., Ltd., Pegasus 40 by Mobil Sekiyu Private<br />
Limited and GHP10W30 by Idemitsu Petrochemical Co.,<br />
Ltd.<br />
Static characteristics, internal resistance and response<br />
characteristics were measured. For static characteristics<br />
measurements, the compositions <strong>of</strong> the exhaust gases <strong>of</strong><br />
the gas engines were analyzed and a representative exhaust<br />
gas composition was determined. Fig. 1 shows the schematic<br />
diagram <strong>of</strong> the static characteristics measuring system.<br />
The gas mixtures were produced by mixing several<br />
standard gases with mass-flow controllers. To produce a<br />
humidified gas composition, the oxygen and nitrogen mixture<br />
was passed through a bubbling water bath. A <strong>sensor</strong> was<br />
installed in a quartz holder (see Fig. 2) and heated. A<br />
temperature-measuring <strong>sensor</strong> was fabricated by imbedding<br />
thermocouples (0.5 mm in diameter) in the <strong>sensor</strong> electrode.<br />
Using the gas temperature and the calibration curves from<br />
the temperature-measuring <strong>sensor</strong>, the surface temperature<br />
<strong>of</strong> the electrode was determined. The <strong>sensor</strong> output was<br />
measured with a data logger having input impedance <strong>of</strong><br />
more than 10 10 ohms.<br />
Internal resistance was determined by the following process.<br />
The <strong>sensor</strong> was exposed to a mixed gas <strong>of</strong> rich<br />
composition (composition A in Table 1) for 5 min. After<br />
open circuit voltage (OCV) was measured, a resistance (Rl)<br />
was connected, and closed circuit voltage (CCV) was measured<br />
after a 5 min stabilizing period. The internal resistance<br />
<strong>of</strong> the test <strong>sensor</strong> was calculated from the OCV, CCV and Rl<br />
values.<br />
Fig. 3 shows the schematic diagram <strong>of</strong> the response curve<br />
measurement system. By rapidly changing the ambience <strong>of</strong> a<br />
<strong>sensor</strong>, the <strong>sensor</strong> response speed was measured. The standard<br />
mixed gas compositions used in the experiment are<br />
shown in Table 3. One cylinder contained a model mixed gas<br />
UNCORRECTED PROOF