Oxygen sensor monitoring a deterioration of a three-way ... - UMEL
Oxygen sensor monitoring a deterioration of a three-way ... - UMEL
Oxygen sensor monitoring a deterioration of a three-way ... - UMEL

Create successful ePaper yourself
Turn your PDF publications into a flip-book with our unique Google optimized e-Paper software.
4 K. Moriya, T. Sako / Sensors and Actuators B 3646 (2000) 1–10<br />
Table 3<br />
Gas composition for response measurement<br />
Stage<br />
Gas concentration(vol.%/N 2 base)<br />
CO 2 CO H 2 O 2 CH 4<br />
Lean 11.300 0.079 0.048 0.624 0.138<br />
Rich 11.300 0.758 0.493 0.451 0.163<br />
3. Results and discussion<br />
3.1. Deterioration <strong>of</strong> oxygen <strong>sensor</strong>s<br />
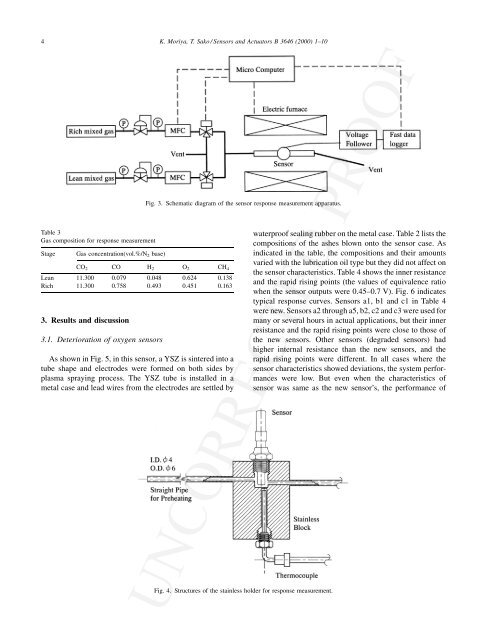
As shown in Fig. 5, in this <strong>sensor</strong>, a YSZ is sintered into a<br />
tube shape and electrodes were formed on both sides by<br />
plasma spraying process. The YSZ tube is installed in a<br />
metal case and lead wires from the electrodes are settled by<br />
Fig. 3. Schematic diagram <strong>of</strong> the <strong>sensor</strong> response measurement apparatus.<br />
Fig. 4. Structures <strong>of</strong> the stainless holder for response measurement.<br />
waterpro<strong>of</strong> sealing rubber on the metal case. Table 2 lists the<br />
compositions <strong>of</strong> the ashes blown onto the <strong>sensor</strong> case. As<br />
indicated in the table, the compositions and their amounts<br />
varied with the lubrication oil type but they did not affect on<br />
the <strong>sensor</strong> characteristics. Table 4 shows the inner resistance<br />
and the rapid rising points (the values <strong>of</strong> equivalence ratio<br />
when the <strong>sensor</strong> outputs were 0.45–0.7 V). Fig. 6 indicates<br />
typical response curves. Sensors a1, b1 and c1 in Table 4<br />
were new. Sensors a2 through a5, b2, c2 and c3 were used for<br />
many or several hours in actual applications, but their inner<br />
resistance and the rapid rising points were close to those <strong>of</strong><br />
the new <strong>sensor</strong>s. Other <strong>sensor</strong>s (degraded <strong>sensor</strong>s) had<br />
higher internal resistance than the new <strong>sensor</strong>s, and the<br />
rapid rising points were different. In all cases where the<br />
<strong>sensor</strong> characteristics showed deviations, the system performances<br />
were low. But even when the characteristics <strong>of</strong><br />
<strong>sensor</strong> was same as the new <strong>sensor</strong>’s, the performance <strong>of</strong><br />
UNCORRECTED PROOF