YAGEO CORPORATION AND SUBSIDIARIES CONSOLIDATED BALANCE SHEETS DECEMBER 31, 2006 AND 2007 (In Thous<strong>and</strong>s of Dollars, Except Number of Shares <strong>and</strong> Par Value) New Taiwan Dollars U.S. Dollars (Note 4) New Taiwan Dollars U.S. Dollars (Note 4) 2006 2007 2007 2006 2007 2007 ASSETS Amount % Amount % Amount LIABILITIES AND STOCKHOLDERS’ EQUITY Amount % Amount % Amount CURRENT ASSETS CURRENT LIABILITIES Cash <strong>and</strong> cash equivalents (Notes 2 <strong>and</strong> 5) $ 1,801,071 4 $ 8,191,567 16 $ 252,491 Short-term loans (Notes 18 <strong>and</strong> 31) $ 3,951,373 9 $ 3,570,742 7 $ 110,062 Financial assets at fair value through profit or loss (Notes 2 <strong>and</strong> 6) 3,176 - 12,233 - 376 Commercial paper issued, net (Note 19) 827,962 2 904,730 2 27,887 Available-for-sale financial assets (Notes 2 <strong>and</strong> 7) 278,613 1 2,012,787 4 62,041 Notes payable 79,318 - 41,851 - 1,290 Hedging derivative financial assets (Notes 2 <strong>and</strong> 35) 290 - 647 - 20 Accounts payable 3,078,795 7 3,579,525 7 110,333 Notes receivable (Note 2) 135,664 - 209,070 - 6,444 Accounts <strong>and</strong> notes payable to related parties (Note 29) 243,223 - 146,294 - 4,509 Accounts receivable, net of allowance for doubtful receivables of Other payables 275,326 1 130,057 - 4,009 NT$84,333 thous<strong>and</strong> in 2006 <strong>and</strong> NT$82,803 thous<strong>and</strong> (US$2,552 Income tax payable (Notes 2 <strong>and</strong> 26) 97,553 - 172,841 1 5,328 thous<strong>and</strong>) in 2007 (Notes 2 <strong>and</strong> 8) 5,432,463 12 6,069,492 12 187,082 Accrued expenses 1,506,112 3 1,286,961 3 39,668 Accounts <strong>and</strong> notes receivables from related parties, net of allowance Financial liabilities at fair value through profit or loss (Notes 2 for doubtful receivables of NT$985 thous<strong>and</strong> in 2006 (Notes 2 <strong>and</strong> 29) 238,401 - 99,785 - 3,076 <strong>and</strong> 6) 10,207 - 3,633 - 112 Income tax refund receivable (Notes 2 <strong>and</strong> 26) 22,673 - 28,438 - 877 Hedging derivative financial liabilities (Notes 2 <strong>and</strong> 35) 9,281 - 2,038 - 63 Other financial assets (Notes 9, 31 <strong>and</strong> 33) 931,757 2 237,820 1 7,330 Current portion of long-term liabilities (Notes 2, 20, 21 <strong>and</strong> 31) 1,104,196 2 129,516 - 3,992 Inventories, net (Notes 2, 10 <strong>and</strong> 33) 4,468,051 10 3,790,758 8 116,844 Other current liabilities (Note 30) 78,813 - 201,347 1 6,206 Deferred income tax assets (Notes 2 <strong>and</strong> 26) 185,292 - 184,741 - 5,694 Other current assets (Notes 2 <strong>and</strong> 28) 464,365 1 314,598 1 9,697 Total current liabilities 11,262,159 24 10,169,535 21 313,459 Total current assets 13,961,816 30 21,151,936 42 651,972 LONG-TERM LIABILITIES Financial liabilities at fair value through profit or loss (Notes 2 LONG-TERM INVESTMENTS (Notes 2, 7, 11, 12, 13, 14 <strong>and</strong> 31) <strong>and</strong> 21) - - 606,625 1 18,698 Investments accounted for using equity method 2,363,027 5 3,019,867 6 93,082 Bonds payable (Notes 2 <strong>and</strong> 21) 84,587 - 4,446,144 9 137,045 Real estate 167,273 - - - - Long-term bank loans (Notes 20 <strong>and</strong> 31) 5,016,255 11 1,471,951 3 45,370 Other long-term investments 58,531 - - - - Financial assets measured at holding cost 1,038,878 2 320,009 1 9,864 Total long-term liabilities 5,100,842 11 6,524,720 13 201,113 Available-for-sale financial assets 749,845 2 1,274,256 2 39,277 Bonds measured at amortized cost 50,000 - 50,000 - 1,541 OTHER LIABILITIES Accrued pension costs (Notes 2 <strong>and</strong> 28) 310,639 1 334,295 1 10,304 Total long-term investments 4,427,554 9 4,664,132 9 143,764 Deposit received (Note 29) 159,113 - 129,264 - 3,984 Other liabilities (Note 30) 8,279 - 150,325 - 4,634 PROPERTY, PLANT AND EQUIPMENT (Notes 2, 15, 31 <strong>and</strong> 33) Cost Total other liabilities 478,031 1 613,884 1 18,922 L<strong>and</strong> 822,011 2 814,424 2 25,103 Buildings 6,131,296 13 7,177,975 14 221,249 Total liabilities 16,841,032 36 17,308,139 35 533,494 Machinery <strong>and</strong> equipment 17,248,519 37 19,494,675 39 600,890 Miscellaneous equipment 1,553,700 4 1,722,826 3 53,103 STOCKHOLDERS’ EQUITY OWNED BY THE PARENT COMPANY Total cost 25,755,526 56 29,209,900 58 900,345 Capital stock - NT$10 par value Less - accumulated depreciation 9,673,686 21 11,561,009 23 356,348 Authorized - 4,000,000 thous<strong>and</strong> shares accumulated impairment 303,977 1 282,582 - 8,710 Issued - 2,423,025 thous<strong>and</strong> shares in 2006 <strong>and</strong> 2,438,221 thous<strong>and</strong> 15,777,863 34 17,366,309 35 535,287 shares in 2007 24,230,255 52 24,382,213 49 751,540 Construction in progress <strong>and</strong> advances for acquisition of equipment 1,684,376 4 1,073,751 2 33,096 Capital stock - unregistered 13,820 - - - - Capital surplus: Net property, plant <strong>and</strong> equipment 17,462,239 38 18,440,060 37 568,383 Paid-in capital in excess of par value 1,077,267 3 1,110,727 2 34,236 Paid-in capital from conversion of convertible bonds 3,972 - 24,762 - 763 INTANGIBLE ASSETS Equity in capital surplus reported by equity-method investees 501,643 1 519,112 1 16,001 Deferred pension costs (Notes 2 <strong>and</strong> 28) 3,857 - 2,541 - 78 Stock options - - 2,749,975 6 84,763 Goodwill (Note 2) 2,678,387 6 2,937,412 6 90,541 Total capital surplus 1,582,882 4 4,404,576 9 135,763 L<strong>and</strong> use rights 93,157 - 96,761 - 2,983 Retained earnings Legal reserve 30,058 - 227,592 - 7,015 Total intangible assets 2,775,401 6 3,036,714 6 93,602 Special reserve 270,519 1 - - - Unappropriated earnings 1,975,340 4 2,029,473 4 62,555 OTHER ASSETS Total retained earnings 2,275,917 5 2,257,065 4 69,570 Loans receivable from related parties (Note 29) 46,456 - 25,444 - 784 Others: Properties leased to others, net (Notes 2, 15, 16 <strong>and</strong> 31) 4,342,672 10 161,743 1 4,985 Cumulative translation adjustments 286,103 - 1,587,004 3 48,917 Idle assets (Notes 2, 15 <strong>and</strong> 30) 576,461 1 452,092 1 13,935 Net loss not recognized as pension cost (52,079 ) - (42,087 ) - (1,297 ) Refundable deposits 97,092 - 58,612 - 1,807 Unrealized gain or loss on financial instrument 323,193 1 (642,339 ) (1 ) (19,799 ) Deferred income tax assets (Notes 2 <strong>and</strong> 26) 2,017,177 4 1,649,359 3 50,839 Total others 557,217 1 902,578 2 27,821 Pledged assets (Notes 17, 26 <strong>and</strong> 31) 198,744 1 89,091 - 2,746 Treasury stock - 2,193 thous<strong>and</strong> shares (28,101 ) - - - - Miscellaneous 431,447 1 383,164 1 11,810 Total stockholders’ equity owned by the parent company 28,631,990 62 31,946,432 64 984,694 Total other assets 7,710,049 17 2,819,505 6 86,906 MINORITY INTEREST 864,037 2 857,776 1 26,439 Total stockholders’ equity 29,496,027 64 32,804,208 65 1,011,133 TOTAL $ 46,337,059 100 $ 50,112,347 100 $ 1,544,627 TOTAL $ 46,337,059 100 $ 50,112,347 100 $ 1,544,627 The accompanying notes are an integral part of the consolidated financial statements. (With Deloitte & Touche audit report dated April 16, 2008) - 4 -
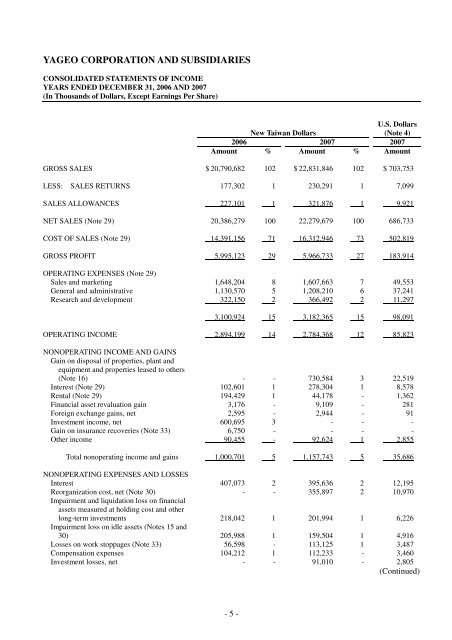
YAGEO CORPORATION AND SUBSIDIARIES CONSOLIDATED STATEMENTS OF INCOME YEARS ENDED DECEMBER 31, 2006 AND 2007 (In Thous<strong>and</strong>s of Dollars, Except Earnings Per Share) U.S. Dollars New Taiwan Dollars (Note 4) 2006 2007 2007 Amount % Amount % Amount GROSS SALES $ 20,790,682 102 $ 22,831,846 102 $ 703,753 LESS: SALES RETURNS 177,302 1 230,291 1 7,099 SALES ALLOWANCES 227,101 1 321,876 1 9,921 NET SALES (Note 29) 20,386,279 100 22,279,679 100 686,733 COST OF SALES (Note 29) 14,391,156 71 16,312,946 73 502,819 GROSS PROFIT 5,995,123 29 5,966,733 27 183,914 OPERATING EXPENSES (Note 29) Sales <strong>and</strong> marketing 1,648,204 8 1,607,663 7 49,553 General <strong>and</strong> administrative 1,130,570 5 1,208,210 6 37,241 Research <strong>and</strong> development 322,150 2 366,492 2 11,297 3,100,924 15 3,182,365 15 98,091 OPERATING INCOME 2,894,199 14 2,784,368 12 85,823 NONOPERATING INCOME AND GAINS Gain on disposal of properties, plant <strong>and</strong> equipment <strong>and</strong> properties leased to others (Note 16) - - 730,584 3 22,519 Interest (Note 29) 102,601 1 278,304 1 8,578 Rental (Note 29) 194,429 1 44,178 - 1,362 Financial asset revaluation gain 3,176 - 9,109 - 281 Foreign exchange gains, net 2,595 - 2,944 - 91 Investment income, net 600,695 3 - - - Gain on insurance recoveries (Note 33) 6,750 - - - - Other income 90,455 - 92,624 1 2,855 Total nonoperating income <strong>and</strong> gains 1,000,701 5 1,157,743 5 35,686 NONOPERATING EXPENSES AND LOSSES Interest 407,073 2 395,636 2 12,195 Reorganization cost, net (Note 30) - - 355,897 2 10,970 Impairment <strong>and</strong> liquidation loss on financial assets measured at holding cost <strong>and</strong> other long-term investments 218,042 1 201,994 1 6,226 Impairment loss on idle assets (Notes 15 <strong>and</strong> 30) 205,988 1 159,504 1 4,916 Losses on work stoppages (Note 33) 56,598 - 113,125 1 3,487 Compensation expenses 104,212 1 112,233 - 3,460 Investment losses, net - - 91,010 - 2,805 (Continued) - 5 -