print pdf - Anglo Platinum
print pdf - Anglo Platinum
print pdf - Anglo Platinum

You also want an ePaper? Increase the reach of your titles
YUMPU automatically turns print PDFs into web optimized ePapers that Google loves.
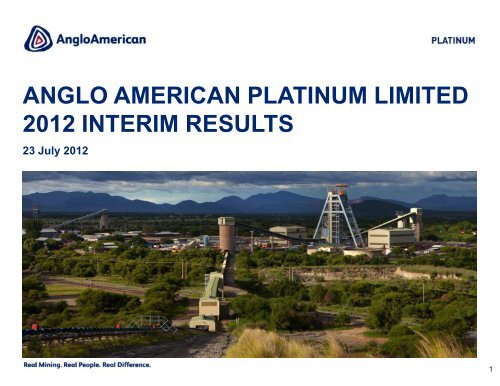
ANGLO AMERICAN PLATINUM LIMITED<br />
2012 INTERIM RESULTS<br />
23 July 2012<br />
Mogalakwena Central Pit<br />
1
DISCLAIMER: CERTAIN FORWARD-LOOKING STATEMENTS<br />
Certain statements made in this presentation constitute forward-looking statements. Forward looking statements are typically identified by the<br />
use of forward-looking terminology such as 'believes', 'expects', 'may', 'will', 'could', 'should', 'intends', 'estimates', 'plans', 'assumes' or<br />
'anticipates' or the negative thereof or other variations thereon or comparable terminology, or by discussions of, e.g. future plans, present or<br />
future events, or strategy that involve risks and uncertainties. Such forward-looking statements are subject to a number of risks and<br />
uncertainties, many of which are beyond the Company's control and all of which are based on the Company's current beliefs and expectations<br />
about future events. Such statements are based on current expectations and, by their nature, are subject to a number of risks and uncertainties<br />
that could cause actual results and performance to differ materially from any expected future results or performance, expressed or implied, by<br />
the forward-looking statement. No assurance can be given that such future results will be achieved; actual events or results may differ<br />
materially as a result of risks and uncertainties facing the Company and its subsidiaries. The forward-looking statements contained in this<br />
presentation speak only as of the date of this presentation and the Company undertakes no duty to, and will not necessarily, update any of<br />
them in light of new information or future events, except to the extent required by applicable law or regulation.<br />
2
AGENDA<br />
• Overview of 1H 2012<br />
• Review of safety performance<br />
• Review of markets<br />
• Review of operational performance<br />
• Review of financial performance<br />
• Strategic review and outlook<br />
• Question and answer session<br />
3
OVERVIEW OF 1H 2012<br />
4
KEY FEATURES<br />
OPERATIONAL PERFORMANCE<br />
FINANCIAL PERFORMANCE<br />
• Notwithstanding a 38% year-on-year reduction<br />
in fatalities,, 5 employees lost their lives during<br />
the 1H 2012<br />
• Equivalent refined platinum production up 1%<br />
to 1.18 moz<br />
–Mogalakwena’s platinum output up 9% and<br />
concentrator recoveries improved by 15%<br />
–Unki’s platinum production up 46%<br />
• Headline earnings down 78% to R713 million,<br />
driven by lower sales volumes and weaker<br />
average realised prices<br />
• Cash operating costs up 11% to R14,478 per<br />
equivalent refined platinum ounce<br />
• Negative operating free cash flow, leading to a<br />
significant increase in net debt and a<br />
suspension of dividend<br />
• Productivity increased 11% to 6.54m 2 per total<br />
operating employee<br />
• Refined platinum production and sales<br />
volume down 13% and 21% respectively<br />
• Review of <strong>Anglo</strong> American <strong>Platinum</strong> portfolio is<br />
continuing and expected to be completed by<br />
year end<br />
Rands cents per share<br />
Headline earnings per share profile<br />
2,500<br />
HEPS - 1H<br />
2,000<br />
HEPS - 2H<br />
1,500<br />
1,000<br />
500<br />
0<br />
2009 2010 2011 1H 2012<br />
5
SAFETY<br />
6
JOURNEY TO ZERO HARM<br />
• LTIFR up 2% from 1.33 in 1H 2011 to 1.36 in<br />
1H 2012<br />
• Regrettably, 5 fatalities during 1H 2012<br />
• Significant safety achievements during 1H 2012<br />
– All projects: > 3 fatality free years<br />
– Modikwa Mine: > 8.9 million fatality free shifts<br />
– Siphumelele mine: > 1.6 million fatality free shifts<br />
– Union South mine: > 1.6 million fatality free shifts<br />
– Thembelani mine: > 1.3 million fatality free shifts<br />
– Tumela mine: > 1.3 million fatality free shifts<br />
30<br />
25<br />
20<br />
15<br />
10<br />
5<br />
0<br />
2.50<br />
Number of fatalities: down 72% since 1H 2007<br />
7<br />
10<br />
4<br />
4<br />
18<br />
3<br />
10<br />
8<br />
8<br />
5 5<br />
2007 2008 2009 2010 2011 1H 2012<br />
2.36<br />
Fatalities - 1H<br />
Fatalities - 2H<br />
Lost-time injury frequency rate: down 42%<br />
since 1H 2007<br />
2.00<br />
2.03<br />
1.74<br />
1.50<br />
1.37<br />
1.17<br />
1.27<br />
1.36<br />
1.00<br />
0.50<br />
0.00<br />
1H 2007 2007 2008 2009 2010 2011 1H 2012<br />
7
REVIEW OF MARKETS<br />
8
BASKET PRICE REMAINS UNDER PRESSURE<br />
• Average platinum price decreased 13.2% to<br />
US$1,546/oz in 1H 2012 compared to 1H 2011<br />
• Realised average rand basket price down 1%<br />
to R20,086/Pt oz in 1H 2012, remains below<br />
the production incentive price<br />
Rand basket price<br />
22,000<br />
21,000<br />
20,000<br />
19,000<br />
18,000<br />
17,000<br />
<strong>Anglo</strong> American <strong>Platinum</strong>’s realised basket price<br />
• Europe GDP change more influential on<br />
platinum demand than global GDP<br />
• <strong>Platinum</strong> price remains weak – poor investor<br />
sentiment dominates<br />
• <strong>Platinum</strong>’s discount to gold persists, reducing<br />
metal investor participation<br />
GDP - % change<br />
16,000<br />
6<br />
5<br />
4<br />
3<br />
2<br />
1<br />
0<br />
Jan-10 May-10 Sep-10 Jan-11 May-11 Sep-11 Jan-12 May-12<br />
ZAR basket price Average basket price - 1H 2010<br />
Average basket price - 1H 2011 Average basket price - 1H 2012<br />
Historic GDP and platinum demand<br />
2000 2001 2002 2003 2004 2005 2006 2007 2008 2009 2010 2011<br />
-1<br />
-2<br />
-3<br />
-4<br />
-5<br />
World GDP, % change<br />
Source: AAP, IMF, Johnson Matthey<br />
Year<br />
Euro Area GDP, % change<br />
Pt Demand (koz) - RH Axis<br />
Financial<br />
Crisis<br />
6.800<br />
6.600<br />
6.400<br />
6.200<br />
6.000<br />
5.800<br />
5.600<br />
5.400<br />
2012<br />
5.200<br />
5.000<br />
4.800<br />
4.600<br />
4.400<br />
Pt koz<br />
9
PLATINUM DEMAND REMAINS WEAK IN SHORT TERM<br />
• <strong>Platinum</strong> demand in 1H 2012 marginally<br />
below demand in 1H 2011<br />
• Jewellery demand firm, industrial demand<br />
flat with autocatalyst and investment<br />
demand weak<br />
• Europe comprises 30% of global platinum<br />
demand – autocatalyst demand driving<br />
sentiment<br />
• Increased loading from Euro 6 legislation –<br />
early effects commence ahead of 2014 /<br />
2015 implementation<br />
100%<br />
80%<br />
60%<br />
40%<br />
20%<br />
0%<br />
<strong>Platinum</strong> demand 2011<br />
Auto Investment Jewellery Industrial Total<br />
Rest of the World European Union<br />
Europe autocatalyst PGM demand split 2011<br />
• GDP linked long-term demand supported<br />
by tightening legislation and diverse<br />
industrial uses<br />
Gasoline Light duty diesel Heavy duty diesel<br />
10
OPERATIONAL REVIEW<br />
11
PRODUCTION PERFORMANCE IN 1H 2012<br />
• Higher production volume due to improved<br />
safety and operational performances from own<br />
underground mines<br />
• S54 stoppages are more localised and for a<br />
shorter duration<br />
• Own mines lost 14,300 ounces of platinum,<br />
compared with 48,300 in 1H 2011, due to non<br />
fatality related S54 stoppages<br />
1,000<br />
Own mines’ equivalent refined platinum production<br />
90<br />
80<br />
70<br />
60<br />
50<br />
40<br />
30<br />
20<br />
10<br />
0<br />
Own mines’ safety stoppages (S54s)<br />
S54s - 1H S54s - 2H<br />
48<br />
19<br />
19<br />
24<br />
33<br />
27<br />
28<br />
39<br />
11<br />
17<br />
2007 2008 2009 2010 2011 1H 2012<br />
Group equivalent refined platinum production<br />
Equivalent refined platinum ounce ('000)<br />
950<br />
900<br />
850<br />
800<br />
750<br />
700<br />
650<br />
600<br />
Equivalent refined platinum ounces ('000)<br />
1,200<br />
1,150<br />
1,100<br />
1,050<br />
550<br />
500<br />
763 10 13 (10) 23 56 (29) (24) 803<br />
1H 2011 Unki Mogala<br />
kwena<br />
Surface<br />
material<br />
Labour Localised<br />
productivity and shorter<br />
S54s<br />
Own safety<br />
initiatives<br />
Other 1H 2012<br />
1,000<br />
1,160 40 (6) (17) 1,177<br />
3.4% -0.5% -1.4% 1.4%<br />
1H 2011 Own mines JVs and Associates 3rd party purchases 1H 2012<br />
12
REFINED PRODUCTION IMPACTED BY OPERATIONAL<br />
DIFFICULTIES AT THE CONVERTER PLANT<br />
• Refined production down 13% year-on-year<br />
• Operational difficulties experienced upon the<br />
restart of the converter plant post annual<br />
maintenance are resolved. Furnace matte<br />
converted in June 2012 exceeded previous<br />
monthly record by 5%<br />
• Concentrator challenges at Amandelbult<br />
impacting recoveries and equivalent refined<br />
production<br />
Recoveries (%)<br />
88<br />
87<br />
86<br />
85<br />
84<br />
83<br />
82<br />
81<br />
80<br />
79<br />
78<br />
Merensky and UG2 recoveries<br />
87<br />
86<br />
86<br />
85 85<br />
85<br />
84 84<br />
82<br />
81<br />
2008 2009 2010 2011 2012 YTD<br />
• UG2 recoveries up 5% from 2008<br />
• Mogalakwena recoveries continue to improve<br />
as the ramp up is complete<br />
–Recoveries up 15% in 1H 2012 from 1H<br />
2011<br />
• Smelting reliability continues to improve<br />
Recoveries (%)<br />
80<br />
75<br />
70<br />
65<br />
60<br />
UG2 recoveries Merensky recoveries<br />
Mogalakwena concentrator recoveries<br />
74<br />
69<br />
69<br />
65<br />
75<br />
55<br />
50<br />
1H 2010 2H 2010 1H 2011 2H 2011 1H 2012<br />
13
LABOUR PRODUCTIVITY<br />
• Underground mine productivity improved 11% to<br />
6.54 m 2 per employee<br />
• Own mines productivity increased by 12% to<br />
6.08m 2 per employee<br />
Square metres<br />
Labour productivity profile (M 2 /operating employee)<br />
8.0<br />
7.06<br />
7.0<br />
6.54<br />
6.33<br />
6.32<br />
6.11<br />
6.0<br />
5.73<br />
5.0<br />
4.0<br />
3.0<br />
• Tonnes milled per employee was essentially in<br />
line with the prior year<br />
2.0<br />
1.0<br />
0.0<br />
2007 2008 2009 2010 2011 1H 2012<br />
• Underground mine productivity benefitted from<br />
improved safety and operational performances<br />
and absence of union related disruptions<br />
<strong>Platinum</strong> ounces per employee<br />
40<br />
35<br />
30<br />
25<br />
20<br />
15<br />
10<br />
5<br />
<strong>Platinum</strong> industry labour productivity profile<br />
0<br />
2007 2008 2009 2010 2011<br />
<strong>Anglo</strong> American <strong>Platinum</strong> Peer 1 Peer 2 Peer 3 Peer 4<br />
Source: Company reports, Deutsche bank<br />
14
COST MANAGEMENT<br />
• Cash operating costs per equivalent refined<br />
platinum ounce up by 11% on higher-than inflation<br />
increases in costs of electricity and electrical<br />
components (up 20%), diesel (up 28%), labour<br />
(up 10%)<br />
Rand/ounce<br />
Cash operating cost per equivalent refined Pt oz<br />
16,000<br />
14,478<br />
14,066<br />
14,000<br />
12,991<br />
11,598 11,736 11,945<br />
12,000<br />
11,493<br />
10,498 10,775<br />
10,000<br />
8,000<br />
6,000<br />
• Mining inflation of 8.4% compared to average<br />
inflation of 5.8%<br />
• Cash on-mine cost per tonne up 14% to R560 in<br />
1H 2012 due to decline in surface material<br />
4,000<br />
2,000<br />
0<br />
1,400<br />
1H 2008 2H 2008 1H 2009 2H 2009 1H 2010 2H 2010 1H2011 2H2011 1H 2012<br />
<strong>Platinum</strong> industry unit cost profile<br />
Rand cost per tonne milled<br />
1,200<br />
1,000<br />
800<br />
600<br />
400<br />
200<br />
-<br />
2008 2009 2010 2011<br />
Peer 3 Peer 4 <strong>Anglo</strong> American <strong>Platinum</strong> Peer 1 Peer 2<br />
Source: Company reports, Deutsche bank<br />
15
REVIEW OF FINANCIAL<br />
PERFORMANCE<br />
16
UNDERLYING FINANCIAL PERFORMANCE<br />
R million 1H 2012 1H 2011<br />
Change<br />
Basket price per Pt oz ($) 2,532 2,927 13% <br />
Basket price per Pt oz (R) 20,086 20,194 1% <br />
Net sales revenue 19,410 24,805 22% <br />
EBITDA 2,252 6,700 66% <br />
Operating profit 399 4,752 92% <br />
Headline earnings 713 3,233 78% <br />
Headline earnings per share (cents) 273 1,236 78% <br />
Ordinary dividends - 1,311 100% <br />
Ordinary dividends per share (cents) - 500 100% <br />
Operating free cash flow (2,622) 4,745 155% <br />
Capital expenditure (excl. interest capitalised) 2,828 2,828 0%<br />
Net debt 9,542 4,350 119% <br />
17
HEADLINE EARNINGS<br />
4,000<br />
3,000<br />
2,000<br />
R m<br />
1,000<br />
0<br />
-1,000<br />
-2,000<br />
-3,000<br />
3,233 -2,175 1,468 -600 -3,152 -933 3,352 -133 -212 -278 143 713<br />
1H 2011 Price Exchange Inflation Sales volume Costs Stock<br />
movement<br />
Depreciation Net interest Associates Other 1H 2012<br />
18
COST MANAGEMENT AND OPERATING MARGIN<br />
R million 1H 2012 1H 2011 Change<br />
Cash operating costs 1 13,900 11,827 18% <br />
Other costs 1,141 1,221 7% <br />
Purchase of concentrate / metals 4,026 4,355 8% <br />
Depreciation and waste stripping 2,354 2,159 9% <br />
Cost of sales 17,331 20,038 14% <br />
1 Cash operating costs comprise on-mine, smelting and refining costs<br />
Margins 1H 2012 1H 2011 Change<br />
Gross profit margin 11% 19% 42% <br />
Headline earnings margin 4% 13% 69% <br />
19
COSTS IMPACTED BY MINING INFLATION<br />
16,000<br />
14,000<br />
Rand per equivalent refined Pt ounce<br />
12,000<br />
10,000<br />
8,000<br />
6,000<br />
4,000<br />
2,000<br />
0<br />
12,991 777 -755 490 295 680 14,478<br />
6.0% -5.9% 3.8% 2.3% 5.2% 11.4%<br />
1H 2011 Inflation Production Labour cost Utilities Other operating<br />
costs (excl. labour)<br />
1H 2012<br />
20
OPERATING FREE CASH FLOW<br />
6,000<br />
5,000<br />
Operating free cashflow (Rm)<br />
4,000<br />
3,000<br />
2,000<br />
1,000<br />
0<br />
-1,000<br />
-2,000<br />
-3,000<br />
4,745 -5,476 -1,710 -181 (2,622)<br />
1H 2011<br />
Cash receipts from<br />
customers<br />
Cash paid to suppliers<br />
and employees<br />
SIB capex 1H 2012<br />
21
STRATEGIC REVIEW<br />
AND OUTLOOK<br />
22
PORTFOLIO REVIEW UNDERWAY<br />
• Since we announced the in-depth strategic<br />
review the operating environment has<br />
deteriorated further<br />
–Rand basket price is under pressure, mining<br />
inflation is higher than expected, labour unrest<br />
presented new challenges and safety related<br />
stoppages remain a challenge<br />
–Resulting in the need to completely review the<br />
operational and strategic plan<br />
• The preferred portfolio should meet the<br />
‘Strategic Intent’ of <strong>Anglo</strong> American <strong>Platinum</strong>:<br />
1. Produce safe, profitable ounces<br />
2. Transformation status must be maintained<br />
3. Extract maximum value from assets<br />
4. Move assets down the cost curve<br />
5. Increase ratio of high margin to low margin<br />
ounces<br />
• Optimise value of the portfolio through economic<br />
cycles and associated market variation<br />
• All options still being considered as part of<br />
portfolio review<br />
Rand million<br />
60,000<br />
50,000<br />
40,000<br />
30,000<br />
20,000<br />
10,000<br />
0<br />
EBIT margin profile<br />
FY90A FY93A FY96A FY99A FY02A FY05A FY08A FY11A<br />
Revenue EBIT EBIT margin Average EBIT margin<br />
70%<br />
60%<br />
50%<br />
40%<br />
30%<br />
20%<br />
10%<br />
Competitor responses to prevailing market conditions<br />
“The Board and management of Aquarius are acutely<br />
aware of the difficulties facing the industry at present.”<br />
Stuart Murray, CEO of Aquarius – 4 July 2012<br />
“The continued cost pressures that we are experiencing<br />
in South Africa, make the platinum sector an extremely<br />
difficult space in which to operate. ” stated Ian Rozier,<br />
President and CEO of Eastplat - 30 May 2012<br />
“The inflationary increases in our costs and what<br />
seemingly appears to be an unrelenting depressed<br />
pricing environment also impacted our profitability and<br />
cash flows.” Ian Farmer, CEO of Lonmin – 14 May 2012<br />
0%<br />
Percentage<br />
Source: Company announcements.<br />
23
PORTFOLIO REVIEW UNDERWAY<br />
AIM: Develop a business which delivers “through the cycle” value to shareholders and stakeholders<br />
“Safe, profitable platinum”<br />
Deliver industry leading returns<br />
Continue to improve the base business<br />
Optimise portfolio value<br />
Structure foot<strong>print</strong> for maximum value<br />
1<br />
Market and<br />
Commercial<br />
excellence<br />
• Optimise margins<br />
• Refresh market<br />
development<br />
4<br />
Portfolio Alternatives<br />
• Review and rebase the operational<br />
foot<strong>print</strong> to drive sustainable long<br />
term value growth<br />
2<br />
Operational<br />
excellence<br />
3<br />
Projects<br />
excellence<br />
• Target top quartile<br />
productivity and<br />
cost performance<br />
• Continue to<br />
improve projects<br />
delivery - on time<br />
and on budget<br />
Long term<br />
value<br />
creation<br />
• Small number of discrete criteria to<br />
drive decision making<br />
• Focus on both improving safety<br />
performance and profitability/returns<br />
• Leverage AAP industry leading<br />
resource base where possible<br />
5 • Review of corporate, central services and operations<br />
Overhead &<br />
support costs<br />
Organisational<br />
Review • Organisational structure to ensure efficiency and<br />
effectiveness<br />
24
PORTFOLIO REVIEW UNDERWAY: ACTIONS TAKEN<br />
• In light of further deterioration in the market,<br />
near term actions have been taken:<br />
–JV portfolio under review and effected the<br />
closure of Marikana mine<br />
–Capex target was reduced further to up to<br />
6.0<br />
R7.3 billion from R8 billion announced in<br />
4.0<br />
February, resulting in total cuts of R1.7 billion<br />
from our original target of R9 billion 2.0<br />
–Overhead review initiated<br />
Rand billion<br />
14.0<br />
12.0<br />
10.0<br />
8.0<br />
Capital expenditure profile<br />
Cut capex by<br />
R1.7 billion<br />
2008 2009 2010 2011 2012 Initial<br />
2012<br />
forecast Current<br />
focecast<br />
Stay in business capital Project capital Waste stripping<br />
25
2H 2012 OUTLOOK<br />
• Journey to zero harm continues<br />
• Expect a surplus platinum market in 2012<br />
• Planning to refine and sell between 2.4 and 2.5 million ounces of platinum in 2012 subject to<br />
market conditions<br />
• Aiming to contain cash unit costs to up to R15,000 per equivalent refined platinum ounce,<br />
assuming 2.5 million ounces production level<br />
• CAPEX forecast revised to up to R7.3 billion for 2012<br />
26
Q&A<br />
27
THANK YOU<br />
28


![[PDF] Mogalakwena Mine - Anglo Platinum](https://img.yumpu.com/43065142/1/184x260/pdf-mogalakwena-mine-anglo-platinum.jpg?quality=85)