
You also want an ePaper? Increase the reach of your titles
YUMPU automatically turns print PDFs into web optimized ePapers that Google loves.
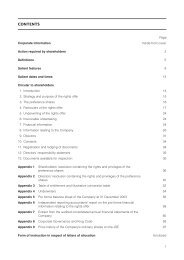
Corporate Overview<br />
June 2009<br />
1 2008 Annual results
Our Strategy<br />
To develop the market for platinum group metals, to expand our production into<br />
that opportunity and to conduct our business safely, cost effectively and<br />
competitively<br />
2 Corporate Overview June 2009
World leader in platinum<br />
• The world’s largest primary producer of platinum<br />
• Refined production (000’ oz):<br />
<strong>Platinum</strong><br />
1Q09<br />
404<br />
2008<br />
2,387<br />
2007<br />
2,474<br />
Palladium<br />
235<br />
1,319<br />
1,390<br />
Rhodium<br />
74<br />
299<br />
329<br />
PGMs<br />
839<br />
4,531<br />
4,787<br />
• Headline Earnings:<br />
R m<br />
US$ m<br />
13,292<br />
1,722<br />
12,325<br />
1,741<br />
• Ordinary shares in issue (m):<br />
237.1<br />
237.1<br />
229.6<br />
• Market capitalization (US$ bn):<br />
14.5<br />
13.2<br />
35.0<br />
• <strong>Anglo</strong> <strong>American</strong> plc shareholding: 79.6% 79.6% 76.5%<br />
3 Corporate Overview June 2009
2008 highlights<br />
• Noticeable improvement in safety<br />
• Record headline earnings of R13.3 billion, up 8%<br />
• 2.39 million refined platinum ounces in line with mid year forecast<br />
• 2.22 million ounces sold<br />
• Unit operating costs per equivalent refined platinum ounce up 35.6%<br />
• New mining right conversions, ESOP in place<br />
• Global economic impacts addressed<br />
4 Corporate Overview June 2009
Key business issues<br />
1. Safety:<br />
2. Cost management:<br />
3. Improving productivity:<br />
– Focus on achieving zero harm<br />
– Addressing unit costs to match output of 2.4<br />
million refined platinum ounces<br />
– Reduction in headcount to match output<br />
4. Declining grade and recovery:<br />
5. Project pipeline management:<br />
6. Balance sheet management:<br />
– Increased UG2 and reduced mining flexibility<br />
– Production of metal to meet market demand<br />
– Reduction in capex plans for 2009 of more than<br />
50% to R9.1 billion<br />
– Rising debt levels from R13.5 billion net debt as<br />
at 31/12/08<br />
– Suspension of final dividend for 2008<br />
5 Corporate Overview June 2009
Safety<br />
Safety is our first value<br />
Zero is possible<br />
6 Corporate Overview June 2009
Safety progress<br />
• Noticeable improvement in safety: LTIFR down 29% since 2007<br />
• Increased safety excellence:<br />
– Union Mine: 7 million fatalityfree<br />
shifts, a mining industry<br />
milestone<br />
–Modikwa Mine: 5 million<br />
fatality-free shifts<br />
– Union concentrators, Slag<br />
plant: 3 years total injury-free<br />
–Precious Metals Refinery: 20<br />
years fatality free<br />
–BRPM, South Shaft: 1 million<br />
fatality-free shifts<br />
–Tumela mine: first 1 million<br />
fatality-free shifts<br />
2<br />
1.5<br />
1<br />
0.5<br />
0<br />
29% reduction in LTIFR<br />
2.03<br />
2.05<br />
1.82<br />
1.80<br />
1.52<br />
1.44<br />
2007 1Q08 2Q08 3Q08 4Q08 1Q09<br />
LTI/200 000 hours<br />
7 Corporate Overview June 2009
Cost management<br />
• 7% reduction in Rand cash operating costs per equivalent refined platinum<br />
ounce in 1Q09 vs. 4Q08<br />
1Q09: split of cash operating costs*<br />
Sundries<br />
15%<br />
Toll refining<br />
1%<br />
Utilities<br />
6%<br />
Labour<br />
38%<br />
Stores<br />
27%<br />
Contractors<br />
13%<br />
*Includes On-mine costs (comprise mining and concentrating costs) smelting and refining costs<br />
8 Corporate Overview June 2009
<strong>Anglo</strong> <strong>Platinum</strong> mines: across the industry cost curve<br />
Southern Africa Net Cash Cost Curve (2009)<br />
Net Cash Cost (1) (Real 2008$/ Pt oz)<br />
3,500<br />
Q1 Q2 Q3 Q4<br />
1,800<br />
Lebowa<br />
Thembelani<br />
1,600<br />
Khuseleka<br />
Khomanani<br />
1,400<br />
Twickenham<br />
Siphumelele<br />
Marikana<br />
1,200<br />
1,000<br />
800<br />
600<br />
Pandora<br />
Dishaba<br />
WLTR<br />
Tumela<br />
Mototolo<br />
Union<br />
Section<br />
Modikwa<br />
BRPM<br />
Mogalakwena<br />
Bathopele<br />
Kroondal<br />
400<br />
200<br />
0<br />
0 1,000 2,000 3,000 4,000 5,000<br />
Production (Refined k Pt oz)<br />
<strong>Anglo</strong> <strong>Platinum</strong><br />
(1)<br />
Total Cash Cost less revenue from other metals outside platinum<br />
9 Corporate Overview June 2009
Improving productivity<br />
•2008 headcount:<br />
— Average number of own employees: 50,152<br />
— Average number of contractors: 27,245<br />
— Total average: 77,397<br />
•Headcount reduction:<br />
— 10,000 reduction by end 2009 (c.8,000 in 1H09)<br />
— Of which, 7,800 contract employees and 2,200 from “natural attrition”<br />
— 4,195 reductions by end 1Q09<br />
10 Corporate Overview June 2009
Declining grade and recovery<br />
• Increasing proportion of UG2: lower<br />
grade and recovery<br />
5<br />
Built up head grade<br />
% UG2<br />
70<br />
•Increased UG2 mined vs. total output:<br />
2003: 43% to 2008: 57%<br />
4.5<br />
4<br />
3.5<br />
60<br />
50<br />
• Built-up head grade decreased from<br />
2003: 4.53 to 2008: 3.36 g/tonne milled<br />
• Ore mix management and process<br />
recovery optimisation<br />
3<br />
2.5<br />
2<br />
1.5<br />
1<br />
0.5<br />
40<br />
30<br />
20<br />
10<br />
•Focus on improving flexibility by<br />
increasing ore reserve development<br />
2003 2004 2005 2006 2007 2008<br />
11 Corporate Overview June 2009
Project pipeline management<br />
• Approved projects form pipeline of $5.8 billion<br />
• Five replacement projects, four expansion projects<br />
• Project and stay-in-business capital expenditure plans reduced for 2009 to R9.1 billion<br />
Replacement projects<br />
Growth projects<br />
Project<br />
Refined production<br />
2009 2010 2011 2012 2013 2014 2015 2016 2017 2018 2019<br />
2400<br />
Capex:<br />
Mogalakwena North 200 (2Q)<br />
$230m<br />
Capex:<br />
Lebowa Brakfontein Merensky 108 (1Q)<br />
$179m<br />
Townlands Ore (Kuseleka Mine)<br />
Paardekraal (Thembelani Mine)<br />
Amandelbult No.4 Shaft (Tumela Mine)<br />
Mogalakwena North<br />
230 (2Q)<br />
Amandelbult East Upper UG2 (Tumela Mine) 100 (4Q)<br />
Twickenham<br />
Styldrift Merensky phase 1<br />
Capex:<br />
$692m<br />
Capex:<br />
$224m<br />
Capex:<br />
$139m<br />
Capex:<br />
$316m<br />
All production shown at 100% and in ‘000 ounces per annum; dates show full production dates<br />
70 (2Q)<br />
120 (2Q)<br />
180 (4Q)<br />
Capex:<br />
$800m<br />
Capex:<br />
$1602m<br />
245 (2Q)<br />
271 (1Q)<br />
Capex:<br />
$1621m<br />
12 Corporate Overview June 2009
Balance Sheet management<br />
• 2008 Final dividend suspended<br />
• Net debt at end 2008: R13.5 billion<br />
• Long term debt R10.3 billion<br />
• Committed debt facilities of R26 billion<br />
R mn<br />
2008<br />
2007<br />
2006<br />
2005<br />
2004<br />
Net debt/(cash)<br />
13,459<br />
4,086<br />
3,876<br />
(4,413)<br />
(2,460)<br />
Net debt/EBITDA<br />
0.6<br />
0.2<br />
0.2<br />
n/a<br />
n/a<br />
Net debt to CE (%)<br />
31.2<br />
13.1<br />
n/a<br />
9.8<br />
15.6<br />
Interest bearing<br />
debt/Shareholders equity (%)<br />
55.4<br />
28.4<br />
2.0<br />
20.5<br />
32.2<br />
13 Corporate Overview June 2009
The world’s largest primary producer of platinum<br />
2008: Global platinum supply: 5,970m oz*<br />
2008: South Africa platinum supply: 4,530m oz*<br />
Other<br />
16%<br />
Lonmin<br />
15%<br />
Other<br />
3%<br />
Norilsk<br />
11%<br />
<strong>Anglo</strong> <strong>Platinum</strong><br />
40%<br />
<strong>Anglo</strong> <strong>Platinum</strong><br />
53%<br />
Lonmin<br />
11%<br />
Impala<br />
29%<br />
Impala<br />
22%<br />
• Global platinum supply dropped by 580k oz, -8.9% from 2007<br />
• South African platinum supply dropped by 505k oz, -10% from 2007<br />
*Source: Johnson Matthey 2009 <strong>Platinum</strong> Review<br />
14 Corporate Overview June 2009
Primary platinum production drives strategy<br />
• Expansion decisions based on platinum<br />
demand growth<br />
2008: split of gross revenue by metal<br />
• Value and return based on rand<br />
revenue of basket of metals sold<br />
Nickel<br />
5%<br />
Other<br />
5%<br />
•<strong>Anglo</strong> <strong>Platinum</strong> basket price: net sales<br />
revenue (all metals) per platinum ounce<br />
refined in 2008:<br />
— US$2,764 (+7.2% yr on yr)<br />
— R22,348 (+23.0% yr on yr)<br />
Rhodium<br />
26%<br />
Palladium<br />
8%<br />
<strong>Platinum</strong><br />
56%<br />
15 Corporate Overview June 2009
Extensive high quality ore reserves and resources<br />
16 Corporate Overview June 2009
Extensive high quality ore reserves and resources<br />
• Proved and probable reserves of 1,478 Mt @ 4.16 g/t: 197.5m oz (4E)<br />
– Increase of 6.3% (CAGR) over 5 yrs<br />
– Implied life of mines: 60 years<br />
• Measure and Indicated resource: 2,221 Mt @ 3.93 g/t: 281m oz (4E)<br />
– Increase of 4.3% (CAGR) over 5 years<br />
– Implied life of mines: 84 years<br />
• Approximately 30% of global platinum known and potential resources<br />
• 57% of South Africa’s 4E reserves<br />
• BEE transactions reduce total reserves and resources (including inferred) by 20.1%<br />
17 Corporate Overview June 2009
Operating statistics 2008/2007<br />
Mining operation<br />
Rustenburg<br />
FY08<br />
Total<br />
capex<br />
Amandelbult 5,769 461.2 19.3 55.5 2,351 6,981 573.9 23.2 61.2<br />
Union (1) 5,570 309.0 12.9 49.6 567 5,610 309.6 12.5 47.7<br />
Mogalakwena<br />
Lebowa<br />
Twickenham 164 9.9 0.4 (41.8) 517 159 8.8 0.4 (4.6)<br />
BRPM (2) 1,124 170.5 7.1 45.9 306 1,284 190.5 7.7 50.1<br />
WLTR<br />
5,272 41.8 1.8 43.2 6<br />
5,146 44.1 1.8 44.7<br />
Kroondal (2)/(3) 3,041 196.3 8.2 58.3 517 2,925 128.8 5.2 61.3<br />
Modikwa (2) 1,257 131.2 5.5 29.5 235 1,120 114.6 4.6 37.4<br />
Marikana (2)/(4) 14,411 32.8 1.4 12.2 62 15,828 22.4 0.9 40.7<br />
Mototolo<br />
Tonnes milled<br />
10,003<br />
7,180<br />
1,098<br />
911<br />
(1) 85% owned<br />
(2) 50% Joint Venture<br />
(3) Tonnes milled for underground only<br />
(4) Tonnes milled for opencast only<br />
Refined Pt<br />
oz<br />
700.1<br />
177.4<br />
72.6<br />
83.9<br />
%<br />
29.3<br />
7.4<br />
3.0<br />
3.5<br />
Operating<br />
margin<br />
(%)<br />
35.3<br />
28.5<br />
31.7<br />
53.0<br />
2,212<br />
2,964<br />
622<br />
61<br />
Tonnes milled<br />
10,646<br />
4,187<br />
1,333<br />
901<br />
162.5<br />
94.2<br />
92.6<br />
FY07<br />
Refined Pt<br />
oz<br />
731.9<br />
%<br />
29.6<br />
6.6<br />
3.8<br />
3.7<br />
Operating<br />
margin<br />
(%)<br />
44.3<br />
45.7<br />
39.1<br />
57.4<br />
Total<br />
Capex<br />
2,179<br />
1,212<br />
431<br />
4,413<br />
513<br />
168<br />
210<br />
26<br />
128<br />
129<br />
77<br />
86<br />
18 Corporate Overview June 2009
Unique competitive advantages<br />
• Extensive high quality ore reserves<br />
• Expansion projects in place and ready to react to increased market demand<br />
• Extensive HDSA JV experience<br />
• Superior market intelligence<br />
• Conversion of all mining rights including at project level<br />
19 Corporate Overview June 2009
Strategy<br />
• Grow the market for <strong>Platinum</strong> Group Metals<br />
— nurture and grow PGM demand<br />
• Expand into market growth<br />
— establish and commission multiple greenfield and brownfield sites<br />
• Optimize value in current operations<br />
— optimize cost efficiency<br />
20 Corporate Overview June 2009
Unique metal market dynamics<br />
• Diverse application base<br />
• Balance of elastic and inelastic applications – beneficial price role<br />
• Geographically diverse demand<br />
2008: split of platinum demand by application<br />
Jewellery<br />
22%<br />
2008: split of platinum demand by region<br />
RoW<br />
16%<br />
Investment<br />
7%<br />
Autocatalysts (net)<br />
43%<br />
China<br />
20%<br />
Europe<br />
38%<br />
Industrial*<br />
28%<br />
*Includes Chemical, Electrical, Glass, Petroleum and Other<br />
Source: Johnson Matthey 2009 <strong>Platinum</strong> Review<br />
North America<br />
9%<br />
Japan<br />
17%<br />
21 Corporate Overview June 2009
<strong>Platinum</strong> supply & demand: 1998-2008<br />
8000<br />
7000<br />
Total Supply: 1999-2008 CAGR 2.3%<br />
Total Demand: 1999-2008 CAGR 1.4%<br />
6000<br />
‘000 ounces<br />
5000<br />
4000<br />
3000<br />
2000<br />
1000<br />
0<br />
1999 2000 2001 2002 2003 2004 2005 2006 2007 2008<br />
22 Corporate Overview June 2009
Autocatalyst demand driver: emissions legislation<br />
• Continued increase in diesel car popularity<br />
• Continued tighter legislation - Euro V 2009<br />
• Early voluntary particulate filter fitment<br />
• Heavy duty vehicle retrofitting - high loadings<br />
• Vehicle volume growth in China – medium term<br />
Emissions standards: Legislative horizon<br />
“China's economy and auto<br />
industry are continuing their<br />
steady growth amid the global<br />
economy slowing down”<br />
Toyota President Katsuaki<br />
Watanabe (19/04/09)<br />
“China during the last five<br />
years more than doubled its<br />
domestic automobile production,<br />
while US manufacturing has<br />
declined by nearly 50 per cent ”<br />
Egil Juliussen, Director and<br />
Fellow of Automotive Research<br />
23 Corporate Overview June 2009
PGMs for autocatalysts: Demand 1999-2008<br />
6000<br />
5000<br />
‘000 ounces<br />
4000<br />
3000<br />
Pt<br />
Pd<br />
Rh<br />
2000<br />
1000<br />
0<br />
1999 2000 2001 2002 2003 2004 2005 2006 2007 2008<br />
24 Corporate Overview June 2009
<strong>Platinum</strong> jewellery: demand drivers<br />
• Sophisticated marketing - PGI<br />
— focus on niche and new markets<br />
• High brand awareness<br />
• Strong bridal underpin<br />
• Unsaturated markets<br />
Unique beneficial effect on price<br />
25 Corporate Overview June 2009
Unique role of jewellery sector<br />
• ‘Shock absorber’ effect, at any price level<br />
— Jewellery demand: price elastic vs. Industrial demand: price inelastic<br />
— Demand balance results in lower price volatility<br />
• Price tension (upward pressure on price)<br />
— Strong consumer demand<br />
— Consumer has adjusted to higher prices over time<br />
— Chinese market low margin, high turnover, unsaturated<br />
Jewellery demand pleasing at current price levels<br />
26 Corporate Overview June 2009
<strong>Platinum</strong> jewellery market: Japan mature, China<br />
growing<br />
1600<br />
1400<br />
1200<br />
‘000 ounces<br />
1000<br />
800<br />
600<br />
Europe<br />
Japan<br />
North America<br />
China<br />
RoW<br />
400<br />
200<br />
0<br />
1999 2000 2001 2002 2003 2004 2005 2006 2007 2008<br />
27 Corporate Overview June 2009
Investment: A growing source of demand<br />
• <strong>Platinum</strong> and palladium ETFs introduced in April-May 2006 by ETF<br />
Securities and Zurcher Kantonal Bank<br />
• <strong>Platinum</strong> ETF holdings currently c.500k oz vs. peak in 2008 of c.450k oz<br />
• Palladium ETF holdings currently at record highs of c.830 k oz<br />
<strong>Platinum</strong> ETF positions to mid-May 2009 Palladium ETF positions to end April 2009<br />
28 Corporate Overview June 2009
Palladium: Outlook<br />
• Increasing autocatalyst demand<br />
• Palladium consumption growing from current levels as expected<br />
• Investment activity and Exchange Traded Funds continue to increase<br />
• Palladium use in diesel: 25% long term<br />
• Potential for further jewellery development<br />
• Overhang of stock remains<br />
29 Corporate Overview June 2009
Palladium supply & demand: 1999-2008<br />
Total Supply: 1999-2008 CAGR -1.1%<br />
16000<br />
Total Demand: 1999-2008 CAGR -8.4%<br />
14000<br />
12000<br />
‘000 ounces<br />
10000<br />
8000<br />
6000<br />
4000<br />
2000<br />
0<br />
1999 2000 2001 2002 2003 2004 2005 2006 2007 2008<br />
30 Corporate Overview June 2009
Investor Relations Contact<br />
Anna Poulter<br />
Direct line: +27 (0) 11 373 6683<br />
Mobile: +27 (0) 73 870 9032<br />
Email: apoulter@angloplat.com<br />
www.angloplatinum.com<br />
31 Corporate Overview June 2009


![[PDF] Mogalakwena Mine - Anglo Platinum](https://img.yumpu.com/43065142/1/184x260/pdf-mogalakwena-mine-anglo-platinum.jpg?quality=85)