Integrated Assessment Halaco Engineering Company ... - Archives
Integrated Assessment Halaco Engineering Company ... - Archives
Integrated Assessment Halaco Engineering Company ... - Archives

You also want an ePaper? Increase the reach of your titles
YUMPU automatically turns print PDFs into web optimized ePapers that Google loves.
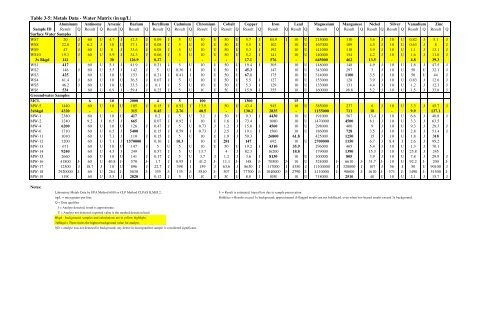
Table 3-5: Metals Data - Water Matrix (in ug/L)<br />
Aluminum Antinomy Arsenic Barium Beryllium Cadmium Chromium Cobalt Copper Iron Lead Magnesium Manganese Nickel Silver Vanadium Zinc<br />
Sample ID Result Q Result Q Result Q Result Q Result Q Result Q Result Q Result Q Result Q Result Q Result Q Result Q Result Q Result Q Result Q Result Q Result Q<br />
Surface Water Samples<br />
WS7 20 J 60 U 4.7 J 42.3 J 0.09 J 5 U 10 U 50 U 5.7 J 84.9 J 10 U 215000 110 3.6 J 10 U 0.82 J 5.1 J<br />
WS8 22.8 J 6.2 J 10 U 37.1 J 0.08 J 5 U 10 U 50 U 5.5 J 102 10 U 167000 109 4.5 J 10 U 0.63 J 8 J<br />
WS9 47 J 60 U 8 J 33.6 J 0.08 J 5 U 10 U 50 U 5.3 J 192 10 U 141000 118 3.9 J 10 U 1.1 J 13.1 J<br />
WS10 19.3 J 60 U 5.9 J 34.3 J 0.06 J 5 U 10 U 50 U 5.2 J 141 10 U 140000 154 4.2 J 10 U 1.6 J 11.8 J<br />
3x Bkgd 141 - 30 126.9 0.27 - - - - 17.1 576 - 645000 462 13.5 - 4.8 39.3<br />
WS1 417 60 U 5.1 J 41.9 J 0.21 J 5 U 10 U 50 U 19.4 J 305 10 U 148000 148 4.9 J 10 U 1.8 J 47.5 J<br />
WS2 148 J 60 U 5.5 J 142 J 5 U 0.36 J 10 U 50 U 45.3 147 10 U 343000 297 3 J 10 U 50 U 32.1 J<br />
WS3 425 60 U 10 U 153 J 0.21 J 0.41 J 10 U 50 U 67.1 175 10 U 314000 1100 3.5 J 10 U 50 U 44 J<br />
WS4 61.4 J 60 U 10 U 36.5 J 0.07 J 5 U 10 U 50 U 5.5 J 127 10 U 153000 128 3.9 J 10 U 0.83 J 12.6 J<br />
WS5 46.2 J 60 U 10 U 33.3 J 0.1 J 5 U 10 U 50 U 5.3 J 129 10 U 133000 131 4.4 J 10 U 1.2 J 12.3 J<br />
WS6 534 60 U 6.9 J 59.4 J 0.25 J 5 U 10 U 50 U 15.9 J 355 10 U 160000 98.8 5.2 J 10 U 1.5 J 33.8 J<br />
Groundwater Samples<br />
MCL 6 10 2000 4 5 100 1300 15<br />
MW-5 1440 60 U 10 U 105 J 0.15 J 0.92 J 13.5 50 U 43.4 945 10 U 385000 237 6 J 10 U 3.3 J 45.7 J<br />
3xbkgd 4320 - - 315 0.45 2.76 40.5 - 130.2 2835 - 1155000 711 18 - 9.9 137.1<br />
MW-1 2380 60 U 10 U 417 0.2 J 5 U 3.1 J 50 U 9.3 J 4430 10 U 191000 567 13.4 J 10 U 6.6 J 40.8 J<br />
MW-2 1240 9.2 J 6.5 J 665 0.07 J 0.92 J 10 U 1.6 J 73.4 1080 10 U 1470000 4500 8.1 J 10 U 3.3 J 63.5<br />
MW-4 6200 60 U 10 U 126 J 0.47 J 5 U 0.73 J 1.2 J 15.8 J 4560 10 U 298000 400 9 J 10 U 9.3 J 29.3 J<br />
MW-6 1710 60 U 6.5 J 5400 0.15 J 0.59 J 0.73 J 2.5 J 19.1 J 1560 10 U 186000 728 3.5 J 10 U 2.8 J 51.4 J<br />
MW-11 1010 60 U 7.3 J 110 J 0.15 J 5 U 10 U 1.9 J 59.3 26800 61.8 425000 1250 15 J 10 U 1.8 J 318<br />
MW-12 1200 60 U 7.1 J 1570000 0.16 J 10.3 10 U 281 147 692 10 U 2700000 1150 6.7 J 8.4 J 2.6 J 95.2<br />
MW-13 671 60 U 10 U 147 J 5 U 5 U 10 U 50 U 19.2 J 4310 35.9 296000 465 5.4 J 10 U 1.3 J 70.1<br />
MW-14 9240 60 U 4.5 J 249 0.57 J 5 U 13.7 4 J 82.3 16200 18.8 179000 1390 15.3 J 10 U 25.8 J 245<br />
MW-15 2660 60 U 10 U 141 J 0.17 J 5 U 3.7 J 1.2 J 3.6 J 8130 10 U 100000 805 3.9 J 10 U 7.8 J 29.9 J<br />
MW-16 41800 J- 60 U 40.8 J- 570 J- 1.7 J 0.95 J 41.2 J- 11.1 J- 148 J- 70500 J- 10 U 524000 J- 6610 J- 31.7 J- 10 U 92.2 J- 200 J-<br />
MW-17 12500 J 18.7 J 10 U 896 J 22.7 J 398 J 159 J 63.6 J 8630 J 117000 J 4350 J 11100000 J 328000 J 107 J 56 J 50 U 90100 J<br />
MW-18 2920000 J- 60 U 264 J- 5030 J- 355 J- 135 J- 3810 J- 307 J- 77700 J- 1040000 J- 2790 J- 4110000 J- 98600 J- 1610 J- 571 J- 1490 J- 51500 J-<br />
MW-19 1190 60 U 5.5 J 2020 0.12 J 5 U 10 U 50 U 8.8 J 1050 10 U 718000 2510 40 U 10 U 2.1 J 15.7 J<br />
Notes:<br />
Laboratory Metals Data by EPA Method 6010 or CLP Method CLPAS ILM05.2.<br />
ug/L = micrograms per liter.<br />
Q = Data qualifier<br />
J = Analyte detected, result is approximate.<br />
U = Analyte not detected; reported value is the method detection limit<br />
Bkgd - background; samples and calculations are in yellow highlight.<br />
3xBkgd = Three times the highest background value for analyte.<br />
ND = analyte was not detected in background; any detect in downgradient sample is considered significant.<br />
J- = Result is estimated, biased low due to sample preservation<br />
Boldface = Results exceed 3x background; approximated (J-flagged results are not boldfaced, even when low-biased results exceed 3x background.