Subevent analysis for the Tabas earthquake of September 16, 1978 ...
Subevent analysis for the Tabas earthquake of September 16, 1978 ...
Subevent analysis for the Tabas earthquake of September 16, 1978 ...

Create successful ePaper yourself
Turn your PDF publications into a flip-book with our unique Google optimized e-Paper software.
2 I. Sarkar et al. / Physics <strong>of</strong> <strong>the</strong> Earth and Planetary Interiors xxx (2005) xxx–xxx<br />
1. Introduction<br />
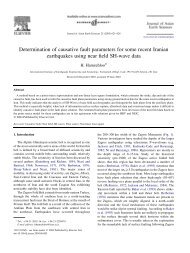
The large magnitude (m b = 6.4, M S = 7.7, M w = 7.4,<br />
M 0 = 1.32 × 10 20 ) <strong>Tabas</strong> <strong>earthquake</strong> that occurred on<br />
<strong>September</strong> <strong>16</strong>, <strong>1978</strong>, 15:35:56 UT, in <strong>the</strong> Khorassan<br />
province <strong>of</strong> east central Iran (Fig. 1a), is considered to<br />
be one <strong>of</strong> <strong>the</strong> most destructive regional events <strong>of</strong> <strong>the</strong><br />
20th century. It completely destroyed <strong>the</strong> oasis town<br />
<strong>of</strong> <strong>Tabas</strong>, killed more than 85% <strong>of</strong> its inhabitants and<br />
also caused intense havoc and destruction to <strong>the</strong> life and<br />
property <strong>of</strong> <strong>the</strong> inhabitants <strong>of</strong> several o<strong>the</strong>r neighboring<br />
towns and villages. According to damage survey reports,<br />
more than 20,000 people were killed, thousands<br />
were injured and more than 15,000 houses were destroyed<br />
in this disaster (Mohajer-Ashjai and Nowroozi,<br />
1979; Berbarian et al., 1979; Berbarian, 1982).<br />
Compared to <strong>the</strong> high rate <strong>of</strong> de<strong>for</strong>mation and intense<br />
seismic activity observed in <strong>the</strong> Zagros mountain<br />
Fig. 1. (a) Map <strong>of</strong> <strong>the</strong> <strong>Tabas</strong> <strong>earthquake</strong> epicentral area. The locations <strong>of</strong> <strong>the</strong> surface ruptures are adapted from Berbarian et al. (1979). The closed<br />
circles mark <strong>the</strong> locations <strong>of</strong> <strong>the</strong> nine strong motion stations whose data is analyzed in this study. The derived transverse wave accelerograms <strong>for</strong><br />
<strong>the</strong> main burst <strong>of</strong> energy (see text and (b)) are shown alongside <strong>the</strong> corresponding stations. Here <strong>the</strong> horizontal axis denotes time in seconds; <strong>the</strong><br />
vertical axis denotes <strong>the</strong> acceleration in cm/s 2 . The epicentral locations <strong>of</strong> <strong>the</strong> five sub events (marked with asterisks) and fault plane solutions<br />
<strong>of</strong> three <strong>of</strong> <strong>the</strong>se, as estimated in <strong>the</strong> study, are also shown. (b) The transverse accelerograms (‘SH-wave’ accelerograms’) <strong>for</strong> <strong>the</strong> main burst<br />
<strong>of</strong> energy, derived from rotating <strong>the</strong> horizontal accelerograms through <strong>the</strong> back azimuth angles from <strong>the</strong> S2 epicenter to <strong>the</strong> nine accelerograph<br />
stations (see text and also (a) and <strong>the</strong> corresponding velocity seismograms, are shown here. The six strong phases <strong>of</strong> energy release are identified<br />
distinctly on <strong>the</strong>se accelerograms and <strong>the</strong> corresponding velocity seismograms.