Efficiently Wasting Fuel - NAR Associates
Efficiently Wasting Fuel - NAR Associates
Efficiently Wasting Fuel - NAR Associates

You also want an ePaper? Increase the reach of your titles
YUMPU automatically turns print PDFs into web optimized ePapers that Google loves.
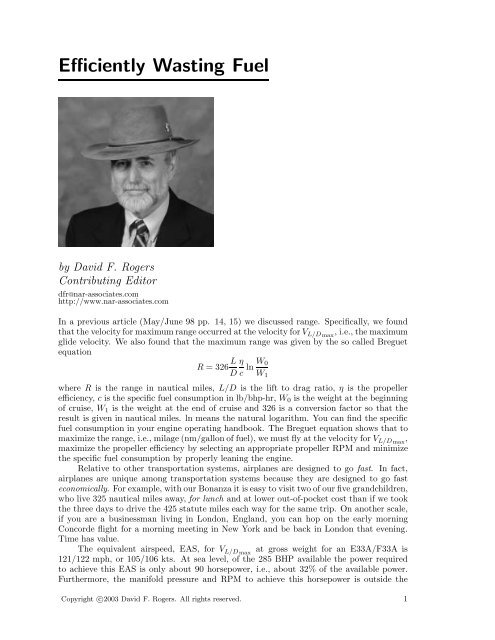
<strong>Efficiently</strong> <strong>Wasting</strong> <strong>Fuel</strong><br />
by David F. Rogers<br />
Contributing Editor<br />
dfr@nar-associates.com<br />
http://www.nar-associates.com<br />
In a previous article (May/June 98 pp. 14, 15) we discussed range. Specifically, we found<br />
that the velocity for maximum range occurred at the velocity for V L/D max<br />
, i.e., the maximum<br />
glide velocity. We also found that the maximum range was given by the so called Breguet<br />
equation<br />
R = 326 L η<br />
D c ln W 0<br />
W 1<br />
where R is the range in nautical miles, L/D is the lift to drag ratio, η is the propeller<br />
efficiency, c is the specific fuel consumption in lb/bhp-hr, W 0 is the weight at the beginning<br />
of cruise, W 1 is the weight at the end of cruise and 326 is a conversion factor so that the<br />
result is given in nautical miles. ln means the natural logarithm. You can find the specific<br />
fuel consumption in your engine operating handbook. The Breguet equation shows that to<br />
maximize the range, i.e., milage (nm/gallon of fuel), we must fly at the velocity for V L/D max<br />
,<br />
maximize the propeller efficiency by selecting an appropriate propeller RPM and minimize<br />
the specific fuel consumption by properly leaning the engine.<br />
Relative to other transportation systems, airplanes are designed to go fast. In fact,<br />
airplanes are unique among transportation systems because they are designed to go fast<br />
economically. For example, with our Bonanza it is easy to visit two of our five grandchildren,<br />
who live 325 nautical miles away, for lunch and at lower out-of-pocket cost than if we took<br />
the three days to drive the 425 statute miles each way for the same trip. On another scale,<br />
if you are a businessman living in London, England, you can hop on the early morning<br />
Concorde flight for a morning meeting in New York and be back in London that evening.<br />
Time has value.<br />
The equivalent airspeed, EAS, for V L/D max<br />
at gross weight for an E33A/F33A is<br />
121/122 mph, or 105/106 kts. At sea level, of the 285 BHP available the power required<br />
to achieve this EAS is only about 90 horsepower, i.e., about 32% of the available power.<br />
Furthermore, the manifold pressure and RPM to achieve this horsepower is outside the<br />
Copyright c○2003 David F. Rogers. All rights reserved. 1
ecommended continuous cruise settings in the POH. In addition, at this low velocity and<br />
propeller RPM the propeller efficiency is not optimum and the specific fuel consumption is<br />
actually higher than at higher propeller RPM. Besides, if we wanted to cruise at 105 kts we<br />
would not fly a Bonanza.<br />
The chief reason that a fundamental mismatch between the available power installed<br />
in an aircraft and that required for efficient cruise is that an aircraft must be able to climb.<br />
Climbing requires excess power over that required to maintain level flight. The real question,<br />
then, is how do we use this excess power to fly fast economically<br />
In the early 1980s B. H. Carson, a long time colleague, answered this question. † He<br />
noted that the power required to maintain level flight, P req , is proportional to the rate at<br />
which energy (fuel), E, is expended per unit time, t. He then related the energy expended<br />
per unit distance traveled, s, to the power required divided by the velocity. The power<br />
required divided by the velocity, V , is just the drag, D, which can be related to the weight,<br />
W , times the lift to drag ratio, L/D. Mathematically, we write this as<br />
dE ( dE )( dt )<br />
ds = dt ds<br />
= P req<br />
V = D = W<br />
L/D = W D L<br />
From this we again see that, for a given weight, the range, R, is maximized when the lift to<br />
drag ratio is maximized because the expenditure of fuel per unit distance is minimized. The<br />
designer’s dilemma is to maximize the lift to drag ratio while efficiently using the excess<br />
power required for climb to fly fast in cruise. Returning to our familiar power required<br />
equation and dividing by the velocity clarifies the dilemma<br />
P r<br />
V = D = D L W = σρ SL<br />
2 fV 2 + 2 1 ( W ) 2 1<br />
σρ<br />
} {{ } SL πe b V<br />
} {{ 2<br />
}<br />
parasite effective induced<br />
Dividing by the weight, W yields<br />
where<br />
D<br />
L = σρ SL f<br />
2 W V 2 + 2 1<br />
σρ SL πe<br />
A = σρ SL<br />
2<br />
W<br />
b 2 1<br />
V 2 = AV 2 + B V 2<br />
f<br />
W ; B = 2 1 W<br />
σρ SL πe b 2<br />
Now, to maximize the lift to drag ratio, L/D, the drag to lift ratio, D/L, needs to be<br />
minimized. From the above equation this is accomplished by making both A and B as<br />
small as possible. Well, that is not going to happen. Here is why. Suppose the weight,<br />
W , is decreased to make B smaller, but then A becomes larger. Suppose the altitude, σ,<br />
is increased to make A smaller, but then B becomes larger because σ, the density ratio,<br />
becomes smaller. Ah ha, you say the wing span, b, only appears in B and we can make B<br />
smaller by increasing the span, i.e., the aspect ratio. But, if the span is increased, then the<br />
area of the wing skin is increased which increases the parasite (skin friction) drag, which in<br />
turn increases A. The weight of the wing also increases to support the longer span, hence B<br />
increases. Finally, e, the Oswald or airplane efficiency factor, stubbornly sticks to a range<br />
from about 0.6 to 0.8, so it is not much help.<br />
As a result, because the designer needs to meet a rate-of-climb requirement, or requires<br />
additional thrust or power available at sea level to meet a high altitude cruise requirement<br />
and because, as we saw above, the velocity for maximum lift to drag ratio cannot be<br />
increased to meet the high speed cruise requirement, aircraft cruise at nonoptimum high<br />
speeds.<br />
† Carson, B. H. <strong>Fuel</strong> Efficiency of Small Aircraft, AIAA J. of Aircraft, Vol. 19, No. 6, pp. 473–479, June<br />
1982.<br />
Copyright c○2003 David F. Rogers. All rights reserved. 2
Carson asked the question “What is the unit cost in increased fuel consumption for<br />
each unit increase in speed” His results showed that the best rate of return for increased<br />
fuel consumption as a result of increased cruise speed was<br />
V cruise =(3) 1/4 V L/D max<br />
=1.32V L/D max<br />
while the increase in fuel consumption was 2/ √ 3=1.16, i.e., a 32% increase in cruise TAS<br />
for just a 16% increase in fuel consumption. The increase in cruise TAS resulted in a 52%<br />
increase in power required and a 24% decrease in the flight time. From this one can also<br />
conclude that the value of a 24% decrease in flight time is worth the cost of an additional<br />
16% for fuel. V cruise has become known as the Carson cruise, e.g., CAFE (Comparative<br />
Aircraft Flight Efficiency) calculates the Carson cruise speed when evaluating an aircraft.<br />
Table 1 True Airspeeds (kts)<br />
Altitude V L/D max<br />
V cruise 75% 65% 55%<br />
feet<br />
BHP BHP BHP<br />
0 105 139 163 154 143<br />
2000 108 143 166 157 146<br />
4000 112 147 169 159 148<br />
6000 115 152 172 162 149<br />
8000 119 156 171* 164* 151<br />
10000 122 161 169* 161* 150*<br />
12000 126 166 166* 158* 146*<br />
14000 131 172 163* 158* 141*<br />
From a practical viewpoint, how do we apply the Carson cruise results to every day<br />
operation First, as shown in Table 1, remember that the true airspeed for L/D max increases<br />
with increasing altitude. Hence, the Carson cruise true airspeed also increases with<br />
increasing altitude. Also shown in Table 1 are the true airspeeds for 75% (2500 RPM),<br />
65% (2300 RPM) and 55% (2100 RPM) BHP (brake horsepower) taken from the POH for<br />
a 285 BHP model E33A Bonanza for a weight of 3100 lbs. The asterisks indicate operation<br />
at full throttle and the indicated fixed RPM, i.e., at less than the indicated percentage of<br />
BHP. Comparing the V cruise true airspeeds and those for 75% BHP, we see that at 12,000<br />
feet the true airspeeds are equal at 166 kts. Similarly, for 65% BHP the true airspeeds are<br />
equal at 10,000 feet pressure altitude at 161 kts. At 55% BHP, note that the true airspeeds<br />
do not match at any altitude. Thus, at 55% BHP (2100 RPM) flight at the Carson cruise<br />
true airspeed is not possible at any altitude. This is not surprising. Note that for both<br />
75% BHP (2500 RPM) and 65% BHP (2300 RPM) operation is at full throttle and a fixed<br />
RPM, hence at less than the indicated percentage of brake horsepower. Carefully checking<br />
the altitude performance curves from the POH shows that operation at both 2500 RPM<br />
and 2300 RPM at full throttle at the required altitudes yields about 59% BHP.<br />
Normally aspirated reciprocating engine propeller combinations have a critical altitude<br />
at which they can maintain a specified percentage of sea level BHP. This critical altitude<br />
is sometimes called the knee of the altitude-true airspeed curve. For a given percentage of<br />
sea level BHP, the knee represents the most efficient operating condition, i.e., the highest<br />
TAS for a given percentage of sea level BHP and hence fuel expended. As an example, for<br />
a model E33A at a weight of 3100 pounds at 65% BHP on a standard day the knee of the<br />
curve occurs at approximately 7600 feet pressure altitude and yields a TAS of 164 kts.<br />
By comparing the Carson cruise TAS, V cruise , and the knee velocity, V knee , as a function<br />
of percent BHP using the two curves in the lower plot of Figure 1, we see that the two curves<br />
cross at approximately 58.6% BHP, yielding a TAS of approximately 157 kts (180 mph).<br />
Copyright c○2003 David F. Rogers. All rights reserved. 3
For 58.6% BHP, the knee in the altitude vs TAS curve occurs at a pressure altitude of<br />
approximately 8300 feet, as shown by the upper plot in Figure 1. For this power the<br />
approximate fuel flow is 12.5 gph, which yields a milage of approximately 12.6 nautical<br />
miles per gallon (14.5 statute miles per gallon). Compared to an SUV that gets about the<br />
same mileage, weighs about the same but moves at 40% of the speed and typically has to<br />
cover a 20% greater distance to get from point A to point B, that’s not too shabby.<br />
Knee altitude (ft)<br />
9000<br />
8000<br />
7000<br />
h cruise<br />
6000<br />
TAS (kts)<br />
175<br />
150<br />
Vcruise<br />
Vknee<br />
125<br />
45 50 55 60 65 70 75<br />
Percent BHP<br />
Figure 1. V cruise and h cruise vs percent brake horsepower available.<br />
Copyright c○2003 David F. Rogers. All rights reserved.<br />
Dave Rogers’ previous articles are available through a link at his website at www.nar-associates.com.<br />
Copyright c○2003 David F. Rogers. All rights reserved. 4