Gear and Flaps Down Part 2 - NAR Associates
Gear and Flaps Down Part 2 - NAR Associates
Gear and Flaps Down Part 2 - NAR Associates

You also want an ePaper? Increase the reach of your titles
YUMPU automatically turns print PDFs into web optimized ePapers that Google loves.
<strong>Gear</strong> <strong>and</strong> <strong>Flaps</strong> <strong>Down</strong><br />
<strong>Part</strong> 2<br />
DavidF.Rogers,PhD,ATP<br />
Copyright c○ 1996 by David F. Rogers. All rights reserved.<br />
In our previous discussion of the effects of lowering the gear <strong>and</strong> flaps (<strong>Gear</strong> & <strong>Flaps</strong> <strong>Part</strong> 1) we<br />
found that the velocity (TAS) for maximum glide distance V L/Dmax decreases by approximately<br />
16%, i.e., from 122 mph to approximately 103 mph for a model 33 Bonanza, if we assumed that<br />
lowering the flaps doubles the equivalent flat plate area f. We also found that the velocity for<br />
maximum glide distance decreased by approximately 24% to 93 mph if we assumed that lowering<br />
both the gear <strong>and</strong> flaps tripled the equivalent flat plate area.<br />
We continue our discussion by asking what happens to the velocity for maximum rate-of-climb <strong>and</strong><br />
to the actual rate-of-climb when we lower the flaps <strong>and</strong>/or gear. This is important when we have<br />
to execute a go around at the last minute – for example, when a cow walks out onto the runway<br />
when we are over the numbers at 20 feet. Don’t laugh, it happened to me!<br />
Again, the clue is to look at the effect of an increase in equivalent flat plate area on the power<br />
required versus velocity (TAS) curves. For completeness, recall from our earlier discussion that the<br />
equation for power required to maintain steady level flight is given by<br />
P r = σρ SL<br />
2 fV 3 + 2 1 ( W ) 2 1<br />
σρ SL πe b V<br />
where<br />
b is the wing span.<br />
e is the so called Oswald efficiency factor.<br />
f is the equivalent parasite drag area,<br />
or the equivalent flat plate area.<br />
W is the weight of the aircraft.<br />
V is the true airspeed (TAS).<br />
ρ SL is the density at sea level.<br />
σ is the ratio of the density at altitude to<br />
that at sea level ρ/ρ SL .<br />
Furthermore, recall that the minimum power required to maintain steady level flight is given by<br />
P rmin =2.48 f 1/4<br />
√<br />
σρSL<br />
( 1<br />
πe) 3/4 ( W<br />
b<br />
<strong>and</strong> the velocity for minimum power required by<br />
V Prmin =<br />
√ √<br />
( 4 ) 1/4 1 W<br />
3πfe σρ SL b<br />
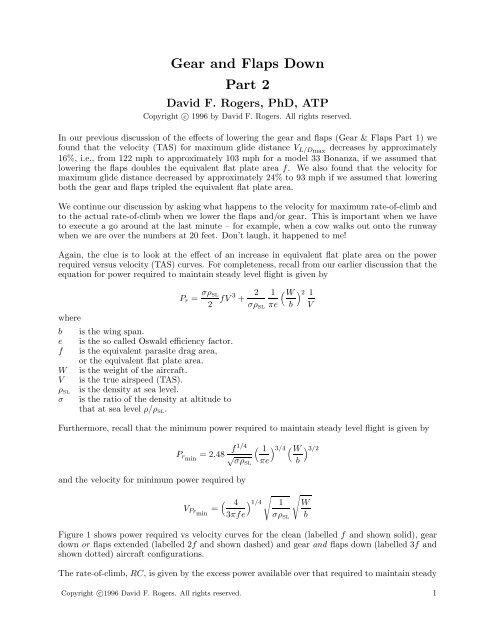
Figure 1 shows power required vs velocity curves for the clean (labelled f <strong>and</strong> shown solid), gear<br />
down or flaps extended (labelled 2f <strong>and</strong> shown dashed) <strong>and</strong> gear <strong>and</strong> flaps down (labelled 3f <strong>and</strong><br />
shown dotted) aircraft configurations.<br />
The rate-of-climb, RC, is given by the excess power available over that required to maintain steady<br />
Copyright c○1996 David F. Rogers. All rights reserved. 1<br />
) 3/2
350<br />
300<br />
E33A<br />
W = 3300 lbs<br />
Sea Level<br />
3f<br />
2f<br />
f<br />
Power (hp)<br />
250<br />
200<br />
150<br />
Thrust power<br />
available<br />
100<br />
Power required<br />
50<br />
0<br />
0 50 100 150 200 250<br />
Velocity (mph)<br />
Figure 1.<br />
Thrust power available (constant) <strong>and</strong> power required versus velocity.<br />
level flight divided by the weight of the aircraft. Expressed as an equation this is<br />
rate-of-climb =<br />
power available − power required<br />
weight<br />
The rate-of-climb equation is not quite as simple as it looks. The power available is in fact the<br />
Thrust Power Available. The thrust power available is the power delivered by the engine <strong>and</strong><br />
propeller combination. A propeller is not 100% efficient in converting the power available at the<br />
engine propeller shaft to thrust. Consequently, we must account for propeller efficiency. The thrust<br />
power available, ThP a , is the engine power at the propeller shaft, P a , multiplied by the propeller<br />
efficiency, η (eta), i.e.,<br />
ThP a = ηP a<br />
Thus, our rate-of-climb equation is<br />
RC = ThP a − P r<br />
W<br />
For a given propeller, at a given RPM, the efficiency of the propeller depends on the velocity<br />
of the aircraft. However, as a first approximation we can consider the propeller efficiency to be<br />
constant. At the low velocities associated with a go around, the propeller efficiency is quite low. A<br />
good number is about 70% (see Fig. (2)). Therefore, to get an approximation to the thrust power<br />
Copyright c○1996 David F. Rogers. All rights reserved. 2
available for a model 33A we multiply 285 hp by 0.7. The result is 199.5 horsepower, that is, just<br />
under 200 horsepower. This is shown as a dotted straight line in Fig. (1).<br />
Looking at Fig. (1) <strong>and</strong> recalling our rate-of-climb eqauation shows that the maximum rate-ofclimb<br />
occurs for minimum power required at the velocity for minimum power required. Figure 1<br />
also shows that the velocity for maximum rate-of-climb, given by the largest distance between the<br />
thrust power available <strong>and</strong> power required curves, decreases when the equivalent flat plate area, f,<br />
increases, that is, when we lower the gear <strong>and</strong>/or flaps. Our velocity for minimum power required<br />
equation then shows that the ratio of V RCmax dirty, i.e., with gear <strong>and</strong>/or flaps down, to that in<br />
the clean configuration is<br />
V RCmax ( (dirty) fclean<br />
) 1/4<br />
=<br />
V RCmax (clean)<br />
f dirty<br />
Recall that lowering the gear or flaps approximately doubles the equivalent flat plate area, f. Thus,<br />
with the gear down or the flaps extended<br />
V RCmax ( (dirty) 1 ) 1/4<br />
= =0.84<br />
V RCmax (clean)<br />
2<br />
0.9<br />
0.8<br />
E33A<br />
McCauley 3-blade<br />
Full throttle<br />
2700 RPM<br />
Sea Level<br />
Propeller efficiency<br />
0.7<br />
0.6<br />
0.5<br />
0 50 100 150 200 250<br />
Velocity (mph)<br />
Figure 2.<br />
Propeller efficiency versus velocity.<br />
Copyright c○1996 David F. Rogers. All rights reserved. 3
which shows that V RCmax (dirty)<br />
decreases by approximately 16% from the clean configuration.<br />
Lowering the gear <strong>and</strong> extending the flaps to 30 ◦ approximately triples the equivalent flat plate<br />
area, f. For this configuration<br />
V RCmax ( (dirty) 1 ) 1/4<br />
= =0.76<br />
V RCmax (clean)<br />
3<br />
which shows that V RCmax (dirty)<br />
decreases by approximately 24% from the clean configuration.<br />
These are significant effects. Notice that these are exactly the same factors by which the best glide<br />
velocity decreases when the gear <strong>and</strong>/or flaps are extended.<br />
What these results tell us is that with gear down <strong>and</strong> flaps extended the aircraft must be flown at<br />
the correct (lower) velocity to achieve the maximum rate-of-climb.<br />
We now want to investigate the effect of flying the aircraft at the incorrect velocity for the maximum<br />
rate-of-climb. To do this we need to more accurately consider the variation of propeller efficiency<br />
with velocity. For a typical McCauley 80 inch diameter constant-speed three blade propeller, the<br />
propeller efficiency, η, at full throttle <strong>and</strong> 2700 rpm at sea level is shown in Figure 2. Notice that<br />
the efficiency is quite low at low velocities <strong>and</strong> reaches a maximum of about 88-90% for typical<br />
cruise velocities. The effect of the variation of propeller efficiency with velocity on the curve of<br />
thrust power available is shown as the dotted line in Fig. (3).<br />
Recalling the rate-of-climb equation shows that taking the difference between the thrust power<br />
available curve <strong>and</strong> the power required curves at a given velocity <strong>and</strong> dividing by the weight yields<br />
the rate-of-climb at that velocity.<br />
The rate-of-climb curves for the clean configuration (labelled f <strong>and</strong> shown solid), gear down or.<br />
flaps extended (labelled 2f <strong>and</strong> shown dashed) <strong>and</strong> gear <strong>and</strong> flaps down (labelled 3f <strong>and</strong> shown<br />
dotted) are given in Fig. (4). Zero rate-of-climb is indicated by the horizontal dotted line. Because<br />
of the variation of propeller efficiency with velocity the velocity for maximum rate-of-climb is higher<br />
than given by our earlier approximate results.<br />
For example, with gear down <strong>and</strong> flaps extended our results indicate that maximum rate-of-climb<br />
is approximately 810 fpm at approximately 89 mph. However, the POH (old version) gives the<br />
velocity for best rate-of-climb gear <strong>and</strong> flaps down as 77 mph. Our results appear to be about<br />
13% too high. The explanation is that our rate-of-climb equation does not account for the upward<br />
inclination of the thrust produced by the propeller nor for the effect of the propeller slip stream<br />
on the wing. The detailed analysis is too complex to go into here, but we can estimate the effects<br />
of propeller thrust indirectly. For an E33A the POH (old version) gives the gross weight stalling<br />
velocity gear <strong>and</strong> flaps down power off as 61 mph <strong>and</strong> power on as 46 mph.<br />
The corresponding values for gear <strong>and</strong> flaps up are 72 mph <strong>and</strong> 57 mph. Thus, the effect of power is<br />
to reduce the stalling velocity 20-25%. Because the velocities for maximum rate-of-climb are higher<br />
than the stall velocities, the effect of power is decreased by about 50%. Using a 13% reduction in<br />
the calculated velocity for maximum rate-of-climb yields the value given in the POH. Incidentally<br />
77 mph is the experimental value for 4000 feet published by Taylor <strong>and</strong> Guinther in Positive Flying,<br />
+ a book that I recommend.<br />
What is most important from all this discussion is to note that flying at either too slow or too<br />
high a velocity degrades the climb performance. Also, note that maximum rate-of-climb occurs<br />
+ Richard L. Taylor <strong>and</strong> William M. Guinther, Positive Flying, MacMillan, New York, 1978.<br />
Copyright c○1996 David F. Rogers. All rights reserved. 4
350<br />
300<br />
E33A<br />
W = 3300 lbs<br />
Sea Level<br />
3f<br />
2f<br />
f<br />
Power (hp)<br />
250<br />
200<br />
150<br />
100<br />
Thrust power available<br />
Power required<br />
Maximum<br />
velocity<br />
50<br />
0<br />
0 50 100 150 200 250<br />
Velocity (mph)<br />
Figure 3.<br />
Power available (variable) <strong>and</strong> power required versus velocity.<br />
for a significantly lower velocity with the gear <strong>and</strong> flaps extended than in the clean configuration.<br />
Finally, a word of caution. In order to simplify the discussion I make assumptions, for example<br />
above I neglected the effects of thrust inclination on the rate-of-climb. Consequently, the numbers<br />
that result are not always exact. Thus, you should follow the procedures in the POH; after all,<br />
Beech has more complete data. The principles are the most important result.<br />
For operational considerations, note that as we clean up the aircraft by retracting the gear <strong>and</strong> flaps<br />
we need to allow the aircraft to accelerate to a higher velocity to achieve maximum rate-of-climb.<br />
Because flap retraction speed is generally slower than gear retraction speed for a model 33, <strong>and</strong><br />
opening the inner gear doors to retract the gear increases the drag, these results indicate that we<br />
should retract the flaps first <strong>and</strong> then the gear as we clean up the aircraft <strong>and</strong> allow it to accelerate<br />
<strong>and</strong> simultaneously adjust the pitch to maintain the velocity for maximum rate-of-climb.<br />
Fortunately, for those of us who fly with the 285 hp engine there is a wide range of velocities that<br />
result in a positive rate-of-climb in the dirty configuration at sea level. However, as the density<br />
altitude increases the rate-of-climb versus velocity curves (in terms of indicated airspeed) essentially<br />
move downward. The result is a narrowing of the range of velocities that achieve a positive rateof-climb.<br />
Furthermore, there is an altitude above which the aircraft will not climb in the dirty<br />
Copyright c○1996 David F. Rogers. All rights reserved. 5
1500<br />
1000<br />
E33A<br />
W = 3300 lbs<br />
Sea Level<br />
500<br />
Rate-of-climb (fpm)<br />
-500<br />
0<br />
-1000<br />
-1500<br />
0 50 100 150 200 250<br />
Velocity (mph)<br />
3f<br />
2f<br />
f<br />
Figure 4.<br />
Rate-of-climb versus velocity.<br />
configuration. Thus, precise speed control <strong>and</strong> attention to cleaning up the aircraft become more<br />
important. We’ll look at density altitude effects in Altitude Effects, <strong>Part</strong> 1.<br />
Copyright c○1996 David F. Rogers. All rights reserved. 6