TABLE 6.8 MINERAL PRODUCTION, BHUTAN, 2005 TO 2008 2005 2006 2007 2008 Minerals Export Domestic Total Export Domestic Total Export Domestic Total Export Domestic use use use use Dolomite (metric tonnes) Lime stone (metric tonnes) Gypsum (metric tonnes) Coal mines (metric tonnes) Marble (square feet) Slate ( square feet) Quartzite (metric tonnes) Talc (metric tonnes) Iron Ore ( metric tonnes) Pink & green Shale (mt) Stone (metric tonnes Granite ( square feet) 388,637 86,996 115,646 48,377 n.a n.a 9,193 42,738 n.a 364 25,626 n.a 74 449,034 34,940 36,902 4,005 2,909 43,501 53 5,679 n.a 121,142 9,436 388,711 536,030 150,585 85,279 4,005 2,909 52,694 42,791 5,679 364 146,767 9,436 472982.21 90028.94 168116.37 65545.15 n.a n.a 8402.81 54208.24 n.a 360.30 70783.22 n.a 3,533.87 491304.04 36081.79 32420.31 3813.40 5873.06 31794.84 n.a n.a n.a 161403.88 8,310.90 476,516.08 581332.98 204198.16 97965.46 3,813.40 5,873.06 40,197.65 54,208.24 n.a 360.30 232,187.10 8,310.90 573554.38 96836.28 150799.22 75365.78 n.a n.a 1805.29 62014.77 n.a n.a 101576.89 n.a 4997.19 447127.30 38399.07 29895.03 12070.80 78107.17 62243.30 n.a n.a n.a 287143.75 14430.33 578551.57 543963.58 189198.29 105260.81 12070.80 78107.17 64048.59 62014.77 n.a n.a 388720.64 14430.33 1242638.00 89059.23 210080.80 80975.99 n.a n.a 4122.63 56077.39 n.a n.a 121967.86 n.a 4930.11 494647.40 38363.90 42728.24 12301.06 8226.89 90565.02 n.a n.a n.a 286975.25 8,226.89 Source: Department of Gelogy and Mines, MoEA, Thimphu Total 1,247,568.11 583,706.63 248,444.70 123,704.23 12,301.06 8,226.89 94,687.65 56,077.39 n.a n.a 408,943.11 8,226.89 102 NSB STATISTICAL YEARBOOK OF BHUTAN 2009 C M Y K
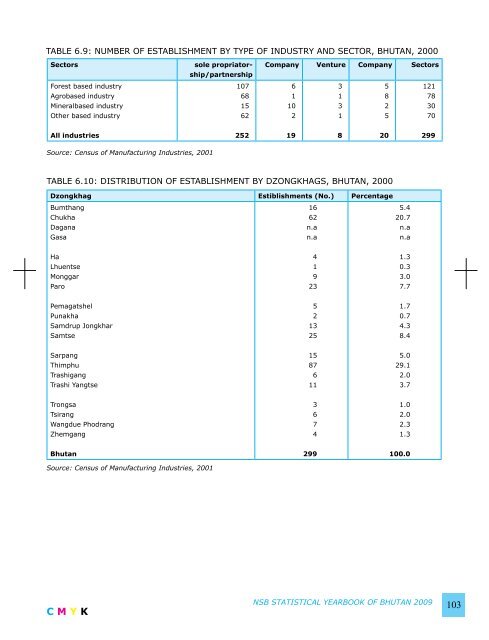
TABLE 6.9: NUMBER OF ESTABLISHMENT BY TYPE OF INDUSTRY AND SECTOR, BHUTAN, 2000 Sectors Forest based industry Agrobased industry Mineralbased industry Other based industry sole propriatorship/partnership 107 68 15 62 Company Venture Company Sectors 6 3 5 121 1 1 8 78 10 3 2 30 2 1 5 70 All industries 252 19 8 20 299 Source: Census of Manufacturing Industries, 2001 TABLE 6.10: DISTRIBUTION OF ESTABLISHMENT BY DZONGKHAGS, BHUTAN, 2000 Dzongkhag Estiblishments (No.) Percentage Bumthang Chukha Dagana Gasa 16 62 n.a n.a 5.4 20.7 n.a n.a Ha Lhuentse Monggar Paro 4 1 9 23 1.3 0.3 3.0 7.7 Pemagatshel Punakha Samdrup Jongkhar Samtse 5 2 13 25 1.7 0.7 4.3 8.4 Sarpang Thimphu Trashigang Trashi Yangtse 15 87 6 11 5.0 29.1 2.0 3.7 Trongsa Tsirang Wangdue Phodrang Zhemgang 3 6 7 4 1.0 2.0 2.3 1.3 Bhutan Source: Census of Manufacturing Industries, 2001 299 100.0 C M Y K NSB STATISTICAL YEARBOOK OF BHUTAN 2009 103
- Page 1 and 2:
།ལ་ཡོངས་ས་ད
- Page 3 and 4:
NOTES FOR USERS 1. Unless otherwise
- Page 5 and 6:
KEY FACTS ABOUT BHUTAN Land area 38
- Page 7 and 8:
Gamrichu about 2km below Rolong. Fr
- Page 9 and 10:
the executive power by His Majesty
- Page 11 and 12:
Foreword Notes for users Key Facts
- Page 13 and 14:
CHAPTER 5: LAND USE AND AGRICULTURE
- Page 15 and 16:
CHAPTER 9: TOURISM 113 TABLE 9.1: A
- Page 17 and 18:
15.6: Consumer price indexes for fo
- Page 19 and 20:
of 196,111 persons while 438,871 ar
- Page 21 and 22:
TABLE 1.2: PROJECTED POPULATION (NU
- Page 23 and 24:
TABLE 1.6: PROJECTED POPULATION (NU
- Page 25 and 26:
TABLE 1.9: PROJECTED POPULATION (NU
- Page 27 and 28:
TABLE 1.13: PROJECTED POPULATION (N
- Page 29 and 30:
TABLE 1.16: PROJECTED POPULATION (N
- Page 31 and 32:
TABLE 1.18: PROJECTED POPULATION (N
- Page 33 and 34:
TABLE 1.20: PROJECTED POPULATION (N
- Page 35 and 36:
266,164 97,514 63,039 61,001 60,510
- Page 37 and 38:
TABLE 2.3: HEALTH PERSONNEL BY CATE
- Page 39 and 40:
TABLE 2.6 (contd..): MORBIDITY CASE
- Page 41 and 42:
TABLE 2.7 (contd..): HOSPITAL MORBI
- Page 43 and 44:
TABLE 2.8: HOSPITAL INDOOR MORBIDIT
- Page 45 and 46:
TABLE 2.8: HOSPITAL INDOOR MORBIDIT
- Page 47 and 48:
TABLE 2.10: EPI COVERAGE IN PERCENT
- Page 49 and 50:
TABLE 2.13 (contd..): DETAILS OF MA
- Page 51 and 52: TABLE 2.15: FAMILY PLANNING ACCEPTO
- Page 53 and 54: CHAPTER 3 EDUCATION The introductio
- Page 55 and 56: TABLE 3.1: NUMBER OF SCHOOLS AND IN
- Page 57 and 58: TABLE 3.4: NUMBER OF EDUCATIONAL FA
- Page 59 and 60: TABLE 3.6: NUMBER OF EDUCATIONAL FA
- Page 61 and 62: TABLE 3.8: NUMBER OF STUDENTS IN HI
- Page 63 and 64: TABLE 3.10: NUMBER OF STUDENTS BY G
- Page 65 and 66: Figure 4.1: Percentage Distribution
- Page 67 and 68: TABLE 4.2: PERCENTAGE DISTRIBUTION
- Page 69 and 70: TABLE 4.5: UNEMPLOYED PERSONS BY AG
- Page 71 and 72: TABLE 4.8: ALL EMPLOYED PERSONS WOR
- Page 73 and 74: TABLE 4.11: NUMBER OF CHILDREN AGED
- Page 75 and 76: Figure 5.1: Land Use by Type, Bhuta
- Page 77 and 78: TABLE 5.2: PERCENTAGE OF AREA BY DZ
- Page 79 and 80: TABLE 5.4: PERCENTAGE OF TOTAL AREA
- Page 81 and 82: 81 C M Y K NSB STATISTICAL YEARBOOK
- Page 83 and 84: 83 C M Y K NSB STATISTICAL YEARBOOK
- Page 85 and 86: TABLE 5.7: NUMBER OF AGRICULTURE RE
- Page 87 and 88: TABLE 5.9: POWER TILLER TRACKS DEVE
- Page 89 and 90: TABLE 5.13: CULTIVATED AREA, PRODUC
- Page 91 and 92: TABLE 5.15: NUMBER OF LIVESTOCK BY
- Page 93 and 94: TABLE 5. 18: QUANTITY AND VALUE OF
- Page 95 and 96: TABLE 5. 18(contd.): QUANTITY AND V
- Page 97 and 98: CHAPTER 6 INDUSTRIES The subject
- Page 99 and 100: TABLE 6.3 NUMBER OF INDUSTRIES BY S
- Page 101: TABLE 6.7 MINERAL PRODUCTION FROM M
- Page 105 and 106: TABLE 6.12: NUMBER OF PERSONS ENGAG
- Page 107 and 108: Services. Since then, the informati
- Page 109 and 110: TABLE 7.2 LENGTH OF ROADS BY TYPE A
- Page 111 and 112: TABLE 7.4 NUMBER OF SUPENSION BRIDG
- Page 113 and 114: TABLE 7.7 NUMBERS OF PASSENGERS CAR
- Page 115 and 116: 115 C M Y K NSB STATISTICAL YEARBOO
- Page 117 and 118: TABLE 7.9 (contd.) TELEPHONE CONNEC
- Page 119 and 120: TABLE 7.10(contd..) NUMBER OF TELEP
- Page 121 and 122: TABLE 7.14 NUMBER OF COMMUNICATION
- Page 123 and 124: CHAPTER 8 ENERGY The major source o
- Page 125 and 126: TABLE 8.1(contd.) ELECTRICITY GENER
- Page 127 and 128: TABLE 8.3 MAJOR TRANSMISSION LINES
- Page 129 and 130: TABLE 8.6 MONTHLY REVENUE FROM SALE
- Page 131 and 132: TABLE 9.1 ANNUAL TOURIST ARRIVALS B
- Page 133 and 134: TABLE 9.2 TOURIST ARRIVALS BY COUNT
- Page 135 and 136: CHAPTER 10 FOREIGN TRADE AND BALANC
- Page 137 and 138: TABLE 10.3: VALUE AND ITS PERCENTAG
- Page 139 and 140: TABLE 10.6: GROSS INTERNATIONAL RES
- Page 141 and 142: TABLE 11.1: MONETARY SURVEY: ROYAL
- Page 143 and 144: TABLE 11.4: MONEY AND BANKING DATAI
- Page 145 and 146: TABLE 11.7: (contd..) INVESTMENTS O
- Page 147 and 148: TABLE 11.9: INTEREST RATES AND REPA
- Page 149 and 150: TABLE 11.11: ROYAL SECURITIES EXCHA
- Page 151 and 152: TABLE 11.13: ROYAL SECURITIES EXCHA
- Page 153 and 154:
TABLE 12.1: RECURRENT BUDGETARY EXP
- Page 155 and 156:
TABLE 12.3: BUDGETARY RECEIPTS OF T
- Page 157 and 158:
TABLE 13.1: TENTH PLAN BUDGETARY OU
- Page 159 and 160:
TABLE 13.4: DZONGKHAG WISE NINTH FI
- Page 161 and 162:
TABLE 14.1: GROSS DOMESTIC PRODUCT
- Page 163 and 164:
TABLE 14.5: GROSS DOMESTIC PRODUCT
- Page 165 and 166:
TABLE 14.10: EXPENDITURES ON GROSS
- Page 167 and 168:
TABLE 15.1 CONSUMER PRICE INDEXES F
- Page 169 and 170:
TABLE 15.3 CONSUMER PRICE INDEXES -
- Page 171 and 172:
TABLE 15.5 CONSUMER PRICE INDEXES F
- Page 173 and 174:
TABLE 15.7 CONSUMER PRICE INDEXES,
- Page 175 and 176:
TABLE 16.1: SUMMURY OF CRIME REPORT
- Page 177 and 178:
TABLE 16.2 (contd.): DETAILS OF CRI
- Page 179 and 180:
TABLE 16.2 (contd.): DETAILS OF CRI
- Page 181 and 182:
TABLE 16.2 (contd.): DETAILS OF CRI
- Page 183 and 184:
TABLE 16.4: (Contd..)CAUSES OF MOTO