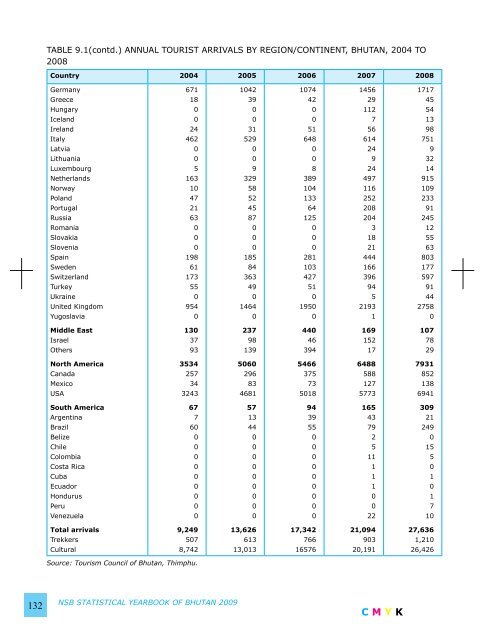
TABLE 9.1(contd.) ANNUAL TOURIST ARRIVALS BY REGION/CONTINENT, BHUTAN, 2004 TO 2008 Country 2004 2005 2006 2007 2008 Germany Greece Hungary Iceland Ireland Italy Latvia Lithuania Luxembourg Netherlands Norway Poland Portugal Russia Romania Slovakia Slovenia Spain Sweden Switzerland Turkey Ukraine United Kingdom Yugoslavia 671 18 0 0 24 462 0 0 5 163 10 47 21 63 0 0 0 198 61 173 55 0 954 0 1042 39 0 0 31 529 0 0 9 329 58 52 45 87 0 0 0 185 84 363 49 0 1464 0 1074 42 0 0 51 648 0 0 8 389 104 133 64 125 0 0 0 281 103 427 51 0 1950 0 1456 29 112 7 56 614 24 9 24 497 116 252 208 204 3 18 21 444 166 396 94 5 2193 1 1717 45 54 13 98 751 9 32 14 915 109 233 91 245 12 55 63 803 177 597 91 44 2758 0 Middle East Israel Others 130 37 93 237 98 139 440 46 394 169 152 17 107 78 29 North America Canada Mexico USA 3534 257 34 3243 5060 296 83 4681 5466 375 73 5018 6488 588 127 5773 7931 852 138 6941 South America Argentina Brazil Belize Chile Colombia Costa Rica Cuba Ecuador Hondurus Peru Venezuela 67 7 60 0 0 0 0 0 0 0 0 0 57 13 44 0 0 0 0 0 0 0 0 0 94 39 55 0 0 0 0 0 0 0 0 0 165 43 79 2 5 11 1 1 1 0 0 22 309 21 249 0 15 5 0 1 0 1 7 10 Total arrivals Trekkers Cultural 9,249 507 8,742 13,626 613 13,013 17,342 766 16576 21,094 903 20,191 27,636 1,210 26,426 Source: Tourism Council of Bhutan, Thimphu. 132 NSB STATISTICAL YEARBOOK OF BHUTAN 2009 C M Y K
TABLE 9.2 TOURIST ARRIVALS BY COUNTRY OF RESIDENCE AND REVENUE RECEIPTS, BHUTAN, 2004 TO 2008 Region 2004 2005 2006 2007 2008 North America South America Asia and Pacific Europe Africa Middle East 3,534 67 1,685 3,819 14 130 5,060 57 2,771 5,457 44 237 5,466 94 4,264 7,031 47 440 6,488 165 5,429 8,777 66 169 7931 309 7514 11698 77 107 All regions (persons) 9,249 13,626 17,342 21,094 27,636 Tourism revenue receipts Ngultrums (million) Or US Dollars (million) 589 13 821.00 18.54 1,083.60 23.92 1,234.30 29.85 1689.49 38.83 Source: Tourism Council of Bhutan, Thimphu. TABLE 9.3 NUMBER OF TOURIST ARRIVALS BY SEASON AND MONTH,BHUTAN, 2004 TO 2008 Season & Month 2004 2005 2006 2007 2008 Winter November December January 1,742 1,198 455 89 2,400 1,443 625 332 3,350 2084 854 412 4,265 2,733 1,091 441 5,848 4,126 1,190 532 Spring February March April 2,493 358 831 1,304 4,261 632 2,164 1,465 5,257 532 1,381 3,344 6,019 814 2,539 2,666 7,996 1311 3512 3173 Summer May June July 1,037 448 313 276 1,289 700 315 274 1,875 999 422 454 2,213 1,045 580 588 3,816 1862 869 1085 Autumn August September October 3,977 476 1,248 2,253 5,676 576 1,688 3,412 6,860 896 2,187 3,777 8,597 1,133 2,952 4,512 9,976 1386 2428 6162 Total Arrival 9,249 13,626 17,342 21,094 27,636 Source: Tourism Council of Bhutan, Thimphu. C M Y K NSB STATISTICAL YEARBOOK OF BHUTAN 2009 133
- Page 1 and 2:
།ལ་ཡོངས་ས་ད
- Page 3 and 4:
NOTES FOR USERS 1. Unless otherwise
- Page 5 and 6:
KEY FACTS ABOUT BHUTAN Land area 38
- Page 7 and 8:
Gamrichu about 2km below Rolong. Fr
- Page 9 and 10:
the executive power by His Majesty
- Page 11 and 12:
Foreword Notes for users Key Facts
- Page 13 and 14:
CHAPTER 5: LAND USE AND AGRICULTURE
- Page 15 and 16:
CHAPTER 9: TOURISM 113 TABLE 9.1: A
- Page 17 and 18:
15.6: Consumer price indexes for fo
- Page 19 and 20:
of 196,111 persons while 438,871 ar
- Page 21 and 22:
TABLE 1.2: PROJECTED POPULATION (NU
- Page 23 and 24:
TABLE 1.6: PROJECTED POPULATION (NU
- Page 25 and 26:
TABLE 1.9: PROJECTED POPULATION (NU
- Page 27 and 28:
TABLE 1.13: PROJECTED POPULATION (N
- Page 29 and 30:
TABLE 1.16: PROJECTED POPULATION (N
- Page 31 and 32:
TABLE 1.18: PROJECTED POPULATION (N
- Page 33 and 34:
TABLE 1.20: PROJECTED POPULATION (N
- Page 35 and 36:
266,164 97,514 63,039 61,001 60,510
- Page 37 and 38:
TABLE 2.3: HEALTH PERSONNEL BY CATE
- Page 39 and 40:
TABLE 2.6 (contd..): MORBIDITY CASE
- Page 41 and 42:
TABLE 2.7 (contd..): HOSPITAL MORBI
- Page 43 and 44:
TABLE 2.8: HOSPITAL INDOOR MORBIDIT
- Page 45 and 46:
TABLE 2.8: HOSPITAL INDOOR MORBIDIT
- Page 47 and 48:
TABLE 2.10: EPI COVERAGE IN PERCENT
- Page 49 and 50:
TABLE 2.13 (contd..): DETAILS OF MA
- Page 51 and 52:
TABLE 2.15: FAMILY PLANNING ACCEPTO
- Page 53 and 54:
CHAPTER 3 EDUCATION The introductio
- Page 55 and 56:
TABLE 3.1: NUMBER OF SCHOOLS AND IN
- Page 57 and 58:
TABLE 3.4: NUMBER OF EDUCATIONAL FA
- Page 59 and 60:
TABLE 3.6: NUMBER OF EDUCATIONAL FA
- Page 61 and 62:
TABLE 3.8: NUMBER OF STUDENTS IN HI
- Page 63 and 64:
TABLE 3.10: NUMBER OF STUDENTS BY G
- Page 65 and 66:
Figure 4.1: Percentage Distribution
- Page 67 and 68:
TABLE 4.2: PERCENTAGE DISTRIBUTION
- Page 69 and 70:
TABLE 4.5: UNEMPLOYED PERSONS BY AG
- Page 71 and 72:
TABLE 4.8: ALL EMPLOYED PERSONS WOR
- Page 73 and 74:
TABLE 4.11: NUMBER OF CHILDREN AGED
- Page 75 and 76:
Figure 5.1: Land Use by Type, Bhuta
- Page 77 and 78:
TABLE 5.2: PERCENTAGE OF AREA BY DZ
- Page 79 and 80:
TABLE 5.4: PERCENTAGE OF TOTAL AREA
- Page 81 and 82: 81 C M Y K NSB STATISTICAL YEARBOOK
- Page 83 and 84: 83 C M Y K NSB STATISTICAL YEARBOOK
- Page 85 and 86: TABLE 5.7: NUMBER OF AGRICULTURE RE
- Page 87 and 88: TABLE 5.9: POWER TILLER TRACKS DEVE
- Page 89 and 90: TABLE 5.13: CULTIVATED AREA, PRODUC
- Page 91 and 92: TABLE 5.15: NUMBER OF LIVESTOCK BY
- Page 93 and 94: TABLE 5. 18: QUANTITY AND VALUE OF
- Page 95 and 96: TABLE 5. 18(contd.): QUANTITY AND V
- Page 97 and 98: CHAPTER 6 INDUSTRIES The subject
- Page 99 and 100: TABLE 6.3 NUMBER OF INDUSTRIES BY S
- Page 101 and 102: TABLE 6.7 MINERAL PRODUCTION FROM M
- Page 103 and 104: TABLE 6.9: NUMBER OF ESTABLISHMENT
- Page 105 and 106: TABLE 6.12: NUMBER OF PERSONS ENGAG
- Page 107 and 108: Services. Since then, the informati
- Page 109 and 110: TABLE 7.2 LENGTH OF ROADS BY TYPE A
- Page 111 and 112: TABLE 7.4 NUMBER OF SUPENSION BRIDG
- Page 113 and 114: TABLE 7.7 NUMBERS OF PASSENGERS CAR
- Page 115 and 116: 115 C M Y K NSB STATISTICAL YEARBOO
- Page 117 and 118: TABLE 7.9 (contd.) TELEPHONE CONNEC
- Page 119 and 120: TABLE 7.10(contd..) NUMBER OF TELEP
- Page 121 and 122: TABLE 7.14 NUMBER OF COMMUNICATION
- Page 123 and 124: CHAPTER 8 ENERGY The major source o
- Page 125 and 126: TABLE 8.1(contd.) ELECTRICITY GENER
- Page 127 and 128: TABLE 8.3 MAJOR TRANSMISSION LINES
- Page 129 and 130: TABLE 8.6 MONTHLY REVENUE FROM SALE
- Page 131: TABLE 9.1 ANNUAL TOURIST ARRIVALS B
- Page 135 and 136: CHAPTER 10 FOREIGN TRADE AND BALANC
- Page 137 and 138: TABLE 10.3: VALUE AND ITS PERCENTAG
- Page 139 and 140: TABLE 10.6: GROSS INTERNATIONAL RES
- Page 141 and 142: TABLE 11.1: MONETARY SURVEY: ROYAL
- Page 143 and 144: TABLE 11.4: MONEY AND BANKING DATAI
- Page 145 and 146: TABLE 11.7: (contd..) INVESTMENTS O
- Page 147 and 148: TABLE 11.9: INTEREST RATES AND REPA
- Page 149 and 150: TABLE 11.11: ROYAL SECURITIES EXCHA
- Page 151 and 152: TABLE 11.13: ROYAL SECURITIES EXCHA
- Page 153 and 154: TABLE 12.1: RECURRENT BUDGETARY EXP
- Page 155 and 156: TABLE 12.3: BUDGETARY RECEIPTS OF T
- Page 157 and 158: TABLE 13.1: TENTH PLAN BUDGETARY OU
- Page 159 and 160: TABLE 13.4: DZONGKHAG WISE NINTH FI
- Page 161 and 162: TABLE 14.1: GROSS DOMESTIC PRODUCT
- Page 163 and 164: TABLE 14.5: GROSS DOMESTIC PRODUCT
- Page 165 and 166: TABLE 14.10: EXPENDITURES ON GROSS
- Page 167 and 168: TABLE 15.1 CONSUMER PRICE INDEXES F
- Page 169 and 170: TABLE 15.3 CONSUMER PRICE INDEXES -
- Page 171 and 172: TABLE 15.5 CONSUMER PRICE INDEXES F
- Page 173 and 174: TABLE 15.7 CONSUMER PRICE INDEXES,
- Page 175 and 176: TABLE 16.1: SUMMURY OF CRIME REPORT
- Page 177 and 178: TABLE 16.2 (contd.): DETAILS OF CRI
- Page 179 and 180: TABLE 16.2 (contd.): DETAILS OF CRI
- Page 181 and 182: TABLE 16.2 (contd.): DETAILS OF CRI
- Page 183 and 184:
TABLE 16.4: (Contd..)CAUSES OF MOTO