MATH1725 Introduction to Statistics: Worked examples
MATH1725 Introduction to Statistics: Worked examples
MATH1725 Introduction to Statistics: Worked examples

Create successful ePaper yourself
Turn your PDF publications into a flip-book with our unique Google optimized e-Paper software.
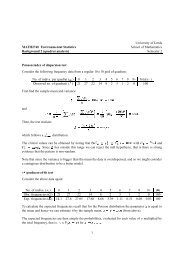
Required percentage is<br />
265.8<br />
400<br />
× 100 = 66.4%<br />
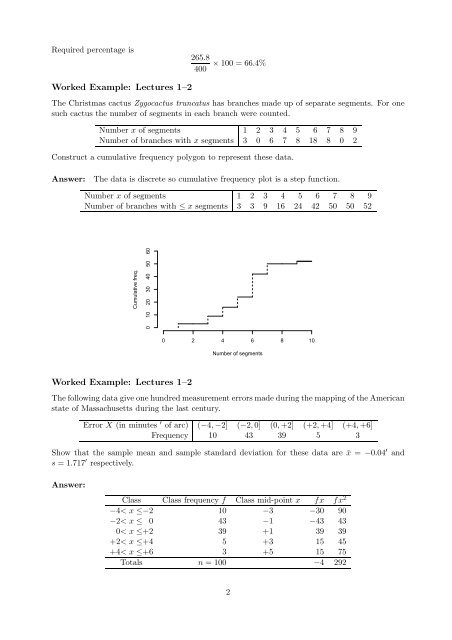
<strong>Worked</strong> Example: Lectures 1–2<br />
The Christmas cactus Zygocactus truncatus has branches made up of separate segments. For one<br />
such cactus the number of segments in each branch were counted.<br />
Number x of segments 1 2 3 4 5 6 7 8 9<br />
Number of branches with x segments 3 0 6 7 8 18 8 0 2<br />
Construct a cumulative frequency polygon <strong>to</strong> represent these data.<br />
Answer: The data is discrete so cumulative frequency plot is a step function.<br />
Number x of segments 1 2 3 4 5 6 7 8 9<br />
Number of branches with ≤ x segments 3 3 9 16 24 42 50 50 52<br />
Cumulative freq.<br />
0 10 20 30 40 50 60<br />
0 2 4 6 8 10<br />
Number of segments<br />
<strong>Worked</strong> Example: Lectures 1–2<br />
The following data give one hundred measurement errors made during the mapping of the American<br />
state of Massachusetts during the last century.<br />
Error X (in minutes ′ of arc) (−4, −2] (−2,0] (0,+2] (+2,+4] (+4,+6]<br />
Frequency 10 43 39 5 3<br />
Show that the sample mean and sample standard deviation for these data are ¯x = −0.04 ′ and<br />
s = 1.717 ′ respectively.<br />
Answer:<br />
Class Class frequency f Class mid-point x fx fx 2<br />
−4< x ≤−2 10 −3 −30 90<br />
−2< x ≤ 0 43 −1 −43 43<br />
0< x ≤+2 39 +1 39 39<br />
+2< x ≤+4 5 +3 15 45<br />
+4< x ≤+6 3 +5 15 75<br />
Totals n = 100 −4 292<br />
2