Yankton Indian Reservation - South Dakota Office of Tribal ...
Yankton Indian Reservation - South Dakota Office of Tribal ...
Yankton Indian Reservation - South Dakota Office of Tribal ...

You also want an ePaper? Increase the reach of your titles
YUMPU automatically turns print PDFs into web optimized ePapers that Google loves.
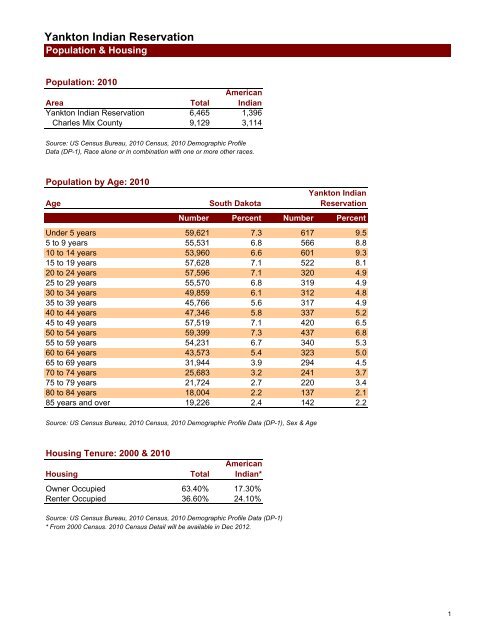
<strong>Yankton</strong> <strong>Indian</strong> <strong>Reservation</strong><br />
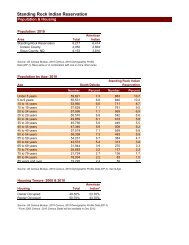
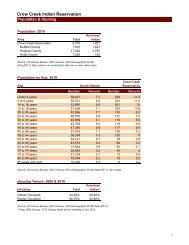
Population & Housing<br />
Population: 2010<br />
Area<br />
Total<br />
American<br />
<strong>Indian</strong><br />
<strong>Yankton</strong> <strong>Indian</strong> <strong>Reservation</strong> 6,465 1,396<br />
Charles Mix County 9,129 3,114<br />
Source: US Census Bureau, 2010 Census, 2010 Demographic Pr<strong>of</strong>ile<br />
Data (DP-1), Race alone or in combination with one or more other races.<br />
Population by Age: 2010<br />
Age<br />
<strong>South</strong> <strong>Dakota</strong><br />
<strong>Yankton</strong> <strong>Indian</strong><br />
<strong>Reservation</strong><br />
Number Percent Number Percent<br />
Under 5 years 59,621 7.3 617 9.5<br />
5 to 9 years 55,531 6.8 566 8.8<br />
10 to 14 years 53,960 6.6 601 9.3<br />
15 to 19 years 57,628 7.1 522 8.1<br />
20 to 24 years 57,596 7.1 320 4.9<br />
25 to 29 years 55,570 6.8 319 4.9<br />
30 to 34 years 49,859 6.1 312 4.8<br />
35 to 39 years 45,766 5.6 317 4.9<br />
40 to 44 years 47,346 5.8 337 5.2<br />
45 to 49 years 57,519 7.1 420 6.5<br />
50 to 54 years 59,399 7.3 437 6.8<br />
55 to 59 years 54,231 6.7 340 5.3<br />
60 to 64 years 43,573 5.4 323 5.0<br />
65 to 69 years 31,944 3.9 294 4.5<br />
70 to 74 years 25,683 3.2 241 3.7<br />
75 to 79 years 21,724 2.7 220 3.4<br />
80 to 84 years 18,004 2.2 137 2.1<br />
85 years and over 19,226 2.4 142 2.2<br />
Source: US Census Bureau, 2010 Census, 2010 Demographic Pr<strong>of</strong>ile Data (DP-1), Sex & Age<br />
Housing Tenure: 2000 & 2010<br />
Housing<br />
Total<br />
American<br />
<strong>Indian</strong>*<br />
Owner Occupied 63.40% 17.30%<br />
Renter Occupied 36.60% 24.10%<br />
Source: US Census Bureau, 2010 Census, 2010 Demographic Pr<strong>of</strong>ile Data (DP-1)<br />
* From 2000 Census. 2010 Census Detail will be available in Dec 2012.<br />
1
<strong>Yankton</strong> <strong>Indian</strong> <strong>Reservation</strong><br />
Education & Income<br />
Educational Attainment: 2000<br />
Education Level<br />
Total<br />
American<br />
<strong>Indian</strong><br />
High School Diploma (or equivalent) 34.10% 38.10%<br />
Some College No Degree 16.70% 19.60%<br />
Associate Degree 8.40% 8.00%<br />
Bachelor’s Degree 10.50% 4.60%<br />
Master’s/Pr<strong>of</strong>essional/Doctorate Degree 3.20% 1.50%<br />
Source: Census 2000, Summary File 3 (SF 3), Educational Attainment for Population 25 Years and Over by Sex & Race.<br />
Next Update: December 2012 with release <strong>of</strong> the American <strong>Indian</strong> and Alaska Native Summary File<br />
Income: 2000<br />
Household<br />
Income<br />
Family<br />
Income<br />
Less than $10,000 511 297<br />
$10,000 to $14,999 238 144<br />
$15,000 to $19,999 198 109<br />
$20,000 to $24,999 198 129<br />
$25,000 to $29,999 220 176<br />
$30,000 to $34,999 163 119<br />
$35,000 to $39,999 76 52<br />
$40,000 to $44,999 120 97<br />
$45,000 to $49,999 94 86<br />
$50,000 to $59,999 173 145<br />
$60,000 to $74,999 109 101<br />
$75,000 to $99,999 77 66<br />
$100,000 to $124,999 23 21<br />
$125,000 to $149,999 4 4<br />
$150,000 to $199,999 7 5<br />
$200,000 or more 0 0<br />
Total: 2,211 1,551<br />
Median Household Income<br />
$23,734<br />
Median Family Income<br />
$27,576<br />
200<br />
160<br />
120<br />
Household Income<br />
Family Income<br />
80<br />
40<br />
0<br />
Less than $10,000<br />
$10,000 to $14,999<br />
$15,000 to $19,999<br />
$20,000 to $24,999<br />
$25,000 to $29,999<br />
$30,000 to $34,999<br />
$35,000 to $39,999<br />
$40,000 to $44,999<br />
$45,000 to $49,999<br />
$50,000 to $59,999<br />
$60,000 to $74,999<br />
$75,000 to $99,999<br />
$100,000 to $124,999<br />
$125,000 to $149,999<br />
$150,000 to $199,999<br />
$200,000 or more<br />
Source: Distribution <strong>of</strong> Income by Family and Household from Census 2000<br />
Next Update: December 2012 with release <strong>of</strong> the American <strong>Indian</strong> and Alaska Native Summary File<br />
2
<strong>Yankton</strong> <strong>Indian</strong> <strong>Reservation</strong><br />
Agricultural Statistics<br />
2007 Census <strong>of</strong> Agriculture<br />
All Farms<br />
Farms Operated<br />
by American <strong>Indian</strong>s<br />
Farms<br />
Farms: (number) 64 4<br />
Land in farms (acres) 141,274 1,475<br />
Average farm size (acres) 2,207 369<br />
Farms by size: (number)<br />
Less than 1,000 acres 29 3<br />
1,000 acres or more 35 1<br />
Farms by economic class<br />
Less than $100,000 24 4<br />
$100,000 or more 40 -<br />
Farms by type <strong>of</strong> organization: (number)<br />
Family, Individual, Partnership 59 3<br />
Corporation, Cooperative, Trust 5 1<br />
Livestock Inventory and Crops Harvested<br />
Livestock and Poultry Inventory (number)<br />
Cattle and calves 13,798 (D)<br />
Hogs and pigs (D) -<br />
Sheep and lambs 755 (D)<br />
Horses and ponies 480 (D)<br />
Bison (D) (D)<br />
Chickens (layers and broilers) - -<br />
Crops Harvested (acres)<br />
Corn for grain - -<br />
Corn for silage or greenchop 15,816 (D)<br />
Wheat for grain, All 25,505 96<br />
Winter wheat for grain 24,783 96<br />
Durum wheat for grain - -<br />
Spring wheat for grain 722 -<br />
Barley for grain - -<br />
Oats for grain 1402 (D)<br />
Sunflower seed, All 8,410 -<br />
Soybeans for beans 13068 -<br />
Hay, haylage, grass silage 13,848 (D)<br />
Operator Demographics<br />
Primary occupation: (number)<br />
Farming 80 176<br />
Other 17 61<br />
Place <strong>of</strong> residence: (number)<br />
On farm operated 77 192<br />
Not on farm operated 20 45<br />
Years on present farm: (number)<br />
Less than 10 years 14 51<br />
10 years <strong>of</strong> more 83 186<br />
Age group: (number)<br />
Under 55 years 55 158<br />
55 years and over 42 79<br />
Average age <strong>of</strong> operators: (number) 52.5 48.7<br />
Source: USDA, Ag Census, Publications, Special Studies, American <strong>Indian</strong> <strong>Reservation</strong>s, 2007, Released June 2009.<br />
http://www.agcensus.usda.gov/Publications/2007/Online_Highlights/index.asp<br />
Next Update: June 2014<br />
(D) Not Disclosable<br />
3
<strong>Yankton</strong> <strong>Indian</strong> <strong>Reservation</strong><br />
Industry & Occupations<br />
Covered Workers & Wages: 2010 Annual Average<br />
Industry<br />
Avg<br />
Employment<br />
Avg<br />
Annual Pay<br />
Charles Mix County data<br />
Total 3,437 $27,098<br />
Total Private 2115 $25,445<br />
Natural Resources/Mining 144 $30,963<br />
Construction 124 $29,020<br />
Manufacturing 73 $31,157<br />
Trade, Transportation, and Utilities 668 $25,326<br />
Retail Trade 388 $16,249<br />
Utilities 26 $47,335<br />
Information 30 $34,876<br />
Financial Activities 119 $32,957<br />
Pr<strong>of</strong>essional/Business Services 75 $29,924<br />
Education and Health Services 581 $27,282<br />
Leisure and Hospitality 242 $9,486<br />
Total Government 1322 $29,742<br />
Federal Government 182 $53,855<br />
State Government 60 $28,790<br />
Local Government 1,078 $25,755<br />
Source: SD Dept. <strong>of</strong> Labor, Labor Market Information Center, Covered Workers & Pay,<br />
http://dlr.sd.gov/lmic/menu_covered_workers.aspx, 2010 Annual Averages.<br />
Occupations by Gender: 2000<br />
Occupation<br />
Total<br />
American<br />
<strong>Indian</strong><br />
Total: 2,283 676<br />
Male: 1,115 284<br />
Management, pr<strong>of</strong>essional, and related occupations 450 47<br />
Service occupations 204 135<br />
Sales and <strong>of</strong>fice occupations 115 35<br />
Farming, fishing, and forestry occupations 48 2<br />
Construction, extraction, and maintenance occupations 174 46<br />
Production, transportation, and material moving occupations 124 19<br />
Female: 1,168 392<br />
Management, pr<strong>of</strong>essional, and related occupations 407 99<br />
Service occupations 339 137<br />
Sales and <strong>of</strong>fice occupations 374 142<br />
Farming, fishing, and forestry occupations 4 0<br />
Construction, extraction, and maintenance occupations 8 0<br />
Production, transportation, and material moving occupations 36 14<br />
Source: 2000 Census.<br />
Next Update: December 2012 with release <strong>of</strong> the American <strong>Indian</strong> and Alaska Native Summary File.<br />
4
<strong>Yankton</strong> <strong>Indian</strong> <strong>Reservation</strong><br />
Labor Force<br />
U.S. Census Bureau (2000)*<br />
Labor Force: 2,961<br />
Employed: 2,415<br />
Unemployed: 542<br />
Unemployment Rate: 18.30%<br />
*Statistics represent labor characteristics <strong>of</strong> the reservation, not the tribe.<br />
Labor Force definition:<br />
• Civilian, non-institutional population 16 years and older<br />
• The sum <strong>of</strong> Employment and Unemployment<br />
Employment definition:<br />
• Did any work as paid employees<br />
• Worked in their own business, pr<strong>of</strong>ession, or farm<br />
• Worked 15 hours or more as unpaid workers in a family owned enterprise<br />
Unemployment definition:<br />
• Have not worked during monthly survey period<br />
• Available for work<br />
• Actively seeking a job during last four weeks<br />
Unemployment Rate definition:<br />
• Equal to the number <strong>of</strong> Unemployed divided by number in the Labor Force<br />
Source: US Census Bureau, American Fact Finder, 2000 Census, SF3, Table P43 – Sex by Employment Status for the Population 16+<br />
Years.<br />
Department <strong>of</strong> the Interior (2005)*<br />
Labor Force: 3,565<br />
Employed: 491<br />
Unemployed: 3,074<br />
Unemployment Rate: 86.00%<br />
* Statistics represent labor characteristics <strong>of</strong> the tribe, not the reservation.<br />
Labor Force definition:<br />
• Number <strong>of</strong> tribal members between 16 and 64 years old<br />
• Available for work<br />
• Not disabled or incarcerated<br />
Employment definition:<br />
• <strong>Tribal</strong> members working for money<br />
Unemployment definition:<br />
• Calculated by subtracting Employment from Labor Force<br />
Source: 2005 American <strong>Indian</strong> Population and Labor Force Report, US Dept <strong>of</strong> the Interior, Bureau <strong>of</strong> <strong>Indian</strong> Affairs, <strong>Office</strong> <strong>of</strong> <strong>Tribal</strong><br />
Services.<br />
5