Standing Rock Indian Reservation - South Dakota Office of Tribal ...
Standing Rock Indian Reservation - South Dakota Office of Tribal ...
Standing Rock Indian Reservation - South Dakota Office of Tribal ...

Create successful ePaper yourself
Turn your PDF publications into a flip-book with our unique Google optimized e-Paper software.
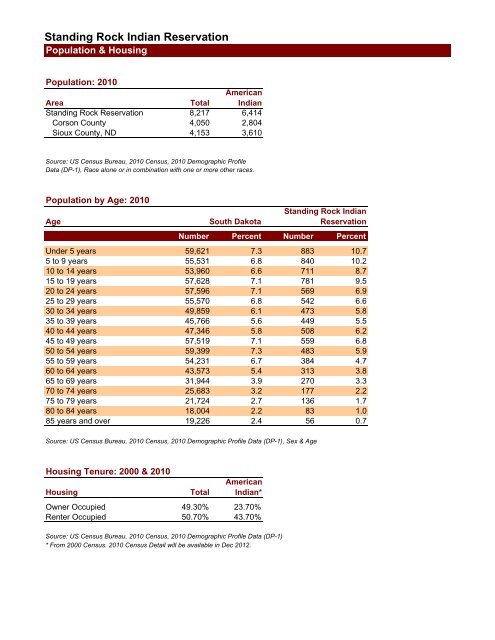
<strong>Standing</strong> <strong>Rock</strong> <strong>Indian</strong> <strong>Reservation</strong><br />
Population & Housing<br />
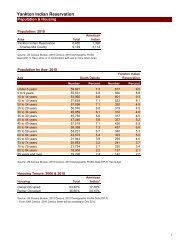
Population: 2010<br />
Area<br />
Total<br />
American<br />
<strong>Indian</strong><br />
<strong>Standing</strong> <strong>Rock</strong> <strong>Reservation</strong> 8,217 6,414<br />
Corson County 4,050 2,804<br />
Sioux County, ND 4,153 3,610<br />
Source: US Census Bureau, 2010 Census, 2010 Demographic Pr<strong>of</strong>ile<br />
Data (DP-1), Race alone or in combination with one or more other races.<br />
Population by Age: 2010<br />
Age<br />
<strong>South</strong> <strong>Dakota</strong><br />
<strong>Standing</strong> <strong>Rock</strong> <strong>Indian</strong><br />
<strong>Reservation</strong><br />
Number Percent Number Percent<br />
Under 5 years 59,621 7.3 883 10.7<br />
5 to 9 years 55,531 6.8 840 10.2<br />
10 to 14 years 53,960 6.6 711 8.7<br />
15 to 19 years 57,628 7.1 781 9.5<br />
20 to 24 years 57,596 7.1 569 6.9<br />
25 to 29 years 55,570 6.8 542 6.6<br />
30 to 34 years 49,859 6.1 473 5.8<br />
35 to 39 years 45,766 5.6 449 5.5<br />
40 to 44 years 47,346 5.8 508 6.2<br />
45 to 49 years 57,519 7.1 559 6.8<br />
50 to 54 years 59,399 7.3 483 5.9<br />
55 to 59 years 54,231 6.7 384 4.7<br />
60 to 64 years 43,573 5.4 313 3.8<br />
65 to 69 years 31,944 3.9 270 3.3<br />
70 to 74 years 25,683 3.2 177 2.2<br />
75 to 79 years 21,724 2.7 136 1.7<br />
80 to 84 years 18,004 2.2 83 1.0<br />
85 years and over 19,226 2.4 56 0.7<br />
Source: US Census Bureau, 2010 Census, 2010 Demographic Pr<strong>of</strong>ile Data (DP-1), Sex & Age<br />
Housing Tenure: 2000 & 2010<br />
Housing<br />
Total<br />
American<br />
<strong>Indian</strong>*<br />
Owner Occupied 49.30% 23.70%<br />
Renter Occupied 50.70% 43.70%<br />
Source: US Census Bureau, 2010 Census, 2010 Demographic Pr<strong>of</strong>ile Data (DP-1)<br />
* From 2000 Census. 2010 Census Detail will be available in Dec 2012.
<strong>Standing</strong> <strong>Rock</strong> <strong>Indian</strong> <strong>Reservation</strong><br />
Education & Income<br />
Educational Attainment: 2000<br />
Education Level<br />
Total<br />
American<br />
<strong>Indian</strong><br />
High School Diploma (or equivalent) 35.10% 33.70%<br />
Some College No Degree 21.50% 23.40%<br />
Associate Degree 9.50% 11.40%<br />
Bachelor’s Degree 8.60% 6.40%<br />
Master’s/Pr<strong>of</strong>essional/Doctorate Degree 2.60% 1.40%<br />
Source: Census 2000, Summary File 3 (SF 3), Educational Attainment for Population 25 Years and Over by Sex & Race.<br />
Next Update: December 2012 with release <strong>of</strong> the American <strong>Indian</strong> and Alaska Native Summary File<br />
Income: 2000<br />
Household<br />
Income<br />
Family<br />
Income<br />
Less than $10,000 537 354<br />
$10,000 to $14,999 301 224<br />
$15,000 to $19,999 260 182<br />
$20,000 to $24,999 250 193<br />
$25,000 to $29,999 157 142<br />
$30,000 to $34,999 153 122<br />
$35,000 to $39,999 146 139<br />
$40,000 to $44,999 106 84<br />
$45,000 to $49,999 99 87<br />
$50,000 to $59,999 149 128<br />
$60,000 to $74,999 118 97<br />
$75,000 to $99,999 71 59<br />
$100,000 to $124,999 13 13<br />
$125,000 to $149,999 5 5<br />
$150,000 to $199,999 6 4<br />
$200,000 or more 7 4<br />
Total: 2,378 1,837<br />
Median Household Income<br />
$21,625<br />
Median Family Income<br />
$23,922<br />
600<br />
500<br />
400<br />
300<br />
200<br />
100<br />
Household Income<br />
Family Income<br />
0<br />
Less than $10,000<br />
$10,000 to $14,999<br />
$15,000 to $19,999<br />
$20,000 to $24,999<br />
$25,000 to $29,999<br />
$30,000 to $34,999<br />
$35,000 to $39,999<br />
$40,000 to $44,999<br />
$45,000 to $49,999<br />
$50,000 to $59,999<br />
$60,000 to $74,999<br />
$75,000 to $99,999<br />
$100,000 to $124,999<br />
$125,000 to $149,999<br />
$150,000 to $199,999<br />
$200,000 or more<br />
Source: Distribution <strong>of</strong> Income by Family and Household from Census 2000<br />
Next Update: December 2012 with release <strong>of</strong> the American <strong>Indian</strong> and Alaska Native Summary File
<strong>Standing</strong> <strong>Rock</strong> <strong>Indian</strong> <strong>Reservation</strong><br />
Agricultural Statistics<br />
2007 Census <strong>of</strong> Agriculture<br />
All Farms<br />
Farms Operated<br />
by American <strong>Indian</strong>s<br />
Farms<br />
Farms: (number) 484 108<br />
Land in farms (acres) 1,868,194 412,550<br />
Average farm size (acres) 3,860 3,820<br />
Farms by size: (number)<br />
Less than 1,000 acres 159 58<br />
1,000 acres or more 325 50<br />
Farms by economic class<br />
Less than $100,000 251 71<br />
$100,000 or more 23 37<br />
Farms by type <strong>of</strong> organization: (number)<br />
Family, Individual, Partnership 461 92<br />
Corporation, Cooperative, Trust 23 16<br />
Livestock Inventory and Crops Harvested<br />
Livestock and Poultry Inventory (number)<br />
Cattle and calves 120,548 16,829<br />
Hogs and pigs (D) (D)<br />
Sheep and lambs 2,593 (D)<br />
Horses and ponies 2,407 826<br />
Bison 4,914 (D)<br />
Chickens (layers and broilers) 208 -<br />
Crops Harvested (acres)<br />
Corn for grain 18,618 3,586<br />
Corn for silage or greenchop 8,011 -<br />
Wheat for grain, All 128,741 3,817<br />
Winter wheat for grain 8,981 (D)<br />
Durum wheat for grain 2,865 (D)<br />
Spring wheat for grain 116,895 (D)<br />
Barley for grain 5,504 (D)<br />
Oats for grain 8,870 1,176<br />
Sunflower seed, All 13,873 1,121<br />
Soybeans for beans (D) -<br />
Hay, haylage, grass silage 187,299 19,758<br />
Operator Demographics<br />
Primary occupation: (number)<br />
Farming 507 73<br />
Other 222 62<br />
Place <strong>of</strong> residence: (number)<br />
On farm operated 593 99<br />
Not on farm operated 136 36<br />
Years on present farm: (number)<br />
Less than 10 years 152 41<br />
10 years <strong>of</strong> more 577 94<br />
Age group: (number)<br />
Under 55 years 428 87<br />
55 years and over 301 48<br />
Average age <strong>of</strong> operators: (number) 52.0 52.2<br />
Source: USDA, Ag Census, Publications, Special Studies, American <strong>Indian</strong> <strong>Reservation</strong>s, 2007, Released June 2009.<br />
http://www.agcensus.usda.gov/Publications/2007/Online_Highlights/index.asp<br />
Next Update: June 2014<br />
(D) Not Disclosable
<strong>Standing</strong> <strong>Rock</strong> <strong>Indian</strong> <strong>Reservation</strong><br />
Industry & Occupations<br />
Covered Workers & Wages: 2010 Annual Average<br />
Industry<br />
Avg<br />
Employment<br />
Avg<br />
Annual Pay<br />
Corson County data<br />
Total 860 $29,999<br />
Total Private 201 $29,993<br />
Natural Resources/Mining 13 $32,037<br />
Construction 6 $18,426<br />
Manufacturing NA<br />
NA<br />
Trade, Transportation, and Utilities 123 $31,493<br />
Retail Trade 25 $17,526<br />
Utilities * *<br />
Information 14 $36,827<br />
Financial Activities 12 $30,318<br />
Pr<strong>of</strong>essional/Business Services * *<br />
Education and Health Services 28 $24,400<br />
Leisure and Hospitality 5 $11,118<br />
Total Government 659 $30,001<br />
Federal Government 78 $46,191<br />
State Government 10 $29,018<br />
Local Government 571 $27,807<br />
Source: SD Dept. <strong>of</strong> Labor, Labor Market Information Center, Covered Workers & Pay,<br />
http://dlr.sd.gov/lmic/menu_covered_workers.aspx, 2010 Annual Averages.<br />
Occupations by Gender: 2000<br />
Occupation<br />
Total<br />
American<br />
<strong>Indian</strong><br />
Total: 2,415 1,304<br />
Male: 1,238 643<br />
Management, pr<strong>of</strong>essional, and related occupations 457 165<br />
Service occupations 280 218<br />
Sales and <strong>of</strong>fice occupations 104 57<br />
Farming, fishing, and forestry occupations 69 22<br />
Construction, extraction, and maintenance occupations 192 101<br />
Production, transportation, and material moving occupations 136 80<br />
Female: 1,177 661<br />
Management, pr<strong>of</strong>essional, and related occupations 450 216<br />
Service occupations 315 224<br />
Sales and <strong>of</strong>fice occupations 348 196<br />
Farming, fishing, and forestry occupations 16 5<br />
Construction, extraction, and maintenance occupations 3 1<br />
Production, transportation, and material moving occupations 45 19<br />
Source: 2000 Census.<br />
Next Update: December 2012 with release <strong>of</strong> the American <strong>Indian</strong> and Alaska Native Summary File.
<strong>Standing</strong> <strong>Rock</strong> <strong>Indian</strong> <strong>Reservation</strong><br />
Labor Force<br />
U.S. Census Bureau (2000)*<br />
Labor Force: 2,961<br />
Employed: 2,415<br />
Unemployed: 542<br />
Unemployment Rate: 18.30%<br />
*Statistics represent labor characteristics <strong>of</strong> the reservation, not the tribe.<br />
Labor Force definition:<br />
• Civilian, non-institutional population 16 years and older<br />
• The sum <strong>of</strong> Employment and Unemployment<br />
Employment definition:<br />
• Did any work as paid employees<br />
• Worked in their own business, pr<strong>of</strong>ession, or farm<br />
• Worked 15 hours or more as unpaid workers in a family owned enterprise<br />
Unemployment definition:<br />
• Have not worked during monthly survey period<br />
• Available for work<br />
• Actively seeking a job during last four weeks<br />
Unemployment Rate definition:<br />
• Equal to the number <strong>of</strong> Unemployed divided by number in the Labor Force<br />
Source: US Census Bureau, American Fact Finder, 2000 Census, SF3, Table P43 – Sex by Employment Status for the Population 16+<br />
Years.<br />
Department <strong>of</strong> the Interior (2005)*<br />
Labor Force: 3,565<br />
Employed: 491<br />
Unemployed: 3,074<br />
Unemployment Rate: 86.00%<br />
* Statistics represent labor characteristics <strong>of</strong> the tribe, not the reservation.<br />
Labor Force definition:<br />
• Number <strong>of</strong> tribal members between 16 and 64 years old<br />
• Available for work<br />
• Not disabled or incarcerated<br />
Employment definition:<br />
• <strong>Tribal</strong> members working for money<br />
Unemployment definition:<br />
• Calculated by subtracting Employment from Labor Force<br />
Source: 2005 American <strong>Indian</strong> Population and Labor Force Report, US Dept <strong>of</strong> the Interior, Bureau <strong>of</strong> <strong>Indian</strong> Affairs, <strong>Office</strong> <strong>of</strong> <strong>Tribal</strong><br />
Services.