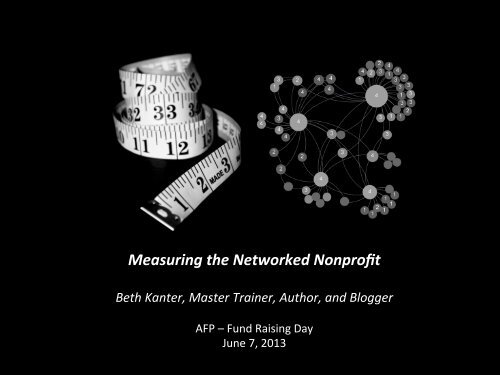
Measuring the Networked Nonprofit
Measuring the Networked Nonprofit
Measuring the Networked Nonprofit
Create successful ePaper yourself
Turn your PDF publications into a flip-book with our unique Google optimized e-Paper software.
<strong>Measuring</strong> <strong>the</strong> <strong>Networked</strong> <strong>Nonprofit</strong> <br />
Beth Kanter, Master Trainer, Author, and Blogger <br />
AFP – Fund Raising Day <br />
June 7, 2013
Beth Kanter: Master Trainer, Author, and Blogger
Who are you <br />
Raise your hand if ……. <br />
-‐ Development Staff <br />
-‐ Implements Social Media <br />
-‐ Consultant <br />
-‐ O<strong>the</strong>r
And your Org <br />
Raise your hand if <br />
organizaLon is budget is .. <br />
-‐Less than $1 million <br />
-‐$1-‐$5 million <br />
-‐Over $5 million <br />
Type .. <br />
-‐Social Service <br />
-‐Environment <br />
-‐Arts <br />
-‐EducaLon <br />
-‐Animal Welfare <br />
-‐Community Services <br />
-‐Health Care <br />
-‐O<strong>the</strong>r
Raise Your Hand If Your Social Strategy Goal Is …. <br />
q Improve relaGonships <br />
q Increase awareness <br />
q Increase traffic referral <br />
q Increase engagement <br />
q Change behavior <br />
q Increase dollars <br />
q Increase acGon
What Tools Are You Using<br />
Stand Up, Sit Down<br />
Photo by net_efekt
Stay standing if your <br />
organizaGon is using social <br />
media and geMng results
Three principles of <br />
pracGce of networked <br />
nonprofits that lead to <br />
bePer results <br />
Data <br />
Informed <br />
Social <br />
Culture <br />
Learning <br />
from Failure
Maturity of PracGce Framework: Measure Progress <br />
If you can’t fly <strong>the</strong>n run, if you can’t run <strong>the</strong>n walk, if <br />
you can’t walk <strong>the</strong>n crawl, but whatever you do you <br />
have to keep moving forward.”
Where to focus …<br />
CRAWL WALK RUN FLY<br />
Communications<br />
Strategy<br />
Development<br />
Culture Change<br />
Linking Social with<br />
Results and<br />
Networks<br />
Pilot: Focus one<br />
program or channel<br />
with measurement<br />
Incremental Capacity<br />
Ladder of<br />
Engagement<br />
Content Strategy<br />
Best Practices<br />
Measurement and<br />
learning in all above<br />
Network Building<br />
Many Free Champions work<br />
for you<br />
Multi-Channel Engagement,<br />
Content, and Measurement<br />
Reflection and Continuous<br />
Improvement
Maturity of PracGce: Crawl-‐Walk-‐Run-‐Fly <br />
Categories <br />
CULTURE <br />
CAPACITY <br />
MEASUREMENT Analysis <br />
Tools <br />
PracGces <br />
<strong>Networked</strong> Mindset <br />
InsLtuLonal Support <br />
Staffing <br />
Strategy <br />
Sense-‐Making <br />
LISTENING Brand Monitoring <br />
Influencer Research <br />
ENGAGEMENT Ladder of Engagement <br />
CONTENT <br />
NETWORK <br />
IntegraLon/OpLmizaLon <br />
Influencer Engagement <br />
RelaLonship Mapping <br />
1 2 3 4
SOCIAL CULTURE
Institutional Support<br />
Social integrated <br />
across <br />
departments <br />
CEO uses social <br />
media for <br />
leadership! <br />
All staff will <br />
connect with our <br />
audiences via <br />
social!
The Social CEO: In Service of Strategy <br />
• Enhances Current <br />
Work <br />
• Tweetutorials <br />
• Found Time
Hybrid Model Staffing: Social Media Isn’t Just One Person <br />
Source: SSIR – Mogus, Silberman, and Roy
Leverage Staff Personal Passion In Service of Mission<br />
@rdearborn works for UpWell and she<br />
LOVES sharks.
How social is your organizaGon’s culture <br />
What are some of your challenges What <br />
are your success stories <br />
1<br />
2 3<br />
4<br />
5
The Data Informed <strong>Nonprofit</strong>
CWRF: Becoming Data Informed: What Does PracGce look <br />
like <br />
Crawl Walk Run Fly<br />
inconsistent data <br />
collecLon<br />
Data collecLon <br />
consistent but not <br />
shared<br />
Data from mulLple <br />
sources<br />
Org Wide KPIs <br />
Haphazard reporLng<br />
ReporLng more <br />
consistent, but not <br />
always linked to <br />
outcomes<br />
System and structure <br />
for data collecLon<br />
OrganizaLonal <br />
Dashboard with <br />
different views, sharing<br />
Decisions based on gut<br />
Rarely makes decisions <br />
based on data<br />
Discussed at staff <br />
meeLngs, decisions <br />
made using it<br />
Data visualizaLon, real-‐<br />
Lme reporLng, formal <br />
reflecLon process<br />
Analysis <br />
Tools <br />
Sense-‐Making
Data-Informed Culture: It starts from <strong>the</strong> top!<br />
Do Something.org
More time to think about that <strong>the</strong> data, <strong>the</strong>n collect it<br />
Tear down those silos and walls around data …
Video
Scaling Data-‐Informed <br />
<br />
HSUS Analysis Process: <br />
• Everyone ga<strong>the</strong>rs <strong>the</strong>ir data <br />
• We sit in a room and analyze it <br />
• The project manager develops a report of “what we did/what we learned/what <br />
we recommend for next Lme “+ data
Jogging! <br />
2011: Not Using Source Codes for <br />
All Campaigns To Measure Social <br />
Media Conversion <br />
2013: Using Source Codes for All <br />
Campaigns To Measure Social <br />
Media Conversion
Ocean Acidification Cetaceans Gulf of Mexico MPAs Ocean Overfishing Sustainable Seafood Sharks Tuna<br />
140000<br />
140,000<br />
120000<br />
120,000<br />
100000<br />
100,000<br />
80000<br />
80,000<br />
60000<br />
60,000<br />
40000<br />
40,000<br />
20000<br />
20,000<br />
0<br />
Jan-12 Feb-12 Mar-12 Apr-12 May-12 Jun-12 Jul-12 Aug-12 Sep-12 Oct-12 Nov-12
One Metric That MaPers: <br />
Increase Shark ConservaGon ConversaGon <br />
1,800,000<br />
1,600,000<br />
1,683,670<br />
1,400,000<br />
1,200,000<br />
1,000,000<br />
800,000<br />
745,030<br />
600,000<br />
400,000<br />
200,000<br />
0<br />
133,167<br />
Shark Week 2010 Shark Week 2011 Shark Week 2012
Is your organizaGon data informed What do you need <br />
to improve to get <strong>the</strong>re What are your challenges <br />
What are your success stories
CWRF: Becoming Data Informed: What Does PracGce look <br />
like <br />
Crawl Walk Run Fly<br />
inconsistent data <br />
collecLon<br />
Data collecLon <br />
consistent but not <br />
shared<br />
Data from mulLple <br />
sources<br />
Org Wide KPIs <br />
Haphazard reporLng<br />
ReporLng more <br />
consistent, but not <br />
always linked to <br />
outcomes<br />
System and structure <br />
for data collecLon<br />
OrganizaLonal <br />
Dashboard with <br />
different views, sharing<br />
Decisions based on gut<br />
Rarely makes decisions <br />
based on data<br />
Discussed at staff <br />
meeLngs, decisions <br />
made using it<br />
Data visualizaLon, real-‐<br />
Lme reporLng, formal <br />
reflecLon process<br />
Analysis <br />
Tools <br />
Sense-‐Making
How To Improve Measurement PracGce <br />
• Measurement <br />
discipline <br />
• IdenLfy small pilots <br />
and iterate <br />
• Learn and improve
Measurement Discipline: But Start Small <br />
Goal <br />
Insight <br />
Audience <br />
Tool <br />
Cost <br />
KPI <br />
Benchmark
Pick The Right Data Point(s) To Track Outcomes
Outcomes <br />
Increase donaGons <br />
Increase donor base <br />
Increase number of volunteers <br />
Metric <br />
% reducLon in cost per dollar raised <br />
% increase in new donors <br />
% increase in volunteers <br />
Increase awareness <br />
Improve relaGonships with exisGng <br />
donors/volunteers <br />
Improve engagement with <br />
stakeholders <br />
Change in behavior <br />
Change in aMtude about your <br />
organizaGon <br />
Increase in skills and knowledge of <br />
staff Learning <br />
% increase in awareness, <br />
% increase in visibility/prominence, <br />
PosiLve correlaLon between increase <br />
in donors vs. visibility <br />
% improvement in relaLonship scores, <br />
% increase in donaLon from exisLng <br />
donors <br />
% increase in engagement (comments <br />
on YouTube, shares on Facebook, <br />
comments on blog, etc. <br />
% decrease in bad behavior, <br />
% increase in good behavior <br />
% increase in trust score or <br />
relaLonship score <br />
Increase in revenue per employee, <br />
% employees understanding <strong>the</strong>ir <br />
roles and organizaLonal mission
Don’t Start with <strong>the</strong> Tools
Now That’s A Spreadsheet! <br />
hip://fuckyeahnpspreadsheets.tumblr.com/
The Skills <br />
hip://www.bethkanter.org/datanerds-‐nonprofits/
Use Your Data For Decision-‐Making
Start Small
Review your Spreadsheet for 20 Minutes<br />
Look for paierns
Was Your Time Worth It <br />
800,000 <br />
700,000 <br />
600,000 <br />
500,000 <br />
400,000 <br />
300,000 <br />
200,000 <br />
100,000 <br />
0 <br />
Uniques <br />
Twiier Referring Traffic <br />
Facebook Referring Traffic <br />
January February March April <br />
180,000 <br />
160,000 <br />
140,000 <br />
120,000 <br />
100,000 <br />
80,000 <br />
60,000 <br />
40,000 <br />
20,000 <br />
0 <br />
Tracked Results:<br />
Stage 1 – Integrated into staff<br />
Stage 2 – Hired social media staff
What resonated What quesGons do you have Where <br />
can you get started to improve measuring results of your <br />
social media
Learn, Pivot, Improve
The Finger of Failure! <br />
It’s all <br />
your <br />
fault! <br />
What <br />
failure
No! It <br />
was all <br />
my <br />
fault!!
ReacGons to Failure <br />
Blame OTHERS <br />
DENY Blame <br />
Blame YOURSELF <br />
Saul Rosenzweig Theory
CulGvate Self-‐Awareness: The Failure Bow <br />
1. Raise hands in <strong>the</strong> air and bow <br />
2. Grin like a submissive dog <br />
3. Say Thank You I’ve Failed <br />
4. Move on and learn
CulGvate OrganizaGonal Awareness: <br />
Momsrising: Joyful Funerals
DoSomething.Org’s Fail Fest<br />
Why did it fail <br />
What did we learn <br />
What insights can <br />
use next Lme <br />
around
Summary <br />
• Success happens by taking <strong>the</strong> right <br />
incremental step to get to <strong>the</strong> next level, <br />
but keep moving forward <br />
• Scale social media results with a social <br />
culture <br />
• Define results and <strong>the</strong> one metric that <br />
maiers <br />
• Don’t get distracted by <strong>the</strong> tools or data <br />
• Place liile bets, but learn from failure and <br />
pivot and improve
Raffle <br />
Write on an index <br />
card one small step <br />
you can take next <br />
week to improve <br />
your social media <br />
pracLce <br />
Raffle for a book
Thank you! <br />
www.bethkanter.org <br />
www.facebook.com/beth.kanter.blog <br />
@kanter on Twiier


