Karavides paper ISBI 2009.pdf - Pattern Recognition ...
Karavides paper ISBI 2009.pdf - Pattern Recognition ...
Karavides paper ISBI 2009.pdf - Pattern Recognition ...

Create successful ePaper yourself
Turn your PDF publications into a flip-book with our unique Google optimized e-Paper software.
DATABASE GUIDED DETECTION OF ANATOMICAL LANDMARK POINTS<br />
IN 3D IMAGES OF THE HEART<br />
Thomas <strong>Karavides</strong> 1,2 , K. Y. Esther Leung 2 , Pavel Paclik 3 , Emile A. Hendriks 1 , Johan G. Bosch 2<br />
1 Information and Communication Theory Group, Delft University of Technology, the Netherlands; 2 Thoraxcenter<br />
Biomedical Engineering, Erasmus MC Rotterdam, the Netherlands; 3 PR Sys Design, Delft, the Netherlands<br />
ABSTRACT<br />
Automated landmark detection may facilitate the examination and<br />
automatic analysis of three-dimensional (3D) echocardiograms. By<br />
detecting 3D anatomical landmark points, the standard anatomical<br />
views can be extracted automatically, for better standardized<br />
visualization. Furthermore, the landmarks can serve as an<br />
initialization for other analysis methods, such as segmentation. The<br />
described algorithm applies landmark detection in perpendicular<br />
planes of the 3D dataset. It exploits a database of expert annotated<br />
images, using an extensive set of Haar features for classification.<br />
The detection is performed using two cascades of Adaboost<br />
classifiers in a coarse to fine scheme. The method can detect<br />
landmarks accurately in the four-chamber (apex: 7.9±7.1mm,<br />
mitral valve center: 4.8±2.3mm) and two-chamber (apex:<br />
7.1±6.7mm, mitral valve center: 5.2±2.8mm) views.<br />
Index Terms— Classification, pattern recognition, landmark<br />
detection, ultrasound<br />
1. INTRODUCTION<br />
Real-time 3D echocardiography offers new possibilities in<br />
the analysis of cardiac function. The interpretation of the<br />
images, however, is critically dependent on the<br />
standardization of views. Variability in choice of anatomical<br />
views results in high interobserver and interinstitution<br />
variability in diagnosis. Additionally, quantitative analysis<br />
methods, like segmentation, often need a good initialization.<br />
A method for automatic detection of left ventricular landmarks<br />
(apex, mitral valve) would be of great importance.<br />
Several methods for automated landmark detection in<br />
echocardiography have been proposed. Van Stralen et al. [1]<br />
describe detection of the left ventricular (LV) long axis and<br />
mitral valve plane in 3D ultrasound images. In 2D slices<br />
perpendicular to the acquisition axis, a circular Hough<br />
transform detects candidates for the endocardial border<br />
center. Dynamic programming finds a path through all<br />
slices that approximates the LV long axis. Further detection<br />
steps provide the position of the apex and mitral valve ring.<br />
The Fourier Mellin Transform (FMT) has also been<br />
proposed for LV localization [2]. An appearance template of<br />
the LV is built, and both the template and the search image<br />
are transformed into a rotation and scale invariant<br />
representation using the FMT. This way, the estimation of<br />
rotation, scale and position converts into a cascade of linear<br />
shift detections, enabling a fast estimate of the object pose.<br />
Recently, classification approaches have been<br />
proposed. Objects are represented using large sets of image<br />
features and detected by a classifier trained from labeled<br />
examples. Georgescu et al. [3] introduce a classification<br />
method to detect structures of interest in ultrasound images.<br />
A robust classifier is constructed using a boosted cascade of<br />
weak classifiers (a feature from a large set of Haar features).<br />
A similar approach is used in [4] for the detection and<br />
measurement of fetal structures in ultrasound images.<br />
Lu et al. [5] presented a classification approach for the<br />
detection of standard view planes, similar to the one<br />
proposed in the current study. A cascade of three classifiers<br />
is trained based on boosting techniques. The classifiers use<br />
Haar wavelet-like feature types and steerable features [6].<br />
In our study, a classification based method was<br />
developed to detect the standard anatomical landmark points<br />
(apex, mitral valve points) in two-chamber (2C) and fourchamber<br />
(4C) view planes in a fully automated way. The<br />
method uses smaller databases than those that have been<br />
used in similar approaches [5]; to make the classifier more<br />
robust, artificial variations are used. Our purpose is to<br />
combine the proposed technique with an existing manual<br />
technique for 3D landmark finding that uses 2D planes, so<br />
we can use 2D features to find the 3D points. Boosting<br />
techniques are used to train the classifier. Similar to [7,8]<br />
the method is applied to single 3D images at end-diastole<br />
(ED).<br />
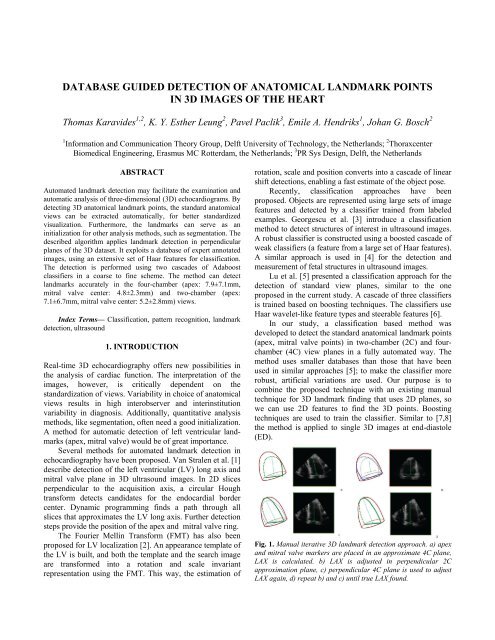
Fig. 1. Manual iterative 3D landmark detection approach. a) apex<br />
and mitral valve markers are placed in an approximate 4C plane,<br />
LAX is calculated. b) LAX is adjusted in perpendicular 2C<br />
approximation plane, c) perpendicular 4C plane is used to adjust<br />
LAX again, d) repeat b) and c) until true LAX found.
2.1. Manual scheme<br />
2. MATERIALS AND METHODS<br />
Previously, we proposed a manual method to find the<br />
anatomical views 2C and 4C, in which perpendicular 2D<br />
planes from a 3D data set were annotated iteratively [7, 8].<br />
By annotating the apex and two points on the mitral valve<br />
ring (anterior/inferior in 2C and septal/lateral in 4C) a local<br />
approximation of the LV long-axis (LAX) is found. The<br />
perpendicular plane through the LAX is generated and<br />
annotated similarly, generating a better LAX (Figure 1).<br />
Convergence to the true 3D LAX usually takes only 4-6<br />
iterations. In this study we propose to replace the manual<br />
annotations in 2D cross-sections using the fully automated<br />
landmark detection.<br />
kernel size, we have many features per pixel position in the<br />
box. To compute these features efficiently, we used the<br />
integral image approach of Viola and Jones [9].<br />
(a) (b)<br />
Fig. 4. Example of (a) an image box and (b) its filtered result using<br />
the first Haar feature.<br />
2.2. Landmark detection<br />
Instead of detecting the landmark points individually, we try<br />
to locate the whole left ventricular region containing those<br />
landmarks. The region is defined by a box, in which these<br />
landmarks have fixed positions (Figure 2). To do this, we<br />
place boxes of different sizes and orientations at different<br />
positions in the image. For each box, a classifier determines<br />
whether it matches the sought structures; the landmark<br />
positions are then defined by the fixed positions within the<br />
box. So, the landmark positions are indirectly represented<br />
by the position, size, rotation and shear of the box.<br />
Fig. 2. Annotated image of 2-chamber view with a rectangle box,<br />
where the landmarks have fixed relative positions, within the box.<br />
Fig. 3. Types of Haar features used by the classifiers.<br />
We represent the image content of the box using simple<br />
and easy to compute Haar wavelet-like features, that have<br />
been used in similar applications [4] (Figure 3). The output<br />
value at each image position is the difference between the<br />
sum of the image pixels in the white section and the sum of<br />
image pixels in the black section. The pixels of the resulting<br />
filtered images (Figure 4) are the features used in the<br />
classifier. As we use multiple feature types with different<br />
Fig. 5. Map of features used by the third classifier after explicitly<br />
excluding invalid region values. Positions correspond to an image<br />
box as in fig. 4. The classifier focuses near the anatomical<br />
landmark locations (red circles). Colors denote the number of<br />
features used at a certain positions.<br />
For the feature calculation in our ultrasound images, we<br />
had to deal with missing image information, in regions<br />
where the templates exceed the image sector boundaries.<br />
Similar to Georgescu et al. [3] we used a mask to exclude<br />
invalid pixel values. Additionally, from our set of positive<br />
training samples we learned which box regions were<br />
generally invalid and we excluded the feature values of<br />
these regions from both our training and testing sets (Figure<br />
5).<br />
We train classifiers to distinguish between boxes with<br />
the landmarks at positions within an acceptable range<br />
(positive examples) and all the rest (negative examples).<br />
The classifiers are trained using Adaboost, a machine<br />
learning algorithm which combines smaller, weak classifiers<br />
into a robust, strong one. This is accomplished by iteratively<br />
selecting the best weak classifiers. After each iteration,<br />
training examples which are misclassified by the current<br />
strong classifier are upweighted, to allow the classifier to<br />
adapt more to these misclassified examples during the next<br />
iteration. In this study, we use small tree classifiers, each<br />
using a small number of Haar features, as the weak<br />
classifiers. In initial experiments, we saw that such small<br />
tree classifiers performed better than single-feature<br />
classifiers.
The method works in a coarse to fine approach with<br />
more pose parameters and finer steps, using a cascade of<br />
three classifiers. The first classifier detects the approximate<br />
center of the left ventricle (irrespective of size and rotation),<br />
the second one detects the apex and mitral valve center (so,<br />
approximate LV position, size and rotation, but not shear),<br />
and the third one detects all three apex and mitral valve<br />
point positions (all pose parameters), with more precision.<br />
To train the three classifiers for this cascade, different<br />
positive and negative examples are generated from the<br />
annotated database, to match the three templates in Figure 6.<br />
From each patient, we can generate multiple positive<br />
examples, by applying controlled amounts of translation,<br />
rotation and shear to the ideal box. That way we model the<br />
natural variation of LV size and pose and we have the<br />
opportunity to use larger number of examples for the<br />
training phase, which is important for a robust classifier.<br />
Fig. 6. Template boxes. a)Template of first classifier, only LV<br />
center has fixed position. b)Template of second classifier, fixed<br />
positions for apex and mitral valve center. c)Template of third<br />
classifier, fixed positions for all anatomical landmark points.<br />
for the third classifier. This time, the boxes will undergo<br />
finer translation, rotation, scale and shear, to detect all<br />
landmark points accurately. Each hit from the third classifier<br />
gives a final estimate of the landmark positions; the average<br />
of all given hits for each patient is taken as the final<br />
estimate. To limit our hits we pruned the classified<br />
candidates after each stage to exclude spatial outliers.<br />
3. EXPERIMENTAL SETUP<br />
The total method was developed in Matlab (version<br />
R2007b, MathWorks Inc.) The evaluation is done in three<br />
stages: training the classifiers, tuning them to a desired<br />
operating point by ROC analysis (tradeoff between correctly<br />
classified boxes and misclassified ones) and finally, testing<br />
the detection cascade. 85 manually annotated 3D patient<br />
datasets were used in the project. 60 patients are used to<br />
train the classifiers. The remaining 25 are split into batches<br />
of five for cross-validation: Each time, 20 are used for the<br />
ROC analysis and 5 for evaluation. Detection errors were<br />
determined by measuring the 3D Euclidean distance of<br />
detected and manual landmarks.<br />
The basic idea of ROC analysis is very simple: for a<br />
given trained classifier and a labeled test set, define a set of<br />
possible operating points and estimate different type of<br />
classifier errors at these points. For training our classifiers<br />
we used prTools (http://www.prtools.org/), a pattern<br />
recognition toolbox developed in Matlab, while the ROC<br />
analysis was done using PRSD Studio<br />
(http://prsdstudio.com) from PR Sys Design, which runs in<br />
Matlab.<br />
4. RESULTS<br />
We present the detection results in the four and two<br />
chamber views. A first impression of the classifiers’<br />
performance is given by the ROC curves (Figure 8). The<br />
curves indicate that our classifiers perform quite well, since<br />
we can reject almost all negatives while only losing a small<br />
fraction of the true positives. The detection errors are<br />
summarized in Table 1.<br />
Fig. 7. Example of detected LV centers for the 2 chamber view by<br />
the first classifier. The true center is marked with a green circle<br />
and the hits with cyan asterisks. The inferior (magenta), anterior<br />
(yellow) and apex (cyan) markers are also indicated.<br />
The cascade is then used for detection. First a<br />
rectangular box (of fixed size and orientation) is scanned<br />
over the 2D image. The first classifier will evaluate each<br />
box and decide whether it contains a centered left ventricle.<br />
The “hits” (detected positives, fig. 7) are used to generate<br />
new candidates for the second classifier. Around the<br />
detected LV centers rotated, scaled and slightly translated<br />
boxes are placed. After classifying these with the second<br />
classifier, the remaining hits will generate new candidates<br />
Average point errors (mm) 2C view 4C view<br />
Step1 LV center 6.5±2.5 7.9±4.1<br />
Step 2 LV center 5.8±2.4 * 7.6±4.8 *<br />
Apex 7.2±7.0 8.0±5.0<br />
Mitral valve center 5.6±5.2 8.2±4.7<br />
Step 3<br />
Apex 7.1±6.7 † 7.9±7.1 †<br />
Mitral valve center 5.2±2.8 † 4.8±2.3 *<br />
Anterior/ Septal 5.8±3.5 5.6±2.7<br />
Inferior/ Lateral 4.5±3.1 4.0±2.6<br />
Table 1. Detection errors on 2C and 4C view of 25 patients.<br />
* denotes statistically significant (paired t-test p
Apex Mitral Valve Center<br />
Proposed 7.5±3.3mm 5.0±2.5mm<br />
Orderud [10] 8.4±3.5mm 3.6±1.8mm<br />
Lu [5] 4.5±3.5mm 3.6±3.1mm<br />
Leung [8] 7.6±4.8mm 4.5±2.9mm<br />
Van Stralen [1] 14.7±8.6mm 8.4±5.7mm<br />
Interobserver [8] 7.1±2.9mm 3.8±1.3mm<br />
Intraobserver [8] 5.2±2.0mm 3.3±1.5mm<br />
Table 2. Comparison with other methods.<br />
Fig. 8. ROC curves of the second classifier in the 2C and 4C view.<br />
5. DISCUSSION<br />
We decided to follow a multilevel approach, in which the<br />
global position of the left ventricle is found first, and then<br />
rotation and scaling are found and further refined, to locate<br />
the landmark positions. The method produces a reasonably<br />
accurate estimation for the landmark positions. We can<br />
detect the points in both the 2C and 4C views (Table 1). The<br />
multilevel approach is justified, since the results are<br />
improving from stage to stage. The results improved<br />
significantly from Step 1 to Step 2. In Step 3, further<br />
improvement is achieved (although not always significant)<br />
and the individual mitral valve points are detected.<br />
We compare our approach to some published<br />
approaches which also identify the sought landmark points,<br />
the long axis or the apical views’ orientation angles (Table<br />
2). As already mentioned, Van Stralen’s method [1] uses a<br />
combination of the circular Hough transform and dynamic<br />
programming. We used this approach to detect the apex and<br />
mitral valve center in exactly the same database. This<br />
approach does not detect the mitral valve points, but only<br />
the mitral valve ring, resulting in larger errors than our<br />
method (Table 2). Compared to the results given by<br />
Orderud et al. [10] we find lower errors for the apex and<br />
mitral valve center. Leung et al. [8] outperform our method,<br />
but we have to take into consideration that that method<br />
aimed at registering markers in stress images, given the<br />
markers in the rest image, which is an easier task than<br />
detecting the markers. Table 2 also shows comparisons with<br />
the manual interobserver and intraobserver variation of the<br />
manual 3D marker identification of [7] (following the same<br />
protocol as in this study). The fact that our errors are close<br />
to those interobserver and intraobserver variabilities is very<br />
promising, since these represent the error in our ground<br />
truth of manual annotation. Lu’s method results in smaller<br />
errors than our method does. Several aspects may play a<br />
role: better performance of the steerable features, the<br />
structure of the cascade, or their much larger database (326<br />
patients from whom 244 were used for training). However,<br />
it might also be a matter of a better ground truth, since in<br />
our case the observer errors in the ground truth are such that<br />
lower error values are hard to achieve.<br />
6. CONCLUSIONS<br />
We showed that our proposed approach can detect the<br />
anatomical landmark points accurately. Our errors were<br />
comparable to the interobserver and intraobserver variability<br />
of the manually indicated landmarks, meaning that our<br />
approach is really promising. Additionally, the favorable<br />
errors rates show that a small database is sufficient when<br />
using artificial variations. The algorithm proved to be<br />
accurate and robust enough in both planes, so it could be<br />
combined with the already existing manual scheme to<br />
extract the views and result in a fully automated method of<br />
detecting 3D anatomical landmarks of the left ventricle.<br />
7. REFERENCES<br />
[1] M. Van Stralen, K. Y. E. Leung, M. M. Voormolen et al.,<br />
"Time Continuous Detection of the Left Ventricular Long Axis<br />
and the Mitral Valve Plane In 3-D Echocardiography," Ultrasound<br />
in Medicine & Biology, vol. 34, pp. 196-207, Feb 2008.<br />
[2] M. Ma, J. G. Bosch, J. H. C. Reiber, and B. P. F. Lelieveldt,<br />
"Fully Automatic Estimation of Object Pose for Segmentation<br />
Initialization: Application to Cardiac MR and Echocardiography<br />
Images," SPIE Medical Imaging, vol. 6512, p. 65123J, Feb 2007.<br />
[3] B. Georgescu, X. S. Zhou et al,, "Database-Guided<br />
Segmentation of Anatomical Structures with Complex<br />
Appearance," IEEE CVPR, vol. 2, pp. 429-436, June 2005.<br />
[4] G. Carneiro, B. Georgescu, S. Good, and D. Comaniciu,<br />
"Detection and Measurement of Fetal Anatomies from Ultrasound<br />
Images using a Constrained Probabilistic Boosting Tree," IEEE<br />
Trans Med Imaging, vol. 27, pp. 1342-1355, September 2008.<br />
[5] X. Lu, B. Georgescu, Y. Zheng, J. Otsuki, and D. Comaniciu,<br />
"AutoMPR: Automatic detection of standard planes in 3D<br />
echocardiography," IEEE <strong>ISBI</strong> 2008, pp. 1279-1282.<br />
[6] Y. Zheng, A. Barbu, B. Georgescu et al., "Fast Automatic<br />
Heart Chamber Segmentation from 3D CT Data Using Marginal<br />
Space Learning and Steerable Features," ICCV 2007, pp. 1-8.<br />
[7] A. Nemes, K. Y. E. Leung et al., "Side-by-Side Viewing of<br />
Anatomically Aligned Left Ventricular Segments in Three-<br />
Dimensional Stress Echocardiography," Echocardiography, vol.<br />
26, pp. 189-195, February 2009.<br />
[8] K. Y. E. Leung, M. van Stralen, A. Nemes et al., "Sparse<br />
Registration for Three-Dimensional Stress Echocardiography,"<br />
IEEE Trans Med Imaging, vol. 27, pp. 1568-1579, 2008.<br />
[9] P. Viola and M. Jones, "Rapid Object Detection using a<br />
Boosted Cascade of Simple Features," Proc. IEEE CVPR, 2001.<br />
[10] F. Orderud, H. Torp, and S. I. Rabben, "Automatic alignment<br />
of standard views in 3D echocardiograms using real-time<br />
tracking," SPIE Medical Imaging, vol. 7265, p. 72, Feb 2009.