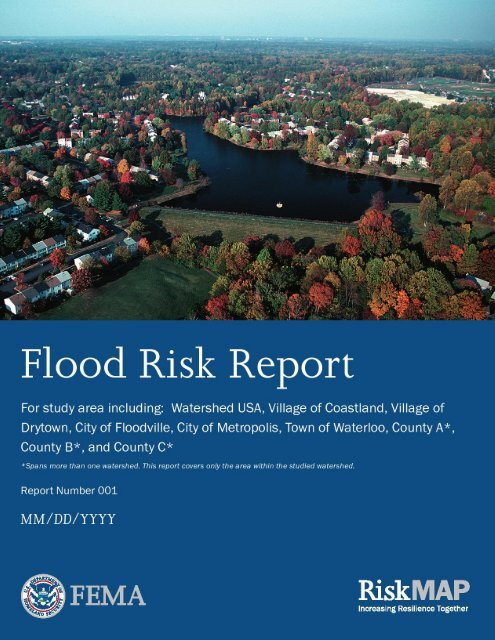
Example Flood Risk Report
Example Flood Risk Report
Example Flood Risk Report

Create successful ePaper yourself
Turn your PDF publications into a flip-book with our unique Google optimized e-Paper software.
DRAFT – WATERSHED USA FLOOD RISK REPORT 1
Preface<br />
The Department of Homeland Security (DHS), Federal Emergency Management<br />
Agency’s (FEMA) <strong>Risk</strong> Mapping, Assessment, and Planning (<strong>Risk</strong> MAP) program<br />
provides States, Tribes and local communities with flood risk information and<br />
tools that they can use to increase their resilience to flooding and better protect<br />
their citizens. By pairing accurate floodplain maps with risk assessment tools<br />
and planning and outreach support, <strong>Risk</strong> MAP has transformed traditional flood<br />
mapping efforts into an integrated process of identifying, assessing,<br />
communicating, planning for, and mitigating flood-related risks.<br />
This <strong>Flood</strong> <strong>Risk</strong> <strong>Report</strong> (FRR) provides non-regulatory information to help local<br />
or Tribal officials, floodplain managers, planners, emergency managers, and<br />
others better understand their flood risk, take steps to mitigate those risks, and<br />
communicate those risks to their citizens and local businesses.<br />
Because flood risk often extends beyond community limits, the FRR provides<br />
flood risk data for the entire study area as well as for each individual<br />
community. This also emphasizes that flood risk reduction activities may impact<br />
areas beyond jurisdictional boundaries.<br />
<strong>Flood</strong> risk is always changing, and there may be other studies, reports, or other<br />
sources of information available that provide information that is more<br />
comprehensive. The FRR is not intended to be regulatory or the final<br />
authoritative source of all flood risk data in the project area. Rather, it should be<br />
used in conjunction with other data sources to provide a comprehensive picture<br />
of flood risk within the project area.<br />
DRAFT – WATERSHED USA FLOOD RISK REPORT 1
Table of Contents<br />
Preface ........................................................................................................ 1<br />
1. Introduction ......................................................................................... 3<br />
1.1 About <strong>Flood</strong> <strong>Risk</strong>........................................................................... 3<br />
1.2 Uses of this <strong>Report</strong> ....................................................................... 4<br />
1.3 Sources of <strong>Risk</strong> Assessment Data Used ........................................ 5<br />
1.4 Related Resources ........................................................................ 6<br />
2. <strong>Risk</strong> Analysis ......................................................................................... 7<br />
2.1 Overview ...................................................................................... 7<br />
2.2 Analysis of <strong>Risk</strong> ............................................................................. 7<br />
2.2.1 Changes Since Last FIRM .......................................................... 7<br />
2.2.2 <strong>Flood</strong> Depth and Analysis Grids ............................................... 9<br />
2.2.3 HAZUS Estimated Loss Information ........................................ 10<br />
2.2.3 Areas of Mitigation Interest ................................................... 12<br />
3. <strong>Flood</strong> <strong>Risk</strong> Analysis Results ................................................................ 20<br />
3.1 <strong>Flood</strong> <strong>Risk</strong> Map ........................................................................... 21<br />
3.1 Watershed USA Summary .......................................................... 23<br />
3.2 Village of Coastland Summary (CID 0123465) ........................... 25<br />
3.3 Village of Drytown Summary (CID 0123475) ............................. 27<br />
3.4 City of <strong>Flood</strong>ville Summary (CID 0123456) ................................ 29<br />
3.5 City of Metropolis Summary (CID 0124386) .............................. 32<br />
3.6 Town of Waterloo Summary (CID 0123468) .............................. 34<br />
3.7 County A Summary (CID 0123471) ............................................. 36<br />
3.8 County B Summary (CID 0123482) ............................................. 38<br />
3.9 County C Summary (CID 0123485) ............................................. 40<br />
4. Actions to Reduce <strong>Flood</strong> <strong>Risk</strong> ............................................................ 42<br />
4.1 Types of Mitigation Actions ....................................................... 42<br />
4.2 Identifying Specific Actions for your Community ...................... 44<br />
4.3 Mitigation Programs and Assistance .......................................... 46<br />
A. Appendix A: Acronyms and Definitions ......................................... 48<br />
B. Appendix B: Additional Resources ................................................. 53<br />
C. Appendix C: Data Used to Develop <strong>Flood</strong> <strong>Risk</strong> Products ............... 55<br />
DRAFT – WATERSHED USA FLOOD RISK REPORT 2
FLOOD RISK REPORT<br />
1. Introduction<br />
<strong>Flood</strong>ing is a natural part of our<br />
world and our communities. It<br />
becomes a hazard only when it<br />
intersects with the built<br />
environment.<br />
Which picture below shows<br />
more flood risk<br />
1.1 About <strong>Flood</strong> <strong>Risk</strong><br />
<strong>Flood</strong>s are naturally occurring phenomena that can and do happen almost<br />
anywhere. In its most basic form, a flood is an accumulation of water over<br />
normally dry areas. <strong>Flood</strong>s become hazardous to people and property when<br />
they inundate an area where development has occurred, causing losses. Mild<br />
flood losses may have little impact on people or property, such as damage to<br />
landscaping or the generation of unwanted debris. Severe flood losses can<br />
destroy buildings, crops, and cause severe injuries or death.<br />
Calculating <strong>Flood</strong> <strong>Risk</strong><br />
It is not enough to simply identify where flooding may occur. Just because one<br />
knows where a flood occurs does not mean they know the risk of flooding. The<br />
most common method for determining flood risk, also referred to as<br />
vulnerability, is to identify the probability of flooding and the consequences of<br />
flooding:<br />
<strong>Flood</strong> <strong>Risk</strong> (or Vulnerability) = Probability x Consequences; where<br />
Probability = the likelihood of occurrence<br />
Consequences = the estimated impacts associated with the occurrence<br />
Even if you assume that the flood in<br />
both pictures was the same<br />
probability- let’s say a 10%-percentannual-chance<br />
flood -- the<br />
consequences in terms of property<br />
damage and potential injury as a<br />
result of the flood in the bottom<br />
picture are much more severe.<br />
Therefore, the flood risk in the area<br />
shown on the bottom picture is<br />
higher.<br />
The probability of a flood is the likelihood that a flood will occur. The<br />
probability of flooding can change based on physical, environmental,<br />
and/or engineering factors. Factors affecting the probability that a<br />
flood will impact an area range from changing weather patterns to the<br />
existence of mitigation projects. The ability to assess the probability of a<br />
flood, and the level of accuracy for that assessment, is also influenced<br />
by modeling methodology advancements, better knowledge, and longer<br />
periods of record for the water body in question.<br />
The consequences of a flood are the estimated impacts associated with<br />
the flood occurrence. Consequences relate to humans activities within<br />
an area and how a flood impacts the natural and built environment.<br />
<strong>Risk</strong> MAP <strong>Flood</strong> <strong>Risk</strong> Products<br />
Through <strong>Risk</strong> MAP, FEMA provides communities with updated <strong>Flood</strong> Insurance<br />
Rate Maps (FIRMs) and <strong>Flood</strong> Insurance Studies (FISs) that focus on the<br />
probability of floods and describe where and how often flooding may occur.<br />
FEMA understands that flood risk is dynamic and that flooding does not stop at<br />
a line on a map, and provides the following flood risk products:<br />
DRAFT – WATERSHED USA FLOOD RISK REPORT 3
A <strong>Flood</strong> <strong>Risk</strong> <strong>Report</strong> (FRR) that presents key risk analysis data for the<br />
study area.<br />
A <strong>Flood</strong> <strong>Risk</strong> Map (FRM), found in Section 3.1 of this document, shows<br />
risk areas at risk and is provided as an exhibit within the FRR. More<br />
information about the data shown on the map can be found in Section<br />
2.<br />
A <strong>Flood</strong> <strong>Risk</strong> Database (FRD) houses the flood risk data developed<br />
during the course of the flood risk analysis to the raw flood risk data<br />
that can be used and updated by the community. After the <strong>Risk</strong> MAP<br />
study is complete, this data can be used in many ways to visualize and<br />
communicate flood risk within the study area.<br />
Whether or not an area might<br />
flood is one consideration. The<br />
extent to which it might flood adds<br />
a necessary dimension to that<br />
understanding.<br />
These products provide flood risk information at both the study area level and<br />
community level (for those portions of each community within the study area).<br />
They demonstrate how decisions made within a study area can impact<br />
properties downstream, upstream, or both. Community-level information is<br />
particularly useful for mitigation planning and emergency management<br />
activities, which often occur at a jurisdictional level.<br />
1.2 Uses of this <strong>Report</strong><br />
The goal of this report is to help inform and enable communities and Tribes take<br />
action to reduce flood risk. State, local, and Tribal officials can use the summary<br />
information provided in this report, in conjunction with the data in the FRD, to:<br />
Vulnerability of infrastructure is<br />
another important consideration.<br />
Update local hazard mitigation plans – As required by the 2000 Federal<br />
Stafford Act, local hazard mitigation plans must be updated every five<br />
(5) years. Summary information presented in Section 3 of this report<br />
and the <strong>Flood</strong> <strong>Risk</strong> Map can be used to identify areas that may need<br />
additional focus when updating the risk assessment section of a local<br />
hazard mitigation plan. Information found in Section 4 pertains to the<br />
different mitigation techniques and programs and can be used to inform<br />
decisions related to the mitigation strategy of local plans.<br />
Update community comprehensive plans – Planners can use flood risk<br />
information in the development and/or update of comprehensive plans,<br />
future land use maps, and zoning regulations. For example, zoning<br />
codes may be changed to better provide for appropriate land uses in<br />
high hazard areas.<br />
Update emergency operations and response plans – Emergency<br />
managers can identify low risk areas for potential evacuation and<br />
sheltering, and can assist first responders in avoidance of areas of high<br />
depth flood water. <strong>Risk</strong> assessment results information may show<br />
vulnerable areas, facilities and infrastructure for which planning for<br />
continuity of operations plans (COOP), continuity of government (COG)<br />
plans, and emergency operations plans (EOP) would be essential.<br />
Develop hazard mitigation projects – Local officials (e.g., planners,<br />
DRAFT – WATERSHED USA FLOOD RISK REPORT 4
<strong>Flood</strong>ing along the Wabash River<br />
contributed to Clark County,<br />
Illinois’ Federal disaster<br />
declaration on June 24, 2008.<br />
public works officials) can use flood risk information to re-evaluate and<br />
prioritize mitigation actions in local hazard mitigation plans.<br />
Communicate flood risk – Local officials can use the information in this<br />
report to communicate with property owners, business owners, and<br />
other citizens about flood risks, changes since the last FIRM, and areas<br />
of mitigation interest. The format of the report allows community<br />
information to be extracted in a fact sheet format.<br />
Inform the modification of development standards – <strong>Flood</strong>plain<br />
managers, planners and public works officials can use information in<br />
this report to support the adjustment of development standards for<br />
certain locations. For example, heavily developed areas tend to<br />
increase floodwater runoff because paved surfaces cannot absorb<br />
water, indicating a need to adopt or revise standards that provide for<br />
appropriate stormwater retention.<br />
The flood risk products provided under <strong>Risk</strong> MAP are “Non-regulatory”<br />
products. They are available and intended for community use, but are not tied<br />
to the regulatory development and insurance requirements of the National<br />
<strong>Flood</strong> Insurance Program nor are required to be used. They may be used as<br />
regulatory products by communities if state and local enabling authorities<br />
authorize their use.<br />
Possible users of this report include:<br />
Local Elected Officials<br />
<strong>Flood</strong>plain Managers<br />
Community Planners<br />
Emergency Managers<br />
Public Works Officials<br />
Other Special Interests (e.g., watershed conservation groups,<br />
environmental awareness organizations, etc.)<br />
1.3 Sources of <strong>Risk</strong> Assessment Data Used<br />
To assess potential community losses or the consequences portion of the “risk,”<br />
equation, the following data was collected:<br />
Information about local assets or resources at risk of flooding<br />
Information about the physical features and human activities that<br />
contribute to that risk<br />
Information about where the risk is most severe<br />
The sources of risk information FEMA used to develop this report included:<br />
FEMA generated HAZUS-MH analyses<br />
New engineering analyses (e.g., hydrology and hydraulics modeling) to<br />
develop new flood boundaries<br />
DRAFT – WATERSHED USA FLOOD RISK REPORT 5
Locally-supplied data (see Appendix C for a description)<br />
Sources identified during the Discovery process<br />
1.4 Related Resources<br />
For a more comprehensive picture of a community’s flood risk, FEMA<br />
recommends that State and local officials use the information provided in this<br />
report in conjunction with other sources of flood risk data, such as those listed<br />
below.<br />
<strong>Flood</strong> Insurance Rate Maps (FIRMs) and <strong>Flood</strong> Insurance Studies (FISs).<br />
This information indicates areas with specific flood hazards by<br />
identifying the limit and extent of the 1-percent-annual-chance<br />
floodplain and the 0.2-percent-annual-chance floodplain. FIRMs and<br />
FISs do not identify all floodplains in a study area. The FIS includes<br />
summary information regarding other frequencies of flooding, as well as<br />
flood profiles for riverine sources of flooding. In rural areas, and areas<br />
for which flood hazard data are not available, the 1-percent-annualchance<br />
floodplain may not be identified. In addition, the 1-percentannual-chance<br />
floodplain may not be identified for flooding sources<br />
with very small drainage areas (less than 1 square mile).<br />
<strong>Flood</strong> or multi-hazard mitigation plans. Local hazard mitigation plans<br />
include risk assessments that contain flood risk information and<br />
mitigation strategies that identify community priorities and actions to<br />
reduce flood risk. This report was informed by any existing mitigation<br />
plans in the study area.<br />
<strong>Example</strong>s of how FEMA data<br />
can be leveraged to identify and<br />
measure vulnerability.<br />
Other risk assessment reports. HAZUS-MH, a free risk assessment<br />
software application from FEMA, is the most widely used flood risk<br />
assessment tool available. HAZUS-MH can run different scenario floods<br />
(riverine and coastal) to determine how much damage might occur as a<br />
result. HAZUS-MH can also be used by community officials to evaluate<br />
flood damage that can occur based on new/proposed mitigation<br />
projects or future development patterns and practices. HAZUS-MH can<br />
also run specialized risk assessments such as what happens when a dam<br />
or levee fails. <strong>Flood</strong> risk assessment tools are available through other<br />
agencies as well, including the National Oceanic and Atmospheric<br />
Administration (NOAA) and the U.S. Army Corps of Engineers (USACE).<br />
Other watershed reports may exist that have a different focus, such as<br />
water quality, but that may also contain flood risk and risk assessment<br />
information. See Appendix B for additional resources.<br />
DRAFT – WATERSHED USA FLOOD RISK REPORT 6
2. <strong>Risk</strong> Analysis<br />
2.1 Overview<br />
<strong>Flood</strong>ing impacts non-populated<br />
areas too, such as agricultural<br />
lands and wildlife habitats.<br />
.<br />
State and Local Hazard Mitigation<br />
Plans are required to have a<br />
comprehensive all-hazard risk<br />
assessment. The flood risk<br />
analyses in the FRR, FRM, and<br />
FRD can inform the flood hazard<br />
portion of a community’s or state’s<br />
risk assessment. Further, data in<br />
the flood risk database can be<br />
used to develop information which<br />
meets the requirements for risk<br />
assessments as it relates to the<br />
hazard of flood in hazard<br />
mitigation plans.<br />
<strong>Flood</strong> hazard identification uses FIRMs and FIS identify where flooding can occur<br />
along with the probability and depth of that flooding. <strong>Flood</strong> risk assessment is<br />
the systematic approach to identify how flooding impacts the environment. In<br />
hazard mitigation planning, flood risk assessments are the basis for mitigation<br />
strategies and actions by defining the hazard and enabling informed decision<br />
making. To fully assess flood risk requires the following:<br />
Identification of the flooding source and determination of the<br />
probability of occurrence of the flood hazard<br />
Development of a complete profile of the flood hazard including<br />
historical occurrence and previous impacts<br />
Inventory of assets located in the identified flood hazard area<br />
Estimation of potential future flood losses caused by exposure to the<br />
area of flood hazard<br />
<strong>Flood</strong> risk analyses are different methods used in flood risk assessment to help<br />
quantify and communicate flood risk. <strong>Flood</strong> risk analysis can be done on a large<br />
scale (state, community) level and on a very small scale (parcel, census block).<br />
Advantages of large scale flood risk analysis, especially at the watershed level,<br />
can identify how actions and development in one community can affect areas<br />
up- and downstream. On the parcel or census block level, flood risk analysis can<br />
provide actionable data to individual property owners so they can take<br />
appropriate mitigation actions.<br />
2.2 Analysis of <strong>Risk</strong><br />
The FRR, FRM, and FRD contain four general types of risk analysis to help<br />
describe and visualize the flood risk at the jurisdictional levels:<br />
1. Changes Since Last FIRM<br />
2. Water Surface, <strong>Flood</strong> Depth and Analysis Grids<br />
3. HAZUS Estimated Loss Information<br />
4. Areas of Mitigation Interest<br />
2.2.1 Changes Since Last FIRM<br />
The Changes Since Last FIRM (CSLF) dataset, stored in the FRD and shown in<br />
Section 3 of this report, shows where changes to flood risk may occurred since<br />
the county’s last FIRM 1 was developed. Communities can use this information to<br />
update their mitigation plans, specifically quantifying “what is at risk” and<br />
identifying possible mitigation activities.<br />
1 Note: If the existing effective FIRM has not been modernized or is not in the countywide format,<br />
this information will not be included.<br />
DRAFT – WATERSHED USA FLOOD RISK REPORT 7
The Changes Since Last FIRM dataset identifies changes in the Special <strong>Flood</strong><br />
Hazard Area and floodway boundary changes since the previous mapFIRM was<br />
developed. These datasets quantify land area increases and decreases to the<br />
SFHA and floodway, as well as areas where the flood zone designation has<br />
changed (e.g., Zone A to AE, AE to VE, shaded Zone X protected by levee to AE<br />
for de-accredited levees). These areas of change are also compared to the built<br />
environment and expressed as an estimated number of buildings and population<br />
affected by each change.<br />
The Changes Since Last FIRM dataset is created in areas that were previously<br />
mapped using digital FIRMs. The Changes Since Last FIRM dataset for this<br />
project area includes:<br />
Any changes to the existing floodplain designations (Zone A to Zone AE<br />
for example)<br />
Any changes to the extent of the mapped floodway<br />
Structures: The total estimated count of affected buildings within the<br />
area of change. The e-data will only be made available in cases where<br />
the local jurisdiction is able to provide accurate building footprint data<br />
indicating the location of structures in and adjacent to the identified<br />
floodplains).<br />
<strong>Flood</strong>plain maps have evolved<br />
considerably from the older<br />
paper-based FIRMs to the latest<br />
digital products and datasets.<br />
Population: The total estimated affected population within the area of<br />
change. The data will only be made available in cases where the local<br />
jurisdiction is able to provide population data that accompanies the<br />
structure data noted above.<br />
CSLF data can be used to<br />
communicate changes in the<br />
physical flood hazard area (size,<br />
location) as part of the release of<br />
new FIRMS. It can also be used in<br />
the development or update of<br />
hazard mitigation plans to describe<br />
changes in hazard as part of the<br />
hazard profile.<br />
CLSF Data is shown in the FRR,<br />
and underlying data is stored in<br />
the FRD.<br />
Within the FRD, additional data may be provided called contributing engineering<br />
factors. These will not be shown in the FRR. These data are digital attributes for<br />
the areas of change and may include:<br />
o<br />
o<br />
o<br />
o<br />
o<br />
o<br />
o<br />
Changes in peak discharges<br />
Changes to the modeling methodology (e.g., tide gage analysis)<br />
Changes in flood control structures (e.g., dams, levees, groins<br />
and breakwaters)<br />
Changes to hydraulic structures (e.g., bridges, culverts)<br />
Sedimentation<br />
Erosion<br />
Man-made changes to the channel (e.g., realignment,<br />
improvement) Changes occurred to runoff (if any)<br />
DRAFT – WATERSHED USA FLOOD RISK REPORT 8
o<br />
Changes to the primary frontal dunes (if coastal area)<br />
It should be noted that contributing engineering factors will only be identified in<br />
cases where the factor is identified as a change since the last FIRM was<br />
published. Within the scope of a typical flood study, there will always be<br />
limitations on identifying factors contributing to the floodplain change. As such,<br />
the intent of this dataset is to provide a general sense of why the floodplain has<br />
changed rather than explaining the reason for each and every change.<br />
2.2.2 Water Surface, <strong>Flood</strong> Depth and Analysis Grids<br />
Grids are FEMA datasets provided in the FRD to better describe the risk of the<br />
flood hazard. While the FIRM and FIS describe “what” is at risk by identifying<br />
the hazard areas, water surface, flood depth and analysis grids can help define<br />
“how bad” the risk is within those identified areas. These grids are intended to<br />
be used by communities for additional analysis, enhanced visualization, and<br />
communication of flood risks for hazard mitigation planning and emergency<br />
management. Grids provided in the FRD for this project area include:<br />
Water Surface Elevation Grids: This dataset represents the raw results of the<br />
hydrologic and hydraulic analysis before adjustments are made to account<br />
for influences associated with other flooding sources.<br />
<strong>Flood</strong> Depth Grids (for the flood frequencies included in the FIS): The multifrequency<br />
flood depth and analysis grids show depth, which is calculated as<br />
the difference (in feet) between the water surface elevation and the<br />
ground, and relies on the Water Surface Elevation Grid. Five grids will be<br />
delivered for riverine (non-leveed) areas for the standard flood frequencies<br />
(10%, 4%, 2%, 1% and 0.2%). Coastal and levee areas only receive the 1-<br />
percent annual chance grid.<br />
Grid data can make flood mapping<br />
more informative. The top image is a<br />
flood depth grid showing relative<br />
depths of water in a scenario flood<br />
event. The bottom image is a<br />
percent annual chance of flooding<br />
grid which shows inundation areas of<br />
various frequency floods.<br />
Percent Annual Chance of <strong>Flood</strong>ing Grid: A grid dataset that represents the<br />
percent-annual-chance of flooding for locations along a flooding source.<br />
This grid uses the five standard flood frequencies.<br />
Probability of <strong>Flood</strong>ing in a 30-Year Period Grid: A grid dataset that<br />
represents the estimated likelihood of flooding at least once within a 30-<br />
year period, which is the average lifespan for a home mortgage, for all<br />
locations within the extent of the 1-percent-annual-chance and 0.2-percentannual-chance<br />
floodplain.<br />
Water Surface Elevation Change Grid: This dataset provides the ability to see<br />
vertical changes in the water surface elevation between the existing FIRM<br />
and the revised FIRM. This dataset would be the equivalent of the Changes<br />
Since Last FIRM dataset, but as a vertical analysis as opposed to a horizontal<br />
analysis since last FIRM.<br />
DRAFT – WATERSHED USA FLOOD RISK REPORT 9
Grid data can be used to<br />
communicate the variability of<br />
floodplains such as where<br />
floodplains are particularly deep or<br />
hazardous, where residual risks lie<br />
behind levees, and where losses<br />
may be great after a flood event.<br />
For mitigation planning, grid data<br />
can inform the hazard profile and<br />
vulnerability analysis (what is at<br />
risk for different frequencies) and<br />
can be used for preliminary<br />
benefit-cost analysis screening.<br />
For floodplain management, higher<br />
regulatory standards can be<br />
developed in higher hazard flood<br />
prone areas (i.e., 10% chance<br />
floodplains or deep floodplains).<br />
Grid data is stored in the FRD and<br />
a list of available grid data is<br />
provided in the FRR.<br />
Visualizations of grids (maps) are<br />
not provided.<br />
1-Percent Plus <strong>Flood</strong> Depth Grids: This riverine-only dataset communicates<br />
the inherent uncertainty associated with the 1-percent- annual-chance flood<br />
elevation band by highlight the areas subject to inundation by the upper<br />
limit of the 1-percent- annual-chance flood discharge confidence interval.<br />
Velocity Grids: This dataset describes the average flood velocity that occurs<br />
within the floodplain. Velocity Grids can be used to increase public<br />
awareness of flood hazards associated with rapidly moving floodwaters.<br />
Top of Levee Depth Grids: This dataset allows for visualization and flood<br />
loss calculation for worst case scenarios in areas protected by levees.<br />
Toe of Levee Depth Grids: This dataset may be used to communicate the<br />
flood frequency that exists when levee first starts to provide flood<br />
protection.<br />
Water Surface or Depth Grids Based Upon Additional <strong>Flood</strong> Frequencies: In<br />
addition to the standard flood frequencies (10%, 4%, 2%, 1% and 0.2%) this<br />
dataset is provided when additional flood frequencies are calculated, such as<br />
a 20-percent-annual-chance (5-year), or 0.5-percent- annual-chance (200-<br />
year) event.<br />
Annualized Depth Grids: This dataset would communicate potential<br />
annualized losses derived from the standard flood frequency data that will<br />
normally be created as part of a new or revised flood hazard study. As<br />
indicated above, those flood frequencies are 10%, 4%, 2%, 1% and 0.2%<br />
annual chance events.<br />
These depth grids form the basis for refined HAZUS loss estimates (as presented<br />
in a table in Section 3 of this report) and are used to calculate potential flood<br />
losses for display on the <strong>Flood</strong> <strong>Risk</strong> Map and for tabular presentation in the FRR.<br />
For smaller projects (such as levee areas) the depth grids may also be displayed<br />
on the <strong>Flood</strong> <strong>Risk</strong> Map to assist with site specific risk visualization. Depth grids<br />
may also be used for a variety of ad-hoc risk visualization and risk mitigation<br />
initiatives.<br />
2.2.3 HAZUS Estimated Loss Information<br />
HAZUS-MH is a loss estimation<br />
methodology developed by<br />
FEMA for the flood, wind, and<br />
earthquake hazards. The<br />
methodology and data<br />
established by HAZUS can also<br />
be used to study other hazards.<br />
<strong>Flood</strong> loss estimates provided in the FRR were developed using a FEMA flood<br />
risk assessment tool, HAZUS-MH. HAZUS, originally developed for earthquake<br />
risk assessment, has evolved into a multi-hazard tool developed and distributed<br />
by FEMA that can provide risk assessment information for floods, earthquakes,<br />
and hurricane winds. HAZUS-MH is a nationally accepted, consistent flood risk<br />
assessment tool to assist individuals and communities to create a more accurate<br />
picture of flood risk. Some benefits of using HAZUS-MH include:<br />
Outputs that can enhance state and local mitigation plans and help<br />
screening for cost-effectiveness in FEMA mitigation grant programs<br />
DRAFT – WATERSHED USA FLOOD RISK REPORT 10
HAZUS estimated loss data can be<br />
used in many ways to support local<br />
decision making and explaining<br />
flood risk. For mitigation planning<br />
purposes, loss data can be used to<br />
help meet requirements to develop<br />
loss information for the hazard of<br />
flood. Also, the FRM can show<br />
where flood risk varies by<br />
geographic location. For<br />
emergency management, HAZUS<br />
data can help forecast losses<br />
based on predicted events and the<br />
assignment of resources can be<br />
made accordingly. Loss<br />
information can support floodplain<br />
management efforts, including<br />
those to adopt higher regulatory<br />
standards. Also, awareness of<br />
exposed essential facilities and<br />
infrastructure encourages<br />
mitigation actions to protect<br />
citizens from service disruption<br />
should flooding occur.<br />
HAZUS estimated loss data is<br />
summarized in the FRR and on the<br />
FRM, and stored in the FRD.<br />
Allows analysis refinement though updating inventory data, and integrating<br />
data produced using other flood models<br />
Widely available support documents and networks (HAZUS Users Groups or<br />
HUGs)<br />
Files from the FRD can be imported into HAZUS-MH to develop other risk<br />
assessment information including:<br />
Debris generated after a flood event<br />
Dollar exposure of the agricultural products in a study region<br />
Exposure of the utility systems in the region<br />
Exposure of vehicles in the study region<br />
Damages and functionality of lifelines such as highway and rail bridges,<br />
potable water, and wastewater facilities<br />
The FRR primarily uses specific flood risk analysis methods which are<br />
summarized below:<br />
Scenario Loss Estimates: Scenario losses have been generated by HAZUS for<br />
four events: 10%, 2%, 1% and 0.2%. In the FRR, these losses are expressed in<br />
dollar amounts and are provided for the project study area only, even though<br />
results are shown watershed wide and at the local jurisdiction level.<br />
Loss estimates are based on best available data, and the methodologies applied<br />
result in an approximation of risk. These estimates should be used to<br />
understand relative risk from flood and potential losses. Uncertainties are<br />
inherent in any loss estimation methodology, arising in part from<br />
approximations and simplifications that are necessary for a comprehensive<br />
analysis (e.g., incomplete inventories, demographics, or economic parameters).<br />
<strong>Flood</strong> loss estimates are being provided at the project and at the community<br />
level for multiple flood frequencies including:<br />
Residential Asset Loss – These include direct building losses (estimated costs<br />
to repair or replace the damage caused to the building) for all classes of<br />
residential structures including single family, multi-family, manufactured<br />
housing, group housing, and nursing homes. This value also includes<br />
content losses.<br />
Commercial Asset Loss – These include direct building losses for all classes<br />
of commercial buildings including retail, wholesale, repair, professional<br />
services, banks, hospitals, entertainment, and parking facilities. This value<br />
also includes content and inventory losses.<br />
Other Asset Loss – This includes losses for facilities categorized as industrial,<br />
agricultural, religious, government, and educational . This value also<br />
includes content and inventory losses.<br />
DRAFT – WATERSHED USA FLOOD RISK REPORT 11
Essential Facility Losses –– Essential facilities are defined in HAZUS-MH as<br />
facilities which provide services to the community and should be functional<br />
after a flood, including schools, police stations, fire stations, medical<br />
facilities, and emergency operation centers. These facilities would otherwise<br />
be considered critical facilities for mitigation planning purposes. Estimated<br />
damages (in terms of loss of function) for essential facilities are determined<br />
on a site-specific basis based on latitude and longitude. For this report,<br />
HAZUS calculates the types and numbers of essential facilities impacted.<br />
Infrastructure – For analysis of infrastructure, HAZUS-MH supports the<br />
analysis of transportation systems and lifeline utility systems. Transportation<br />
systems include highways, railways, light railway, bus, ports and harbors,<br />
ferries, and airport systems. Utility systems include potable water systems,<br />
wastewater, oil, natural gas, electric power, and communication systems.<br />
For this report, HAZUS calculates the types of infrastructure impacted..<br />
Business Disruption – The losses associated with the inability to operate a<br />
business because of the damage sustained during the flood. Losses include<br />
inventory losses, relocation costs, income losses, rental income losses, wage<br />
losses, and direct output losses.<br />
Annualized Losses –Annualized losses are calculated using HAZUS-MH by<br />
taking losses from multiple events over different frequencies and expressing<br />
the long term average by year. This factors in historic patterns of frequent<br />
smaller floods with infrequent but larger events to provide a balanced<br />
presentation of flood damage.<br />
Loss Ratio: The loss ratio expresses the scenario losses divided by the total<br />
building value for a local jurisdiction and can be a gage to determine overall<br />
community resilience as a result of a scenario event. For example, a loss ratio of<br />
5% for a given scenario would indicate that a local jurisdiction would be more<br />
resilient and recover easier from a given event versus a loss ratio of 75% which<br />
would indicate widespread losses. Annualized loss ratio uses the annualized loss<br />
data as a basis for computing the ratio. Loss ratios are not computed for<br />
business disruption. These data are presented in the FRR.<br />
HAZUS <strong>Flood</strong> <strong>Risk</strong> Value: On the FRM, flood risk is expressed the following five<br />
categories: very low, low, medium, high, and very high for census blocks that<br />
have flood risk. It is based on the 1% annual chance total asset loss by census<br />
block.<br />
2.2.3 Areas of Mitigation Interest (AoMI)<br />
Many factors contribute to flooding and flood losses. Some are natural, some<br />
are not. In response to these risks there has been a focus by the Federal<br />
Government, State agencies, and local jurisdictions to mitigate properties<br />
against the impacts of flood hazards so that future losses and impacts can be<br />
reduced. AoMIs are important to define more comprehensive picture of flood<br />
risk and mitigation activity in a watershed, identifying target areas and potential<br />
DRAFT – WATERSHED USA FLOOD RISK REPORT 12
projects for flood hazard mitigation, encouraging local collaboration, and<br />
communicating how various mitigation activities can successfully reduce flood<br />
risk.<br />
The FRR and FRM focus on identifying AoMIs that may be contributing<br />
(positively or negatively) on flooding and flood losses in the study area. AoMIs<br />
are identified through revised hydrologic and hydraulic and/or coastal analyses,<br />
other studies, or previous flood studies; community supplied data from<br />
mitigation plans, floodplain management plans, and local surveys; and the<br />
mining of Federal government databases (e.g., flood claims, disaster grants, and<br />
data from other agencies). Below is a list of the types of AoMIs that may be<br />
located in the project area.<br />
Dams<br />
A dam is a barrier built across a waterway for impounding water. Dams vary<br />
impoundments that are hundreds of feet tall and contain thousands of acre-feet<br />
of water (e.g., Hoover Dam) to small dams that are a few feet high and contain<br />
only a few acre-feet of water (e.g., small residential pond). “Dry dams”, which<br />
are designed to contain water only during floods and do not impound water<br />
except for the purposes of flood control, include otherwise dry land behind the<br />
dam.<br />
While most modern large dams are highly engineered structures with<br />
components such as impervious cores and emergency spillways, most smaller<br />
and older dams are not. State dam safety programs emerged in the 1960s and it<br />
wasn’t until 1979 that the first Federal Guidelines for Dam Safety were prepared.<br />
By this time, the vast majority of dams in the United States had already been<br />
constructed.<br />
Why is a dam an Area of Mitigation Interest<br />
Dams vary in size and shape, the<br />
amount of water they impound,<br />
and the hazard classification they<br />
have been assigned.<br />
This dam failure caused flooding<br />
that damaged several homes<br />
and vehicles.<br />
Many older dams were not built to any particular standard and thus may not<br />
withstand extreme rainfall events. Older dams in some parts of the country<br />
were made out of an assortment of materials. These structures may not<br />
have any capacity to release water and have the risk of being overtopped<br />
which could result in catastrophic failure.<br />
Even dams that follow current dam safety programs may not be regulated<br />
as downstream risk may have changed since the dam was constructed.<br />
Years after being built, a house, subdivision, or other development may be<br />
put in the area downstream of the dam where a possible dam failure could<br />
result in damage. Since these dams are not regulated, it is impossible to<br />
predict how safe they are.<br />
A significant dam failure risk is structural deficiencies associated with older<br />
dams that are not being adequately addressed today through needed<br />
inspection/ maintenance practices<br />
For larger dams that were constructed in the past, a flood easement may<br />
have been obtained on a property; however, since that time the construction<br />
DRAFT – WATERSHED USA FLOOD RISK REPORT 13
of buildings, though not allowed, were constructed anyway. These buildings<br />
were usually constructed in violation of the flood easement.<br />
When a new dam is constructed, the placement of such a large volume of<br />
material in a floodplain area (if that is the dam location) will displace flood<br />
waters and can alter how the watercourse flows. This can result in flooding<br />
upstream, downstream, or both.<br />
For many dams, the dam failure inundation zone is not known. This is the<br />
area that would be flooded if the dam failed and the impoundment behind<br />
the dam drained. Not having knowledge of these risk areas could lead to<br />
unprotected development in these zones. Also, for the larger federal dams<br />
that do have inundation mapping, it is frequently restricted to “For Official<br />
Use Only” and not made available to the public do to terrorism concerns<br />
Levees and Significant Levee-Like Structures (Embankments)<br />
FEMA defines a levee as “a man-made structure, usually an earthen<br />
embankment, designed and constructed in accordance with sound engineering<br />
practices to contain, control, or divert the flow of water so as to provide<br />
protection from temporary flooding.” Levees are sometimes referred to as dikes.<br />
Soil used to construct a levee is compacted to make the levee as strong and<br />
stable as possible. To protect against erosion and scouring, levees can be<br />
covered with everything from grass and gravel to harder surfaces like stone<br />
(riprap), asphalt, or concrete.<br />
Similar to dams, levees have not been regulated in terms of safety and design<br />
standards until relatively recently. Many older levees were constructed in a<br />
variety of ways, from a farmer piling dirt along a stream to prevent nuisance<br />
flooding to levees made out of old mining spoil material. As engineered<br />
structures, levees are designed to a certain height and can fail if a flood event is<br />
greater than anticipated.<br />
A floodwall is a vertical wall that is built to provide protection from a flood in a<br />
similar manner as a levee. Typically made of concrete or steel, floodwalls often<br />
are erected in urban locations where there is not enough room for a levee.<br />
<strong>Flood</strong>walls are sometimes constructed on a levee crown to increase the levee’s<br />
height.<br />
For more information about the<br />
risks associated with living behind<br />
levees, consult the publication “So<br />
You Live Behind a Levee!”<br />
published by the American Society<br />
of Civil Engineers at<br />
http://content.asce.org/ASCELeve<br />
eGuide.html<br />
Most new dams and levees are engineered to a certain design standard – if that<br />
design is exceeded, they could be overtopped and fail catastrophically causing<br />
more damage than if the levee wasn’t there in the first place. Few levees<br />
anywhere in the nation are built to more than a 1-percent-annual-chance flood<br />
protection rating, and the areas behind them are still at some risk for flooding.<br />
This threat is called residual risk. In some states, residual risk areas can extend<br />
up to 15 miles from a riverbank. Although the probability of flooding may be<br />
lower because a levee exists, risk is nonetheless still present. The American<br />
Society of Civil Engineers’ publication “So You Live Behind a Levee!” provides an<br />
in-depth explanation of levee and residual risk.<br />
DRAFT – WATERSHED USA FLOOD RISK REPORT 14
Major embankments, on the other hand, are rarely designed with any flood<br />
protection level in mind. Railroads, road abutments, and canals – especially in<br />
the Western United States – are not considered levees or dams and have issues<br />
such as unknown construction materials/methods, and are not regulated from a<br />
flood risk standpoint.<br />
How can levees and major embankments contribute to flooding and flood<br />
losses<br />
Canal levee breaches as a result<br />
of Hurricane Katrina in New<br />
Orleans in 2005. Note damages<br />
can be more extensive due to<br />
high velocity flood flows versus if<br />
the levee wasn’t there.<br />
Like dams, many levees in the United States were constructed using<br />
unknown techniques and materials. These levees have a higher failure rate<br />
than those that have been designed to today’s standards.<br />
A levee might not provide the flood risk reduction it once did as a result of<br />
flood risk changes over time. <strong>Flood</strong> risk can change due to a number of<br />
factors, including: increased flood levels due to climate change or better<br />
estimates of flooding, development in the watershed increasing flood levels<br />
and settlement of the levee or floodwall, and sedimentation in the levee<br />
channel. Increased flood levels mean decreased flood protection. The lack of<br />
adequate maintenance over time will also reduce the capability of a levee to<br />
contain the flood levels it was originally designed for.<br />
Given enough time, any levee will eventually be overtopped or damaged by<br />
a flood that exceeds the levee’s capacity. Still there is a widespread public<br />
perception of levees is that they will always provide protection. This<br />
perception may lead to not taking mitigation actions such as purchasing<br />
flood insurance..<br />
A levee is a system that can fail due to its weakest point, therefore<br />
maintenance is critical. Many levees in the United States are poorly<br />
maintained or not maintained at all. Maintenance also includes maintaining<br />
the drainage systems behind the levees so they can keep the protected area<br />
dry.<br />
Coastal Structures<br />
Coastal structures are used to “harden” the shoreline for a variety of purposes<br />
and include:<br />
Severe beach erosion and<br />
damage resulting from a<br />
nor’easter.<br />
Jetties - Structures constructed to direct currents or accommodate vessels<br />
Groyne - Protective structures of stone or concrete that extend from shore<br />
into the water to prevent a beach from washing away<br />
Sea walls - A form of hard and strong coastal defense constructed on the<br />
inland part of a coast to reduce the effects of strong waves<br />
Other coastal structures<br />
As the rate of sea-level rise accelerates, an increase in coastal erosion is likely.<br />
We are now facing rapid sea-level changes on a scale of decades. Higher sea<br />
levels could affect the coastal zone and accelerate coastal erosion and flooding<br />
in a variety of ways, including greater shoreline retreat, increased coastal<br />
erosion rates, property destruction, and saltwater intrusion into bays, rivers, and<br />
DRAFT – WATERSHED USA FLOOD RISK REPORT 15
underground water resources. In addition, a general elevation in the water table<br />
due to sea-level rise will result.<br />
How can coastal structures contribute to flooding and flood losses<br />
While coastal structures or “hardening of the shoreline” may provide a<br />
temporary level of flood reduction for a very specific site, it also interrupts<br />
the dynamic processes of the littoral flow (flow along the coastline) which<br />
results in accelerated coastal erosion.<br />
Erosion often occurs along beaches during storms, especially severe storms<br />
that stay offshore for days and result in ongoing battering of the shoreline<br />
through high wind and waves. As the beach erodes, vulnerable properties<br />
are placed at even greater risk to coastal flooding, storm surge, wave<br />
heights, wave run up, and coastal erosion.<br />
Higher water tables associated with sea level rise could lead to the failure of<br />
septic systems and other drainage systems, such as storm drains, which<br />
need to be located at a certain elevation above the water table. Elevation of<br />
the water table would also affect the river drainage systems by affecting the<br />
rate of infiltration and increase the amount of runoff which would, in turn,<br />
increase the risk of flooding.<br />
Stream Flow Pinch Points<br />
A flow pinch point occurs when a human made structure such as a culvert or<br />
bridge constricts the flow of a river or stream. The results of this constriction can<br />
be increased damage potential to the structure, an increase in velocity of flow<br />
through the structure, and the creation of significant ponding or backwater<br />
upstream of the structure. Regulatory standards regarding the proper opening<br />
size for a structure spanning a river or stream are not consistent and may be<br />
non-existent. Some local regulations require structures to pass a volume of<br />
water that corresponds to a certain size rain event; however, under sizing these<br />
openings can result in flood damage to the structure itself. After a large flood<br />
event, it is not uncommon to have numerous bridges and culverts “washed out.”<br />
How can stream flow pinch points contribute to flooding and flood losses<br />
Flow pinch points can back water up on property upstream of the structure if<br />
not designed properly.<br />
These structures can accelerate the flow through the structure causing<br />
downstream erosion if not properly mitigated. This erosion can affect the<br />
structure itself, causing undermining and failure.<br />
If the pinch point is a bridge or culvert, it can get washed out causing an<br />
area to become isolated and potentially more difficult to evacuate.<br />
Washed-out culverts and associated debris can wash downstream and cause<br />
the next pinch point to fail.<br />
High <strong>Risk</strong> Essential Facilities<br />
DRAFT – WATERSHED USA FLOOD RISK REPORT 16
Essential facilities, or sometimes called “critical facilities”, are those whose<br />
impairment during a flood could cause significant problems to individuals or<br />
communities. For example, when a community’s wastewater treatment is<br />
flooded and shut down, not only do contaminants escape and flow into the<br />
floodwaters, but backflows of sewage can contaminate basements or other<br />
areas of the community. Similarly, when a facility such as a hospital is flooded, it<br />
can result in a significant hardship on the community not only during the event<br />
but long afterwards as well.<br />
How can high risk essential facilities contribute to flooding and flood losses<br />
Costly and specialized equipment may be damaged and need to be replaced.<br />
Impairments to facilities such as fire stations may result in lengthy delays in<br />
responding and a focus on evacuating the facility itself.<br />
Critical records and information stored at these facilities may be lost.<br />
Past <strong>Flood</strong> Insurance Claims, and Individual Assistance/Public Assistance<br />
Hotspots<br />
Assistance provided after flood events (flood insurance in any event, and<br />
Individual Assistance (IA) or Public Assistance (PA) after declared disasters)<br />
occurs in flood affected areas. Understanding geographically where this<br />
assistance is being provided may indicate unique flood problems.<br />
Clusters of past flood insurance<br />
claims can show where there is a<br />
repetitive flood problem.<br />
<strong>Flood</strong> insurance claims are not always equally distributed in a community.<br />
Although estimates indicate that 20 to 50 percent of structures in identified<br />
flood hazard areas have flood insurance, clusters of past claims may indicate<br />
where there is a flood problem. However, clusters of past claims and/or areas<br />
where there are high payments under FEMA’s Individual Assistance(IA) or Public<br />
Assistance (PA) Programs may indicate areas of significant flood hazard.<br />
Why are past claim hot spots areas of mitigation interest<br />
A past claim hotspot may reflect an area of recent construction (large<br />
numbers of flood insurance policies as a result of a large number of<br />
mortgages), and an area where the as-built construction is not in<br />
accordance with local floodplain management regulations. Sometimes<br />
clusters of past claims occur in subdivisions that were constructed before<br />
flood protection standards were in place, places with inadequate<br />
stormwater management systems, or in areas that may not have been<br />
identified as SFHAs.<br />
Clusters of IA or PA claims may indicate areas where high flood<br />
insurance coverage or other mitigation actions are needed.<br />
Significant Land Use Changes<br />
Recent or proposed development in SFHAs must be carefully evaluated to ensure<br />
that no adverse impacts occur as a result. Development, whether it is a 100-lot<br />
subdivision or a single lot big box commercial outlet, can result in large amounts<br />
DRAFT – WATERSHED USA FLOOD RISK REPORT 17
of fill and other material being deposited in flood storage areas. Development in<br />
flood hazard areas is only protected to a certain standard – floods that exceed<br />
those standards will damage the developed areas. Development also includes<br />
all necessary infrastructure and services to maintain that development over<br />
time.<br />
Rooftops, pavement, patios, and<br />
driveways contribute to the<br />
impervious area in a watershed.<br />
One of the factors that contributes to flooding in a watershed is the amount of<br />
ground that is available to absorb water. When development occurs, hard<br />
surfaces such as rooftops, pavement, patios, and driveways do not allow water<br />
to absorb into the ground and more of the rainwater becomes runoff flowing<br />
directly into streams and drainage ways. As a result, the “peak flow” in a stream<br />
or drainage way after a storm event will be higher and occur faster. Without<br />
careful planning, major land use changes can affect the impervious area of a site<br />
and result in a significant increase in flood risk.<br />
Sometimes a major land use change may be for planning purposes only. For<br />
example a land use change that rezones land from a classification such as<br />
floodplain that restricts development to a zone such as industrial or high density<br />
residential could result in significant new infrastructure and structures in high<br />
flood risk areas.<br />
How can past or planned major land use changes in SFHAs contribute to flooding<br />
and flood losses<br />
Development in areas mapped SFHAs reduces flood storage areas, which can<br />
make flooding worse at the development site and downstream of it.<br />
Impervious surfaces speed up the water flowing in the streams, which can<br />
increase erosion and the danger that fast-flowing floodwaters pose to<br />
people and buildings.<br />
Rezoning flood prone areas to high densities and/or higher intensity uses<br />
can result in more people and property at risk of flooding and flood damage.<br />
Key Emergency Routes Overtopped During Frequent <strong>Flood</strong>ing Events<br />
Roads are not always designed to flood protection levels. In fact, many major<br />
roadways including interstate highways, US highways, and state routes are<br />
chronically flooded. When an alternative route is available, inconvenience, and<br />
minor losses result. However, when no or lengthy alternate routes are available,<br />
when the road being overtopped conveys more traffic than alternate routes, or<br />
that is a large economic driver (i.e., industrial park), overtopping can result in<br />
significant economic losses as well as impact public safety.<br />
Why are overtopped roads areas of mitigation interest<br />
When large highway close due to<br />
flooding, traffic is detoured causing<br />
inconvenience and economic loss<br />
Such areas, when identified can be accounted for and incorporated into<br />
evacuation and other operational plans.<br />
Overtopped roads can sometimes be elevated or reinforced to reduce the<br />
overtopping.<br />
DRAFT – WATERSHED USA FLOOD RISK REPORT 18
Drainage or Stormwater Based <strong>Flood</strong> Hazard Areas, or Areas not Identified as<br />
<strong>Flood</strong>prone on the FIRM but known to be Inundated<br />
<strong>Flood</strong> hazard areas exist everywhere. While FEMA maps many of these, there<br />
are others not identified. Many of these areas may be located in communities<br />
with existing, older, and often inadequate stormwater management systems or<br />
in very rural areas. Other similar areas could be a result of complex or unique<br />
drainage characteristics. Even though they are not mapped, awareness of these<br />
areas is important so adequate planning and mitigation actions can be<br />
performed.<br />
Why are drainage or stormwater based flood hazard areas or unidentified<br />
floodprone locations areas of mitigation interest<br />
So further investigation of such areas can occur and based on scientific<br />
data, appropriate mitigation actions can result (i.e., land use and<br />
building standards).<br />
To create viable mitigation project applications in order to reduce flood<br />
losses.<br />
Areas of Mitigation Success<br />
<strong>Flood</strong> mitigation projects are powerful tools to communicate the concepts of<br />
mitigation and result in more resilient communities. <strong>Flood</strong> hazard mitigation<br />
actions have been occurring for decades and by multiple agencies. Both<br />
structural measures – those that result in flood control structures and nonstructural<br />
measures have been implemented in thousands of communities. An<br />
extensive list of mitigation actions can be found in Section 4.<br />
Why are areas of mitigation success areas of mitigation interest<br />
Mitigation successes identify those areas within the community that have<br />
experienced a reduction or elimination of flood risk<br />
Such areas are essential in demonstrating successful loss reduction<br />
measures and in educating citizens and officials on available flood hazard<br />
mitigation techniques.<br />
Avoided losses can be calculated and shown.<br />
Demonstrate successful techniques that can be implemented by individuals<br />
and communities.<br />
DRAFT – WATERSHED USA FLOOD RISK REPORT 19
3. <strong>Flood</strong> <strong>Risk</strong> Analysis Results<br />
The <strong>Flood</strong> <strong>Risk</strong> Map (FRM)<br />
provides a graphical overview of<br />
the study area which highlights<br />
areas of risk that should be noted,<br />
based on potential losses,<br />
exposed facilities etc. based on<br />
data found in the FRD. Refer to<br />
the data in the FRD to conduct<br />
additional analyses.<br />
The following pages provide the results of detailed analyses for the study area<br />
as a whole and for each community within the project area. Each summary<br />
includes the following:<br />
FRM: The <strong>Flood</strong> <strong>Risk</strong> Map illustrates the study area base data reflecting<br />
community boundaries, major roads, and stream lines; potential losses<br />
that include both the 2010 <strong>Flood</strong> AAL study supplemented with new<br />
HAZUS-MH runs for areas with new or updated flood modeling; new<br />
study areas; a bar chart summarizing community per capita loss; and<br />
provides graphics and text that promotes access and usage of additional<br />
data available thru the FRD, FIRM, National <strong>Flood</strong> Hazard Layer and<br />
viewers (desktop or FEMA website, etc.). This information can be used<br />
to assist in watershed level planning as well as for developing mitigation<br />
actions within each jurisdiction located within the watershed.<br />
Study Area summary:<br />
o<br />
o<br />
o<br />
Changes Since Last FIRM: A summary of where the floodplain<br />
and flood zones have increased or decreased (only analyzed for<br />
areas that were previously mapped using digital FIRMs). <strong>Flood</strong><br />
Depth and Analysis Grids: A general discussion of the data<br />
provided in the FRD.<br />
<strong>Flood</strong> <strong>Risk</strong> Analysis: A loss estimation of potential flood<br />
damages by using different flood scenarios.<br />
Areas o f Mitigation Interest: A description of areas that may<br />
require mitigation or additional risk analysis.<br />
Community summary (for each community, representing the portion of<br />
the community in the study area):<br />
o<br />
o<br />
o<br />
o<br />
Changes Since Last FIRM: A summary of where the floodplain<br />
and flood zones have increased or decreased (only analyzed for<br />
areas that were previously mapped using digital FIRMs).<br />
<strong>Flood</strong> Depth and Analysis Grids: A general discussion of the data<br />
provided in the FRD.<br />
<strong>Flood</strong> <strong>Risk</strong> Analysis: A loss estimation of potential flood<br />
damages by using different flood scenarios.<br />
Areas o f Mitigation Interest: A description of areas that may<br />
require mitigation or additional risk analysis.<br />
DRAFT – WATERSHED USA FLOOD RISK REPORT 20
3.1 <strong>Flood</strong> <strong>Risk</strong> Map<br />
DRAFT – WATERSHED USA FLOOD RISK REPORT 21
This page left intentionally blank.<br />
DRAFT – WATERSHED USA FLOOD RISK REPORT 22
3.1 Watershed USA Summary<br />
Overview<br />
Watershed USA, located in (insert state), includes the following communities:<br />
Community Name<br />
CID<br />
Total<br />
Community<br />
Population<br />
Percent of<br />
Population in<br />
Watershed<br />
Total<br />
Community<br />
Land Area (sq<br />
mi)<br />
Percent of<br />
Land Area<br />
in<br />
Watershed<br />
Village of Coastland 0123465 555 24 .7 30<br />
Village of Drytown 0123475 1,232 10 1.4 15<br />
City of <strong>Flood</strong>ville 0123456 22,784 30 8 25<br />
City of Metropolis 0124386 12,444 100 8.5 100<br />
Town of Waterloo 0123468 3,633 100 3.3 100<br />
County A 0123471 112,541 44 300 50<br />
County B 0123482 66,320 30 205 33<br />
County C 0123485 21,998 5 40 20<br />
Community-specific results are provided on subsequent pages. Data provided below and on subsequent pages only<br />
includes areas located within the Watershed USA study area and do not necessarily represent community-wide totals.<br />
The information below provides an overview of floodplain management program information for the study area of<br />
Watershed USA as of the date of this publication.<br />
All communities participate in the National <strong>Flood</strong> Insurance Program (NFIP)<br />
Village of Drytown, City of <strong>Flood</strong>ville, City of Metropolis participate in the NFIP Community Rating System (CRS)<br />
All jurisdictions participate in FEMA-approved hazard mitigation plans<br />
Past Federal Disaster Declarations for flooding =36<br />
NFIP Policy Coverage (policies/value)= 18,260 policies totaling approximately $89,890,000<br />
NFIP-recognized repetitive loss properties = 35 (25 residential and 10 commercial)<br />
NFIP-recognized Severe Repetitive Loss properties =18 (all residential)<br />
Section 2 of the Watershed USA <strong>Flood</strong> <strong>Risk</strong> <strong>Report</strong> (FRR) provides more information regarding the source and methodology<br />
used to develop the information presented below. Datasets used toward the generation of results of this project are<br />
described in Appendix C and are found in the <strong>Flood</strong> <strong>Risk</strong> Database (FRD).<br />
Changes Since Last FIRM<br />
Special <strong>Flood</strong> Hazard Area (SFHA) boundaries within Watershed USA were updated due to new engineering analysis<br />
performed within the study area. The updated modeling produced new flood zone areas and new base flood elevations in<br />
some areas, and leveraged recently developed LiDAR-based topographic data for the study area. The table below<br />
summarizes the increases, decreases, and net change of SFHAs for the watershed.<br />
Area of Interest Total Area (mi 2 ) Increase (mi 2 ) Decrease (mi 2 ) Net Change (mi 2 )<br />
Area within SFHA 21.1 1.0 -2.5 -1.5<br />
Area within <strong>Flood</strong>way 3.2 0.7 -0.1 3.0<br />
Section 2 of the FRR provides more information regarding the source and methodology used to develop this table.<br />
Evidence of actual flood losses can be one of the most compelling factors for increasing a community’s flood risk<br />
awareness. During this <strong>Risk</strong> MAP project, FEMA confirmed several areas within this watershed as having mitigation<br />
potential and encourages the communities within the watershed to continue working with the State Hazard Mitigation<br />
DRAFT – WATERSHED USA FLOOD RISK REPORT 23
Officer to further identify and mitigate these high risk areas and structures. Specific areas within each jurisdiction are<br />
detailed within the individual community summaries.<br />
<strong>Flood</strong> Depth and Analysis Grids<br />
The FRD contains datasets in the form of depth grids for the entire study area that can be used for additional analysis,<br />
enhanced visualization, and communication of flood risks for hazard mitigation planning and emergency management. The<br />
data provided within the FRD should be used to further isolate areas where flood mitigation potential is high, and may be<br />
helpful in planning and implementing mitigation strategies. Properties located in areas expected to experience some depth<br />
of water should seriously consider mitigation options for implementation. Section 2 of the FRR provides general<br />
information regarding the development of and potential uses for this data.<br />
HAZUS-MH Estimated Loss Information<br />
Watershed USA’s flood risk analysis incorporates results from a FEMA performed HAZUS-MH analysis which accounts for<br />
newly modeled areas in the study area and newly modeled depths for certain flood events. Potential losses were estimated<br />
as well as potential loss ratios for multiple scenarios. Additional information and data layers provided within the FRD<br />
should be used to further analyze potential losses and areas where they are likely to occur.<br />
Estimated Potential Losses for <strong>Flood</strong> Event Scenarios<br />
Total Inventory 10% (10-yr) 2% (50-yr) 1% (100-yr) 0.2% (500-yr) Annualized ($/yr)<br />
Estimated<br />
Value<br />
Percent<br />
of Total<br />
Dollar<br />
Losses<br />
Loss<br />
Ratio<br />
Dollar<br />
Losses<br />
Residential<br />
Building/Contents $94,495,000 77% $10,439,000 11% $13,571,000 14% $19,273,000 20% $32,925,000 35% $176,000 0%<br />
Commercial<br />
Building/Contents $15,127,000 12% $2,112,000 14% $3,225,000 21% $4,337,000 29% $4,925,000 33% $109,000 1%<br />
Other<br />
Building/Contents $13,073,000 11% $1,660,000 13% $2,195,000 17% $3,620,000 28% $5,430,000 42% $79,000 1%<br />
Total<br />
Building/Contents $122,695,000 100% $14,211,000 12% $18,991,000 15% $27,230,000 22% $43,280,000 35% $364,000 0%<br />
Business Disruption<br />
Loss<br />
Ratio<br />
Dollar<br />
Losses<br />
Loss<br />
Ratio<br />
Dollar<br />
Losses<br />
Loss<br />
Ratio<br />
Dollar<br />
Losses<br />
N/A N/A $760,000 N/A $1,259,000 N/A $2,011,000 N/A $4,074,000 N/A $18,000 N/A<br />
TOTAL $122,695,000 N/A $14,971,000 N/A $20,250,000 N/A $29,241,000 N/A $47,354,000 N/A $382,000 N/A<br />
Source: HAZUS-MH analysis using local tax data and <strong>Risk</strong> MAP depth grids<br />
1<br />
Total Building/Content Losses = Residential Building/Content Loss + Commercial Building/Content Loss + Other Building/Content Loss.<br />
2<br />
Loss ratio = Dollar Losses / Estimated Value. Loss ratios are computed using actual loss and value numbers from HAZUS, not rounded numbers.<br />
3<br />
Losses are rounded to the nearest thousand and loss ratios are rounded to the nearest whole number.<br />
Loss<br />
Ratio<br />
DRAFT – WATERSHED USA FLOOD RISK REPORT 24
3.2 Village of Coastland Summary (CID 0123465)<br />
Refer to the City of <strong>Flood</strong>ville Summary (Section 3.4) for a model representation<br />
of the proposed summary format.<br />
DRAFT – WATERSHED USA FLOOD RISK REPORT 25
Refer to the City of <strong>Flood</strong>ville Summary (Section 3.4) for a model representation<br />
of the proposed summary format.<br />
DRAFT – WATERSHED USA FLOOD RISK REPORT 26
3.3 Village of Drytown Summary (CID 0123475)<br />
Refer to the City of <strong>Flood</strong>ville Summary (Section 3.4) for a model representation<br />
of the proposed summary format.<br />
DRAFT – WATERSHED USA FLOOD RISK REPORT 27
Refer to the City of <strong>Flood</strong>ville Summary (Section 3.4) for a model representation<br />
of the proposed summary format.<br />
DRAFT – WATERSHED USA FLOOD RISK REPORT 28
3.4 City of <strong>Flood</strong>ville Summary (CID 0123456)<br />
Overview<br />
The City of <strong>Flood</strong>ville is the largest of five cities located within County A. The information below provides an overview of the<br />
community’s floodplain management program information as of the date of this publication.<br />
Participating in National <strong>Flood</strong> Insurance Program (NFIP)<br />
Participating in NFIP Community Rating System (CRS)<br />
Participating in the County A Multi-Hazard Mitigation Plan which expires 10/01/2012<br />
Past Federal Disaster Declarations for flooding = 5<br />
NFIP Policy Coverage (policies/value) = 2,270 policies totaling approximately $9,980,000<br />
NFIP-recognized repetitive loss properties = 17 (11 residential and 6 commercial)<br />
NFIP-recognized Severe Repetitive Loss properties = 4 (residential)<br />
Data provided below only includes areas within the City of <strong>Flood</strong>ville that area located within the Watershed USA study<br />
area and do not necessarily represent community-wide totals. Section 2 of the Watershed USA <strong>Flood</strong> <strong>Risk</strong> <strong>Report</strong> (FRR)<br />
provides more information regarding the source and methodology used to develop the information presented below.<br />
Datasets used toward the generation of results of this project are described in Appendix C and are found in the <strong>Flood</strong> <strong>Risk</strong><br />
Database (FRD).<br />
Changes Since Last FIRM<br />
Special <strong>Flood</strong> Hazard Area (SFHA) boundaries within the City of <strong>Flood</strong>ville were updated due to new engineering analysis<br />
performed on Spartan Creek. The updated modeling produced new flood zone areas and new base flood elevations, and<br />
leveraged the City’s recently developed LiDAR-based topographic data. The table below summarizes the increases,<br />
decreases, and net change of SFHAs for the community. Also, population and building data was provided by the City Of<br />
<strong>Flood</strong>ville which was used to analyze changes in numbers of persons and buildings in areas of change. Areas with the<br />
greatest increase in flood zone area are located south of the city. Areas with the most decrease in flood zone area are<br />
located near the city’s northern boundary.<br />
Areas of Change<br />
Total<br />
Area<br />
(mi 2 )<br />
Increase<br />
(mi 2 )<br />
Decrease<br />
(mi 2 )<br />
Net<br />
Change<br />
(mi 2 )<br />
Net<br />
Population<br />
Incr<br />
Population<br />
Incr<br />
Bldgs<br />
DRAFT – WATERSHED USA FLOOD RISK REPORT 29<br />
Decr<br />
Population<br />
Area within SFHA 2.5 0.1 -0.3 -0.1 -15 215 72 -230 -78<br />
Area within <strong>Flood</strong>way 0.3 0.1 -0.0 0.3 10 12 5 -2 -2<br />
Previous FIRM effective Date: September 10, 2004<br />
Current FIRM effective Date: October 29, 2010<br />
<strong>Flood</strong> Depth and Analysis Grids<br />
See the FRD for the following depth and analysis grid data (Section 2 of the FRR provides general information regarding the<br />
development of and potential uses for this data):<br />
Multi-frequency <strong>Flood</strong> Depth grids (10%, 4%, 2%, 1%, and 0.2% annual chance)<br />
Percent annual chance of flooding grid<br />
Percent chance of flooding over a 30-year period grid<br />
Water Surface Elevation grids (10%, 4%, 2%, 1%, and 0.2% annual chance)<br />
Water Surface Elevation Change Grid<br />
1% Plus <strong>Flood</strong> Depth Grids<br />
Velocity grids<br />
Top and toe of levee depth grids<br />
Decr<br />
Bldgs
Water surface or depth grids based upon additional flood frequency profiles<br />
Additional information and data layers provided within the FRD should be used to further isolate these and other areas<br />
where flood mitigation potential is high, and includes data which may be helpful in planning and implementing mitigation<br />
strategies. Properties located in areas expected to experience some depth of water should seriously consider mitigation<br />
options for implementation.<br />
HAZUS-MH Estimated Loss Information<br />
The City of <strong>Flood</strong>ville’s flood risk analysis uses results from a FEMA performed HAZUS-MH analysis which accounts for newly<br />
modeled areas in the study area, and newly modeled depths for certain flood events. Potential losses were compared with<br />
locally provided tax data to estimate loss ratios for multiple scenarios. Additional information and data layers provided<br />
within the FRD should be used to further analyze potential losses and areas where they are likely to occur.<br />
Estimated Potential Losses for <strong>Flood</strong> Event Scenarios<br />
Total Inventory 10% (10-yr) 2% (50-yr) 1% (100-yr) 0.2% (500-yr) Annualized ($/yr)<br />
Estimated<br />
Value<br />
Percent<br />
of Total<br />
Dollar<br />
Losses<br />
Loss<br />
Ratio<br />
Dollar<br />
Losses<br />
Dollar Losses<br />
Residential<br />
Building/Contents $17,200,000 78% $1,300,000 7% $1,600,000 10% $2,300,000 14% $4,000,000 23% $30,000 0%<br />
Commercial<br />
Building/Contents $1,100,000 5% $40,000 3% $60,000 5% $100,000 11% $300,000 22% $20,000 1%<br />
Other Building/Contents<br />
Total Building/Contents<br />
Business Disruption<br />
Loss<br />
Ratio<br />
Dollar<br />
Losses<br />
Loss<br />
Ratio<br />
Loss<br />
Ratio<br />
Dollar<br />
Losses<br />
$3,700,000 17% $20,000 1% $70,000 2% $100,000 3% $200,000 6% $0 0%<br />
$22,000,000 100% $1,360,000 6% $1,730,000 8% $2,500,000 12% $4,500,000 20% $50,000 0%<br />
N/A N/A $90,000 N/A $200,000 N/A $200,000 N/A $500,000 N/A $0 N/A<br />
TOTAL $22,000,000 N/A $1,450,000 N/A $1,930,000 N/A $2,700,000 N/A $5,000,000 N/A $50,000 N/A<br />
Source: HAZUS-MH analysis using local tax data and <strong>Risk</strong> MAP depth grids<br />
1 Total Building/Content Losses = Residential Building/Content Loss + Commercial Building/Content Loss + Other Building/Content Loss.<br />
2<br />
Loss ratio = Dollar Losses / Estimated Value. Loss ratios are computed using actual loss and value numbers from HAZUS, not rounded numbers.<br />
3<br />
Losses are rounded to the nearest thousand and loss ratios are rounded to the nearest whole number.<br />
Loss<br />
Ratio<br />
Areas of Mitigation Interest<br />
Section 2.2.3 of the FRR provides more information regarding area of mitigation interest, how they are defined for this<br />
analysis, and potential mitigation actions that could be considered for each type. The table below summarizes the number<br />
of areas of mitigation interest by type.<br />
Type of Mitigation Interest Number of Areas Data Source<br />
Dam 1 State CTP<br />
Levee 2 State CTP<br />
Stream Flow Pinch Points 2 Local Pub Works, engineering models<br />
Significant Land Use Changes 1 Local Planning Div<br />
Past Claims Hot Spot 1 State NFIP<br />
Area of Mitigation Success 2 State SHMO<br />
Many areas of mitigation interest were identified for the City of <strong>Flood</strong>ville. A significant factor for the Big Vista district is<br />
pinched flow on Spartan Creek at the Parson Street bridge. It should also be noted that the Shady Tree subdivision was<br />
previously mapped outside of the SFHA as a provisionally accredited levee zone. The levee has since been de-accredited due<br />
to freeboard limitations subjecting the neighborhood to increased flood risk and resulting in expanded flood zone mapping.<br />
Other areas of mitigation interest include the Pike dam, which is a high hazard dam located downstream of the Indian River.<br />
Approximately 450 structures are located immediately below this dam that could face additional risk should the dam fail.<br />
Refer to the County A Multi-Hazard Mitigation Plan for additional information regarding this structure, its area of potential<br />
DRAFT – WATERSHED USA FLOOD RISK REPORT 30
impact and its past performance during major storm events. At an intersection between New York canal and Indian Creek,<br />
the assumption was the gates on the canal were going to control flow to the canal capacity. The gates on the canal no<br />
longer work, allowing more water which exceeds the canal’s capacity to handle excess flow. Therefore, an assumption was<br />
made for the study that the canal would fail and the entire flow would have to enter Indian Creek, increasing the flow by<br />
1,500 cubic feet per second (cfs) and expanding the floodplain.<br />
Evidence of actual flood losses can be one of the most compelling factors for increasing a community’s flood risk awareness.<br />
One indicator is claims through the NFIP. While most of the city’s flood claims (240 out of 268) have originated from the Big<br />
Vista district, the Highway 42 corridor is home to several others including three repetitive loss properties and one severe<br />
repetitive loss property. Most of the claims are located near the confluence of the Indian River and Spartan Creek, producing<br />
over $18 million in claims within the last 10 years.<br />
According to the City of <strong>Flood</strong>ville Annex of the County A Multi-Hazard Mitigation Plan, the City has identified 14 mitigation<br />
projects for this area and to date only two have been implemented. During this <strong>Risk</strong> MAP project, FEMA confirmed this area<br />
as having mitigation potential and encouraged the community to continue working with the State Hazard Mitigation Officer<br />
to further identify and mitigate these high risk areas and structures.<br />
DRAFT – WATERSHED USA FLOOD RISK REPORT 31
3.5 City of Metropolis Summary (CID 0124386)<br />
Refer to the City of <strong>Flood</strong>ville Summary (Section 3.4) for a model representation<br />
of the proposed summary format.<br />
DRAFT – WATERSHED USA FLOOD RISK REPORT 32
Refer to the City of <strong>Flood</strong>ville Summary (Section 3.4) for a model representation<br />
of the proposed summary format.<br />
DRAFT – WATERSHED USA FLOOD RISK REPORT 33
3.6 Town of Waterloo Summary (CID 0123468)<br />
Refer to the City of <strong>Flood</strong>ville Summary (Section 3.4) for a model representation<br />
of the proposed summary format.<br />
DRAFT – WATERSHED USA FLOOD RISK REPORT 34
Refer to the City of <strong>Flood</strong>ville Summary (Section 3.4) for a model representation<br />
of the proposed summary format.<br />
DRAFT – WATERSHED USA FLOOD RISK REPORT 35
3.7 County A Summary (CID 0123471)<br />
Refer to the City of <strong>Flood</strong>ville Summary (Section 3.4) for a model representation<br />
of the proposed summary format.<br />
DRAFT – WATERSHED USA FLOOD RISK REPORT 36
Refer to the City of <strong>Flood</strong>ville Summary (Section 3.4) for a model representation<br />
of the proposed summary format.<br />
DRAFT – WATERSHED USA FLOOD RISK REPORT 37
3.8 County B Summary (CID 0123482)<br />
Refer to the City of <strong>Flood</strong>ville Summary (Section 3.4) for a model representation<br />
of the proposed summary format.<br />
DRAFT – WATERSHED USA FLOOD RISK REPORT 38
Refer to the City of <strong>Flood</strong>ville Summary (Section 3.4) for a model representation<br />
of the proposed summary format.<br />
DRAFT – WATERSHED USA FLOOD RISK REPORT 39
3.9 County C Summary (CID 0123485)<br />
Refer to the City of <strong>Flood</strong>ville Summary (Section 3.4) for a model representation<br />
of the proposed summary format.<br />
DRAFT – WATERSHED USA FLOOD RISK REPORT 40
Refer to the City of <strong>Flood</strong>ville Summary (Section 3.4) for a model representation<br />
of the proposed summary format.<br />
DRAFT – WATERSHED USA FLOOD RISK REPORT 41
Before Mitigation and After Mitigation<br />
Communities will need to prioritize<br />
projects as part of the planning<br />
process. FEMA can then help route<br />
federal mitigation dollars to fund these<br />
projects.<br />
The National <strong>Flood</strong> Insurance<br />
Program's (NFIP) Community<br />
Rating System (CRS) is a<br />
voluntary incentive program that<br />
recognizes and encourages<br />
community floodplain management<br />
activities that exceed the minimum<br />
NFIP requirements. As a result,<br />
flood insurance premium rates are<br />
discounted to reflect the reduced<br />
flood risk resulting from the<br />
community actions meeting the<br />
three goals of the CRS: To reduce<br />
flood losses, to facilitate accurate<br />
insurance rating; and to promote<br />
the awareness of flood insurance.<br />
For CRS participating<br />
communities, flood insurance<br />
premium rates are discounted in<br />
increments of 5%; i.e., a Class 1<br />
community would receive a 45%<br />
premium discount, while a Class 9<br />
community would receive a 5%<br />
discount (a Class 10 is not<br />
participating in the CRS and<br />
receives no discount).<br />
4. Actions to Reduce <strong>Flood</strong> <strong>Risk</strong><br />
4.1 Types of Mitigation Actions<br />
Mitigation provides a critical foundation on which to reduce loss of life and<br />
property by avoiding or lessening the impact of hazard events. This creates<br />
safer communities, and facilitates resiliency by enabling communities to return<br />
to normal function as quickly as possible after a hazard event. Once a<br />
community understands its flood risk, it is in a better position to identify<br />
potential mitigation actions that can reduce the risk to its people and property.<br />
The mitigation plan requirements in 44 CFR Part 201 encourage communities to<br />
understand their vulnerability to hazards and take actions to minimize<br />
vulnerability and promote resilience. <strong>Flood</strong> mitigation actions generally fall into<br />
the following categories:<br />
Preventative Measures<br />
Preventative measures are intended to keep flood hazards from getting worse.<br />
They can reduce future vulnerability to flooding, especially in areas where<br />
development has not yet occurred or where capital improvements have not<br />
been substantial. <strong>Example</strong>s include:<br />
Comprehensive land use planning<br />
Zoning regulations<br />
Subdivision regulations<br />
Open space preservation<br />
Building codes<br />
<strong>Flood</strong>plain development regulations<br />
Stormwater management<br />
Purchase development rights or conservation easements<br />
Participation in the NFIP Community Rating System (CRS)<br />
Property Protection Measures<br />
Property protection measures protect existing buildings by modifying the<br />
building to withstand floods, or by removing buildings from hazardous locations.<br />
<strong>Example</strong>s include:<br />
Building relocation<br />
Acquisition and clearance<br />
Building elevation<br />
Barrier installation<br />
Building retrofit<br />
Natural Resource Protection Activities<br />
Natural resource protection activities reduce the impact of floods by preserving<br />
or restoring natural areas such as floodplains, wetlands, and dunes and their<br />
natural functions. <strong>Example</strong>s include:<br />
Wetland protection<br />
Habitat protection<br />
Erosion and sedimentation control<br />
DRAFT – WATERSHED USA FLOOD RISK REPORT 42
Best management practices (BMPs)<br />
Prevention of stream dumping activities (anti-litter campaigns)<br />
Improved forestry practices such as reforesting or selective timbering<br />
(extraction)<br />
For more information regarding<br />
hazard mitigation techniques, best<br />
practices, and potential grant<br />
funding sources, visit<br />
www.fema.gov or contact your<br />
local floodplain manager,<br />
emergency manager, or State<br />
Hazard Mitigation Officer.<br />
Emergency Services (ES) Measures<br />
Although not typically considered a mitigation technique, emergency service<br />
measures minimize the impact of flooding on people and property. These are<br />
actions commonly taken immediately prior to, during, or in response to a hazard<br />
event. <strong>Example</strong>s include:<br />
Hazard warning system<br />
Emergency response plan<br />
COOP and COG planning<br />
Critical facilities protection<br />
Health and safety maintenance<br />
Post flood recovery planning<br />
Structural Mitigation Projects<br />
Structural mitigation projects lessen the impact of floods by modifying the<br />
environmental natural progression of the flooding event. Structural protection<br />
such as upgrading dams/levees for already existing development and critical<br />
facilities may be a realistic alternative. However, citizens should be made aware<br />
of their residual risk. <strong>Example</strong>s include:<br />
Reservoirs, retention, and detention basins<br />
Levees and floodwalls<br />
Channel modifications<br />
Channel maintenance<br />
Public Education and Awareness Activities<br />
Public education and awareness activities advise residents, business owners,<br />
potential property buyers, and visitors about floods, hazardous areas, and<br />
mitigation techniques they can use to reduce the flood risk to themselves and<br />
their property. <strong>Example</strong>s include:<br />
Readily available and readable updated maps<br />
Outreach projects<br />
Library<br />
Technical assistance<br />
Real estate disclosure<br />
Environmental education<br />
Providing risk information via the nightly news<br />
In Section 3, specific Areas of Mitigation Interest were identified. Table 4.1<br />
below identifies possible mitigation actions for each AoMI to consider.<br />
DRAFT – WATERSHED USA FLOOD RISK REPORT 43
AoMI<br />
Dams<br />
Levees (accredited and<br />
non-accredited) and<br />
significant levee-like<br />
structures<br />
Coastal Structures<br />
Jetties<br />
Groins<br />
Seawalls<br />
Other structures<br />
Table 4.1 Mitigation Actions for Areas of Mitigation Interest<br />
Possible Actions to Reduce <strong>Flood</strong> <strong>Risk</strong><br />
Engineering assessment<br />
Dam upgrades and strengthening<br />
Emergency Action Plan (EAPs)<br />
Dam removal<br />
Easement creation in impoundment and downstream inundation areas<br />
Generally same as dams above<br />
Purchase of flood insurance for at-risk structures<br />
Increase coastal setbacks for construction<br />
Habitat restoration programs<br />
Wetland restoration and mitigation banking programs<br />
Stream Flow Pinch Point<br />
Undersized culverts or<br />
bridge openings<br />
Engineering Analysis<br />
Replacement of structure pre- and post-disaster<br />
Past Claims and IA/PA<br />
Hot Spots<br />
Acquisition<br />
Elevation<br />
Relocation<br />
<strong>Flood</strong>proofing<br />
Major Land Use Changes<br />
(past 5 years or next 5<br />
years)<br />
Higher regulatory standards, Stormwater BMPs, Transfer of Development<br />
rights, compensatory storage and equal conveyance standards, etc.<br />
Key emergency routes<br />
overtopped during<br />
frequent flooding events<br />
Areas of Significant<br />
Riverine or Coastal<br />
Erosion<br />
Elevation<br />
Creation of alternate routes<br />
Design as low water crossing<br />
Relocation of buildings and infrastructure, regulations and planning,<br />
natural vegetation, hardening<br />
Drainage or Stormwater<br />
Based <strong>Flood</strong> Hazard<br />
Areas, or Areas not<br />
Identified as <strong>Flood</strong>prone<br />
on the FIRM but known<br />
to be Inundated<br />
Areas of Mitigation<br />
Success<br />
Identification of all flood hazard areas<br />
N/A<br />
4.2 Identifying Specific Actions for your Community<br />
As many mitigation actions are possible to lessen the impact of floods, how can<br />
a community decide which ones are appropriate to implement There are many<br />
DRAFT – WATERSHED USA FLOOD RISK REPORT 44
ways to identify specific actions most appropriate for a community. Some<br />
factors to consider may include the following:<br />
Site characteristics – Does the site present unique challenges (e.g.,<br />
significant slopes, erosion potential)<br />
Refer to FEMA Mitigation Planning<br />
How To Guide #3 (FEMA 386-3)<br />
“Developing the Mitigation Plan -<br />
identifying mitigation actions and<br />
implementation strategies” for more<br />
information on how to identify<br />
specific mitigation actions to<br />
address hazard risk in your<br />
community.<br />
<strong>Flood</strong> characteristics – Are the flood waters affecting the site fast or<br />
slow moving Is there debris associated with the flow How deep is the<br />
flooding<br />
Social acceptance – Will the mitigation action be acceptable to the<br />
public Does it cause social or cultural problems<br />
Technical feasibility – Is the mitigation action technically feasible (e.g.,<br />
making a building watertight to a reasonable depth)<br />
Administrative feasibility –Is there administrative capability to<br />
implement the mitigation action<br />
Legal – Does the mitigation action meet all applicable codes,<br />
regulations, and laws Public officials may have a legal responsibility to<br />
act and inform citizens if a known hazard has been identified.<br />
Economic –– Is the mitigation action affordable Is it eligible under<br />
grant or other funding programs Can it be completed within existing<br />
budgets<br />
Environmental – Does the mitigation action cause adverse impacts on<br />
the environment or can they be mitigated Is it the most appropriate<br />
action among the possible alternatives<br />
FEMA in collaboration with the<br />
American Planning Association<br />
has released the publication,<br />
“Integrating Hazard Mitigation into<br />
Local Planning.” This guide<br />
explains how hazard mitigation can<br />
be incorporated into several<br />
different types of local planning<br />
programs. For more information go<br />
to www.planning.org. or<br />
http://www.fema.gov/library.<br />
Your local Hazard Mitigation Plan is a valuable place to identify and prioritize<br />
possible mitigation actions. The plan includes a mitigation strategy with<br />
mitigation actions that were developed through a public and open process. You<br />
can then add to or modify those actions based on what is learned during the<br />
course of the <strong>Risk</strong> MAP project and the information provided within this FRR.<br />
DRAFT – WATERSHED USA FLOOD RISK REPORT 45
4.3 Mitigation Programs and Assistance<br />
Not all mitigation activities require funding (e.g., local policy actions such as<br />
strengthening a flood damage prevention ordinance), and those that do are not<br />
limited to outside funding sources (e.g. include in local capital improvements<br />
plan, etc.). For those mitigation actions that require assistance through funding<br />
or technical expertise, several State and Federal agencies have flood hazard<br />
mitigation grant programs and offer technical assistance. These programs may<br />
be funded at different levels over time or may be activated under special<br />
circumstances such as after a presidential disaster declaration.<br />
FEMA Mitigation Programs and Assistance<br />
FEMA awards many mitigation grants each year to States and communities to<br />
undertake mitigation projects to prevent future loss of life and property<br />
resulting from hazard impacts, including flooding. The FEMA Hazard Mitigation<br />
Assistance (HMA) programs provide grants for mitigation through the programs<br />
listed in Table 4.1 below.<br />
Mitigation Grant<br />
Program<br />
Table 4.2 FEMA Hazard Mitigation Assistance Programs<br />
Authorization<br />
Purpose<br />
Hazard Mitigation<br />
Grant Program<br />
(HMGP)<br />
Robert T. Stafford<br />
Disaster Relief and<br />
Emergency<br />
Assistance Act<br />
Activated after a presidential disaster declaration;<br />
provides funds on a sliding scale formula based on<br />
a percentage of the total federal assistance for a<br />
disaster for long-term mitigation measures to<br />
reduce vulnerability to natural hazards<br />
<strong>Flood</strong> Mitigation<br />
Assistance (FMA)<br />
National <strong>Flood</strong><br />
Insurance Reform Act<br />
Reduce or eliminate claims against the NFIP<br />
Communities can link hazard mitigation<br />
plans and actions to the right FEMA<br />
grant programs to fund flood risk<br />
reduction. More information about<br />
FEMA HMA programs can be found at<br />
http://www.fema.gov/government/grant/<br />
hma/index.shtm.<br />
Pre-Disaster<br />
Mitigation (PDM)<br />
Repetitive <strong>Flood</strong><br />
Claims (RFC)<br />
Severe Repetitive<br />
Loss (SRL)<br />
Disaster Mitigation<br />
Act<br />
Bunning-Bereuter-<br />
Blumenauer <strong>Flood</strong><br />
Insurance Reform Act<br />
Bunning-Bereuter-<br />
Blumenauer <strong>Flood</strong><br />
Insurance Reform Act<br />
National competitive program focuses on<br />
mitigation project and planning activities that<br />
address multiple natural hazards<br />
Reduce flood claims against the NFIP through flood<br />
mitigation; properties must be currently NFIP<br />
insured and have had at least one NFIP claim<br />
Reduce or eliminate the long-term risk of flood<br />
damage to SRL residential structures currently<br />
insured under the NFIP<br />
The HMGP and PDM programs offer funding for mitigation planning and project<br />
activities that address multiple natural hazard events. The FMA, RFC, and SRL<br />
programs focus funding efforts on reducing claims against the NFIP. Funding<br />
under the HMA programs is subject to availability of annual appropriations and<br />
under HMGP to the amount of FEMA disaster recovery assistance under a<br />
presidential major disaster declaration.<br />
DRAFT – WATERSHED USA FLOOD RISK REPORT 46
FEMA's HMA grants are awarded to eligible States, Tribes, and Territories<br />
(Applicant) that, in turn, provide subgrants to local governments and<br />
communities (subapplicant). The Applicant selects and prioritizes<br />
subapplications developed and submitted to them by subapplicants and submits<br />
them to FEMA for consideration of funding. Prospective subapplicants should<br />
consult the office designated as their Applicant for further information<br />
regarding specific program and application requirements. Contact information<br />
for the FEMA Regional Offices and State Hazard Mitigation Officers is available<br />
on the FEMA website.<br />
The Silver Jackets program, active in<br />
several states, is a partnership of the<br />
USACE, FEMA and state agencies. The<br />
Silver Jackets program provides a statebased<br />
strategy for an interagency<br />
approach to planning and implementing<br />
measures for risk reduction.<br />
Additional Mitigation Programs and Assistance<br />
Several additional agencies including the US Army Corps of Engineers (USACE),<br />
Natural Resource Conservation Service (NRCS), US Geological Survey (USGS),<br />
and others have specialists and a lot of information on flood hazard mitigation.<br />
The State NFIP Coordinator and State Hazard Mitigation Officer are state level<br />
sources of information and assistance, which vary among different states.<br />
DRAFT – WATERSHED USA FLOOD RISK REPORT 47
A. Appendix A: Acronyms and Definitions<br />
ACRONYMS<br />
A<br />
AAL<br />
ALR<br />
B<br />
BCA<br />
BFE<br />
C<br />
CFR<br />
COG<br />
COOP<br />
CRS<br />
Average Annualized Loss<br />
Annualized Loss Ratio<br />
Benefit-Cost Analysis<br />
Base <strong>Flood</strong> Elevation<br />
Code of Federal Regulations<br />
Continuity of Government Plan<br />
Continuity of Operations Plan<br />
Community Rating System<br />
D<br />
DHS<br />
Department of Homeland Security<br />
DMA 2000 Disaster Mitigation Act of 2000<br />
E<br />
EOP<br />
F<br />
FEMA<br />
FIRM<br />
FIS<br />
FMA<br />
FRD<br />
FRM<br />
FRR<br />
FY<br />
G<br />
GIS<br />
H<br />
HMA<br />
HMGP<br />
N<br />
NFIA<br />
NFIP<br />
NRCS<br />
Emergency Operations Plan<br />
Federal Emergency Management Agency<br />
<strong>Flood</strong> Insurance Rate Map<br />
<strong>Flood</strong> Insurance Study<br />
<strong>Flood</strong> Mitigation Assistance<br />
<strong>Flood</strong> <strong>Risk</strong> Database<br />
<strong>Flood</strong> <strong>Risk</strong> Map<br />
<strong>Flood</strong> <strong>Risk</strong> <strong>Report</strong><br />
Fiscal Year<br />
Geographic Information System<br />
Hazard Mitigation Assistance<br />
Hazard Mitigation Grant Program<br />
National <strong>Flood</strong> Insurance Act<br />
National <strong>Flood</strong> Insurance Program<br />
Natural Resource Conservation Service<br />
DRAFT – WATERSHED USA FLOOD RISK REPORT 48
P<br />
PDM<br />
R<br />
RFC<br />
<strong>Risk</strong> MAP<br />
S<br />
SFHA<br />
SHMO<br />
SRL<br />
U<br />
USACE<br />
USGS<br />
Pre-Disaster Mitigation<br />
Repetitive <strong>Flood</strong> Claims<br />
Mapping, Assessment, and Planning<br />
Special <strong>Flood</strong> Hazard Area<br />
State Hazard Mitigation Officer<br />
Severe Repetitive Loss<br />
U.S. Army Corps of Engineers<br />
U.S. Geological Survey<br />
DRAFT – WATERSHED USA FLOOD RISK REPORT 49
DEFINITIONS<br />
1-percent-annual-chance flood – The flood elevation that has a 1-percent chance of being<br />
equaled or exceeded each year. Sometimes referred to as the 100-year flood.<br />
0.2-percent-annual-chance flood – The flood elevation that has a 0.2-percent chance of being<br />
equaled or exceeded each year. Sometimes referred to as the 500-year flood.<br />
Average Annualized Loss (AAL) – The estimated long-term weighted average value of losses to<br />
property in any single year in a specified geographic area<br />
Annualized Loss Ratio (ALR) – expresses the annualized loss as a fraction of the value of the<br />
local inventory (total value/annualized loss).<br />
Base <strong>Flood</strong> Elevation (BFE) – Elevation of the 1-percent-annual-chance flood. This elevation is<br />
the basis of the insurance and floodplain management requirements of the NFIP.<br />
Berm – A small levee, typically built from fill dirt.<br />
Cfs – Cubic feet per second, the unit by which discharges are measured (a cubic foot of water is<br />
about 7.5 gallons).<br />
Consequence (of flood) – The estimated damages associated with a given flood occurrence.<br />
Crest – The peak stage or elevation reached or expected to be reached by the floodwaters of a<br />
specific flood at a given location.<br />
Dam – Any artificial barrier that impounds or diverts water and that: (1) is 25 feet or more in<br />
height from the natural bed of the stream or watercourse measured at the downstream toe of<br />
the barrier or from the lowest elevation of the outside limit of the barrier if it is not across a<br />
stream channel or watercourse, to the maximum water storage elevation or (2) has an<br />
impounding capacity at maximum water storage elevation of 50 acre-feet or more.<br />
Design flood event – The greater of the following two flood events: (1) the base flood, affecting<br />
those areas identified as SFHAs on a community’s FIRM; or (2) the flood corresponding to the<br />
area designated as a flood hazard area on a community’s flood hazard map or otherwise legally<br />
designated.<br />
Erosion – Process by which floodwaters lower the ground surface in an area by removing upper<br />
layers of soil.<br />
Essential facilities – Facilities that, if damaged, would present an immediate threat to life,<br />
public health, and safety. As categorized in HAZUS-MH, essential facilities include hospitals,<br />
emergency operations centers, police stations, fire stations and schools.<br />
DRAFT – WATERSHED USA FLOOD RISK REPORT 50
<strong>Flood</strong> – A general and temporary condition of partial or complete inundation of two or more<br />
acres of normally dry land area or of two or more properties (at least one of which is your<br />
property) from: overflow of inland or tidal waters; unusual and rapid accumulation or runoff of<br />
surface waters from any source; mudflow; or collapse or subsidence of land along the shore of<br />
a lake or similar body of water as a result of erosion or undermining caused by waves or<br />
currents of water exceeding anticipated cyclical levels that result in a flood as defined above.<br />
<strong>Flood</strong> Insurance Rate Map (FIRM) – An official map of a community, on which FEMA has<br />
delineated both the SFHAs and the risk premium zones applicable to the community. See also<br />
Digital <strong>Flood</strong> Insurance Rate Map.<br />
<strong>Flood</strong> Insurance Study (FIS) – Contains an examination, evaluation, and determination of the<br />
flood hazards of a community, and if appropriate, the corresponding water-surface elevations.<br />
<strong>Flood</strong> risk – Probability multiplied by consequence; the degree of probability that a loss or<br />
injury may occur as a result of flooding. Sometimes referred to as vulnerability.<br />
<strong>Flood</strong>borne debris impact – <strong>Flood</strong>water moving at a moderate or high velocity can carry<br />
floodborne debris that can impact buildings and damage walls and foundations.<br />
<strong>Flood</strong>wall – A long, narrow concrete or masonry wall built to protect land from flooding.<br />
<strong>Flood</strong>way (regulatory)– The channel of a river or other watercourse and that portion of the<br />
adjacent floodplain that must remain unobstructed to permit passage of the base flood without<br />
cumulatively increasing the water surface elevation more than a designated height (usually 1<br />
foot).<br />
<strong>Flood</strong>way fringe – This is the portion of the SFHA that is outside of the floodway.<br />
Flow pinch point – A point where a human-made structure constricts the flow of a river or<br />
stream.<br />
Freeboard – The height above the base flood added to a structure to reduce the potential for<br />
flooding. The increased elevation of a building above the minimum design flood level to provide<br />
additional protection for flood levels higher than the 1-percent chance flood level and to<br />
compensate for inherent inaccuracies in flood hazard mapping.<br />
HAZUS-MH – A GIS-based risk assessment methodology and software application created by<br />
FEMA and the National Institute of Building Sciences for analyzing potential losses from floods,<br />
hurricane winds, and earthquakes.<br />
High velocity flow – Typically comprised of floodwaters moving faster than 5 feet per second.<br />
DRAFT – WATERSHED USA FLOOD RISK REPORT 51
Loss Ratio– expresses loss as a fraction of the value of the local inventory (total value/ loss).<br />
Levee – A manmade structure, usually an earthen embankment, designed and constructed in<br />
accordance with sound engineering practices to contain, control, or divert the flow of water so<br />
as to provide protection from temporary flooding.<br />
Mudflow – A river of liquid and flowing mud on the surfaces of normally dry land areas, as<br />
when earth is carried by a current of water.<br />
Probability (of flood) – The likelihood that a flood will occur in a given area.<br />
<strong>Risk</strong> MAP – The vision of this FEMA strategy is to work collaboratively with State, local, and<br />
tribal entities to deliver quality flood data that increases public awareness and leads to action<br />
that reduces risk to life and property.<br />
Riverine – Of or produced by a river. Riverine floodplains have readily identifiable channels.<br />
Special <strong>Flood</strong> Hazard Area (SFHA) – Portion of the floodplain subject to inundation by the base<br />
flood.<br />
Stafford Act – Robert T. Stafford Disaster Relief and Emergency Assistance Act, PL 100-707,<br />
signed into law November 23, 1988; amended the Disaster Relief Act of 1974, PL 93-288. This<br />
Act constitutes the statutory authority for most federal disaster response activities especially as<br />
they pertain to FEMA and FEMA programs.<br />
Stillwater – A rise in the normal level of a water body.<br />
Vulnerability – Probability multiplied by consequence; the degree of probability that a loss or<br />
injury may occur as a result of flooding. Sometimes referred to as flood risk.<br />
DRAFT – WATERSHED USA FLOOD RISK REPORT 52
B. Appendix B: Additional Resources<br />
ASCE 7 – National design standard issued by the American Society of Civil Engineers, Minimum<br />
Design Loads for Buildings and Other Structures, which gives current requirements for dead,<br />
live, soil, flood, wind, snow, rain, ice, and earthquake loads, and their combinations, suitable for<br />
inclusion in building codes and other documents.<br />
ASCE 24-05 – National design standard issued by the American Society of Civil Engineers, <strong>Flood</strong><br />
Resistant Design and Construction, which outlines the requirements for flood resistant design<br />
and construction of structures in flood hazard areas.<br />
National <strong>Flood</strong> Insurance Program (NFIP), Federal Emergency Management Agency (FEMA),<br />
www.floodsmart.gov<br />
Federal Emergency Management Agency (FEMA), www.fema.gov<br />
American Society of Civil Engineers (ASCE), 2010. So, You Live Behind a Levee! Reston, VA.<br />
FEMA Publications – available at www.fema.gov<br />
Federal Emergency Management Agency (FEMA), 1985. Manufactured Home Installation in<br />
<strong>Flood</strong> Hazard Areas, FEMA 85. Washington, DC, September 1985.<br />
Federal Emergency Management Agency (FEMA) and the American Red Cross , 1992. Repairing<br />
Your <strong>Flood</strong>ed Home, FEMA 234/ARC 4476. Washington, DC, August 1992.<br />
Federal Emergency Management Agency (FEMA), 1996. Addressing Your Community’s <strong>Flood</strong><br />
Problems, FEMA 309. Washington, DC, June 1996.<br />
Federal Emergency Management Agency (FEMA), 1998. Homeowner’s Guide to Retrofitting,<br />
FEMA 312. Washington, DC, June 1998.<br />
Federal Emergency Management Agency (FEMA), 1999. Protecting Building Utilities from <strong>Flood</strong><br />
Damage, FEMA 348. Washington, DC, November 1999.<br />
Federal Emergency Management Agency (FEMA), 2003. Interim Guidance for State and Local<br />
Officials - Increased Cost of Compliance Coverage, FEMA 301. Washington, DC, September<br />
2003.<br />
Federal Emergency Management Agency (FEMA), 2000. Above the <strong>Flood</strong>: Elevating Your<br />
<strong>Flood</strong>prone House, FEMA 347. Washington, DC, May 2000.<br />
Federal Emergency Management Agency (FEMA), 2001. Understanding Your <strong>Risk</strong>s: Identifying<br />
Hazards and Estimating Losses, FEMA 386-2. Washington, DC, August 2001.<br />
Federal Emergency Management Agency (FEMA), 2002a. Getting Started: Building Support for<br />
Mitigation Planning, FEMA 386-1. Washington, DC, September 2002.<br />
Federal Emergency Management Agency (FEMA), 2002b. Integrating Manmade Hazards into<br />
Mitigation Planning, FEMA 386-7. Washington, DC, September 2002.<br />
DRAFT – WATERSHED USA FLOOD RISK REPORT 53
Federal Emergency Management Agency (FEMA), 2003a. Developing the Mitigation Plan:<br />
Identifying Mitigation Actions and Implementing Strategies, FEMA 386-3. Washington, DC, April<br />
2003.<br />
Federal Emergency Management Agency (FEMA), 2003b. Bringing the Plan to Life:<br />
Implementing the Hazard Mitigation Plan, FEMA 386-4. Washington, DC, August 2003.<br />
Federal Emergency Management Agency (FEMA), 2004a. Design Guide for Improving School<br />
Safety in Earthquakes, <strong>Flood</strong>s, and High Winds, FEMA 424. Washington, DC, January 2004.<br />
Federal Emergency Management Agency (FEMA), 2004b. Federal Guidelines for Dam Safety:<br />
Emergency Action Planning for Dam Owners, FEMA 64. Washington, DC, April 2004.<br />
Federal Emergency Management Agency (FEMA), 2005. Integrating Historic Property and<br />
Cultural Resource Considerations into Hazard Mitigation Planning, FEMA 386-6. Washington,<br />
DC, May 2005.<br />
Federal Emergency Management Agency (FEMA), 2006a. Multi-Jurisdictional Mitigation<br />
Planning, FEMA 386-8. Washington, DC, August 2006.<br />
Federal Emergency Management Agency (FEMA), 2006b. Using the Hazard Mitigation Plan to<br />
Prepare Successful Mitigation Projects, FEMA 386-9. Washington, DC, August 2008.<br />
Federal Emergency Management Agency (FEMA), 2006c. “Designing for <strong>Flood</strong> Levels Above the<br />
BFE,” Hurricane Katrina Recovery Advisory 8, Hurricane Katrina in the Gulf Coast: Building<br />
Performance Observations, Recommendations, and Technical Guidance, FEMA 549, Appendix E.<br />
Washington, DC, July 2006.<br />
Federal Emergency Management Agency (FEMA), 2007a. Property Acquisition Handbook for<br />
Local Communities, FEMA 317. Washington, DC, September 2007.<br />
Federal Emergency Management Agency (FEMA), 2007b. Public Assistance Guide, FEMA 322.<br />
Washington, DC, June 2007.<br />
Federal Emergency Management Agency (FEMA), 2007c. Using Benefit-Cost Review in<br />
Mitigation Planning, FEMA 386-5. Washington, DC, May 2007.<br />
Federal Emergency Management Agency (FEMA), 2007d. Design Guide for Improving Critical<br />
Facility Safety from <strong>Flood</strong>ing and High Winds: Providing Protection to People and Buildings,<br />
FEMA 543. Washington, DC, January 2007.<br />
Federal Emergency Management Agency (FEMA), 2007e. Selecting Appropriate Mitigation<br />
Measures for <strong>Flood</strong>prone Structures, FEMA 551. Washington, DC, March 2007.<br />
Federal Emergency Management Agency (FEMA), 2007f. Design Guide for Improving Hospital<br />
Safety in Earthquakes, <strong>Flood</strong>s, and High Winds: Providing Protection to People and Buildings,<br />
FEMA 577. Washington, DC, June 2007.<br />
Federal Emergency Management Agency (FEMA), 2008. Reducing <strong>Flood</strong> Losses Through the<br />
International Codes: Meeting the Requirements of the National <strong>Flood</strong> Insurance Program, FEMA<br />
9-0372, Third Edition. Washington, DC, December 2007.<br />
DRAFT – WATERSHED USA FLOOD RISK REPORT 54
C. Appendix C: Data Used to Develop <strong>Flood</strong> <strong>Risk</strong> Products<br />
Editorial Note: This appendix will include paragraphs of free-form text describing the data leveraged by the<br />
local/state stakeholders in the production of this <strong>Risk</strong> MAP project.<br />
DRAFT – WATERSHED USA FLOOD RISK REPORT 55
DRAFT – WATERSHED USA FLOOD RISK REPORT 56